 23
23peptides
spectra
0.000 | 0.000
0.000 | 0.000
0.000 | 0.000
0.683 | 0.690
0.269 | 0.277
0.000 | 0.000
0.000 | 0.000
0.039 | 0.041
| Plot | Mito | Lyso | Perox | ER | Golgi | PM | Cytosol | Nucleus | |||||
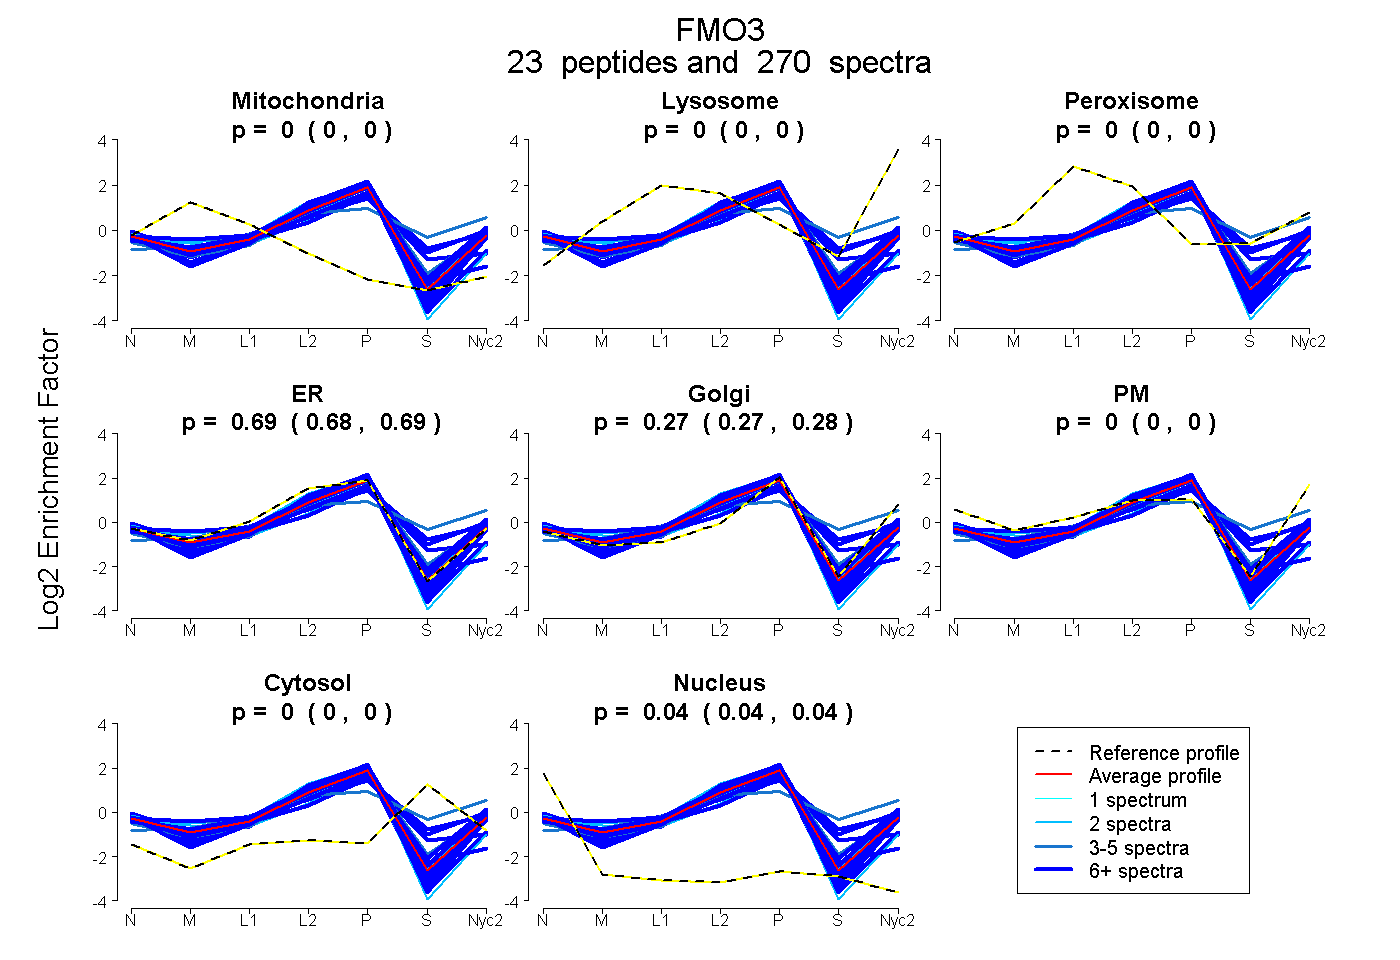
| Expt A |
23 peptides |
270 spectra |
|
0.000 0.000 | 0.000 |
0.000 0.000 | 0.000 |
0.000 0.000 | 0.000 |
0.687 0.683 | 0.690 |
0.273 0.269 | 0.277 |
0.000 0.000 | 0.000 |
0.000 0.000 | 0.000 |
0.040 0.039 | 0.041 |
| 14 spectra, ASIYQSVFTNSSK | 0.000 | 0.000 | 0.136 | 0.391 | 0.281 | 0.000 | 0.191 | 0.000 | ||
| 25 spectra, SGSWVMSR | 0.000 | 0.000 | 0.000 | 0.724 | 0.276 | 0.000 | 0.000 | 0.000 | ||
| 10 spectra, SCLEEGLEPTCFER | 0.000 | 0.000 | 0.000 | 0.851 | 0.000 | 0.000 | 0.031 | 0.117 | ||
| 19 spectra, WAAQVIR | 0.029 | 0.000 | 0.000 | 0.708 | 0.203 | 0.060 | 0.000 | 0.000 | ||
| 2 spectra, DVGGIQKPCLYSHFLR | 0.069 | 0.000 | 0.000 | 0.418 | 0.501 | 0.000 | 0.000 | 0.012 | ||
| 2 spectra, ILCGTVSIKPNVK | 0.000 | 0.000 | 0.000 | 0.941 | 0.000 | 0.000 | 0.000 | 0.059 | ||
| 8 spectra, WEVTTEK | 0.000 | 0.000 | 0.000 | 0.670 | 0.315 | 0.000 | 0.000 | 0.015 | ||
| 11 spectra, NAILTQWDR | 0.000 | 0.000 | 0.000 | 0.764 | 0.230 | 0.000 | 0.000 | 0.006 | ||
| 26 spectra, EPVFNDELPAR | 0.000 | 0.000 | 0.000 | 0.731 | 0.234 | 0.000 | 0.000 | 0.035 | ||
| 9 spectra, NNEVTLYK | 0.000 | 0.000 | 0.000 | 0.715 | 0.268 | 0.000 | 0.000 | 0.018 | ||
| 16 spectra, FQTFLK | 0.000 | 0.000 | 0.000 | 0.787 | 0.164 | 0.000 | 0.000 | 0.050 | ||
| 5 spectra, LQEYITSFATEK | 0.000 | 0.000 | 0.000 | 0.620 | 0.349 | 0.000 | 0.000 | 0.031 | ||
| 10 spectra, VAVIGAGVSGLAAIR | 0.000 | 0.000 | 0.000 | 0.486 | 0.396 | 0.020 | 0.094 | 0.003 | ||
| 29 spectra, DSFPGLNR | 0.009 | 0.000 | 0.000 | 0.598 | 0.370 | 0.010 | 0.000 | 0.013 | ||
| 4 spectra, NNLPTAISDWWYMK | 0.000 | 0.043 | 0.000 | 0.634 | 0.217 | 0.000 | 0.105 | 0.000 | ||
| 7 spectra, VWNDGYPWDMVVITR | 0.000 | 0.000 | 0.000 | 0.642 | 0.328 | 0.000 | 0.029 | 0.000 | ||
| 15 spectra, FSDHTEEGR | 0.000 | 0.000 | 0.023 | 0.406 | 0.292 | 0.000 | 0.278 | 0.000 | ||
| 15 spectra, YIQFETLVTR | 0.000 | 0.000 | 0.000 | 0.711 | 0.272 | 0.000 | 0.000 | 0.016 | ||
| 2 spectra, EPGTWK | 0.063 | 0.000 | 0.000 | 0.568 | 0.369 | 0.000 | 0.000 | 0.000 | ||
| 22 spectra, LVGPGK | 0.000 | 0.000 | 0.000 | 0.744 | 0.217 | 0.000 | 0.000 | 0.039 | ||
| 7 spectra, GTCILPSVNDMMDDIDEK | 0.000 | 0.000 | 0.000 | 0.742 | 0.000 | 0.000 | 0.239 | 0.019 | ||
| 5 spectra, HENYGLMPLNGTLR | 0.000 | 0.082 | 0.102 | 0.186 | 0.137 | 0.214 | 0.280 | 0.000 | ||
| 7 spectra, CPDFSTTGK | 0.054 | 0.000 | 0.000 | 0.877 | 0.014 | 0.000 | 0.000 | 0.054 |
| Plot | Mito | Lyso or Perox | ER | Golgi | PM | Cytosol | Nucleus | ||||||
| Expt B |
19 peptides |
91 spectra |
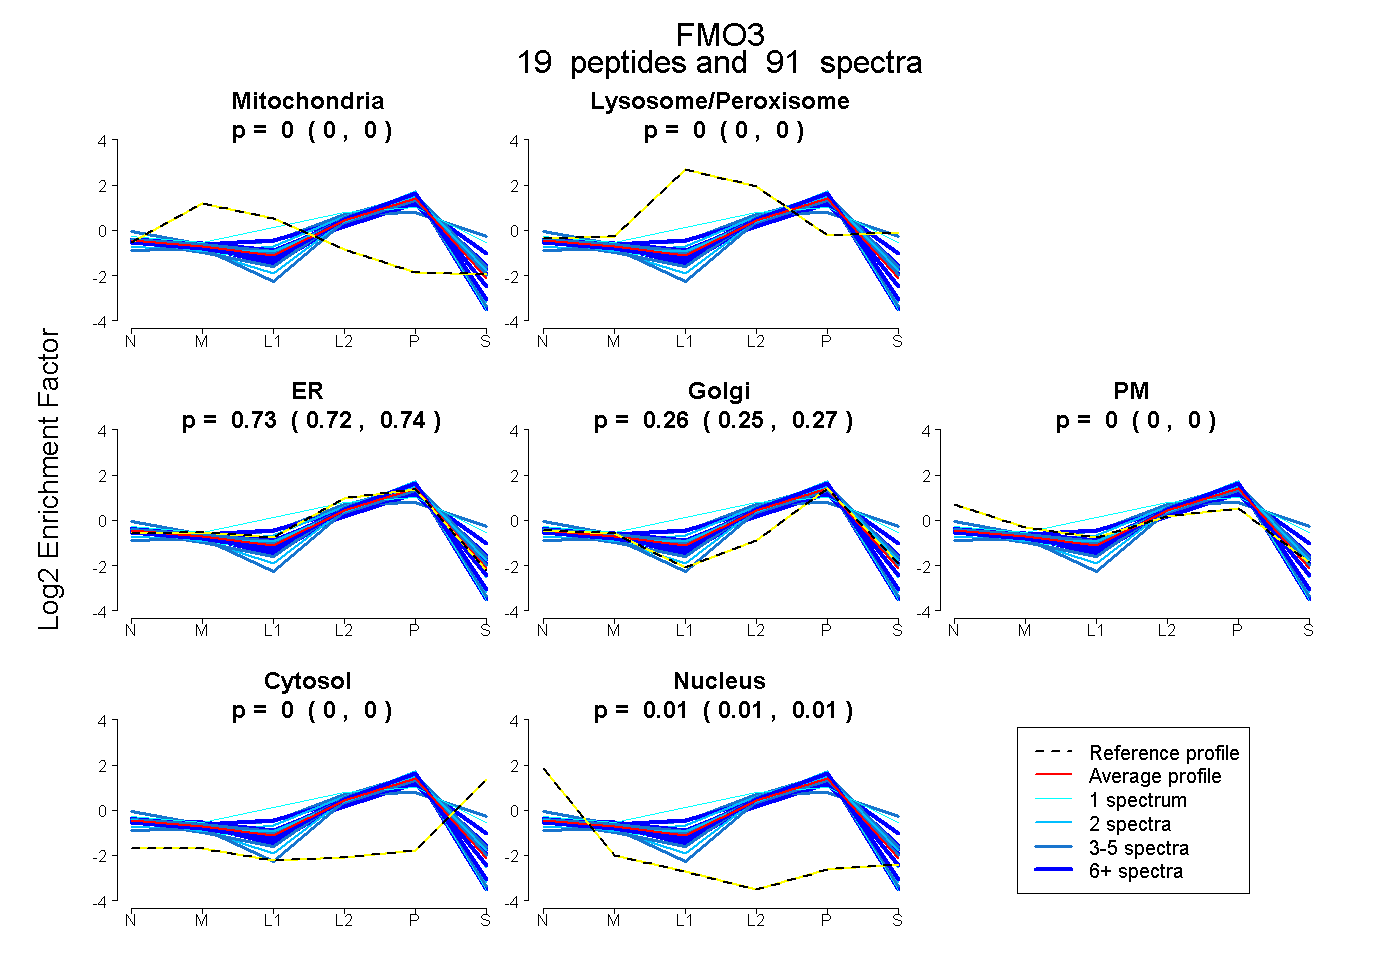 |
0.000 0.000 | 0.000 |
0.000 0.000 | 0.000 |
0.729 0.720 | 0.736 |
0.259 0.250 | 0.268 |
0.000 0.000 | 0.000 |
0.000 0.000 | 0.000 |
0.011 0.009 | 0.013 |
|||
| Plot | Lyso | Other | |||||||||||
| Expt C |
25 peptides |
284 spectra |
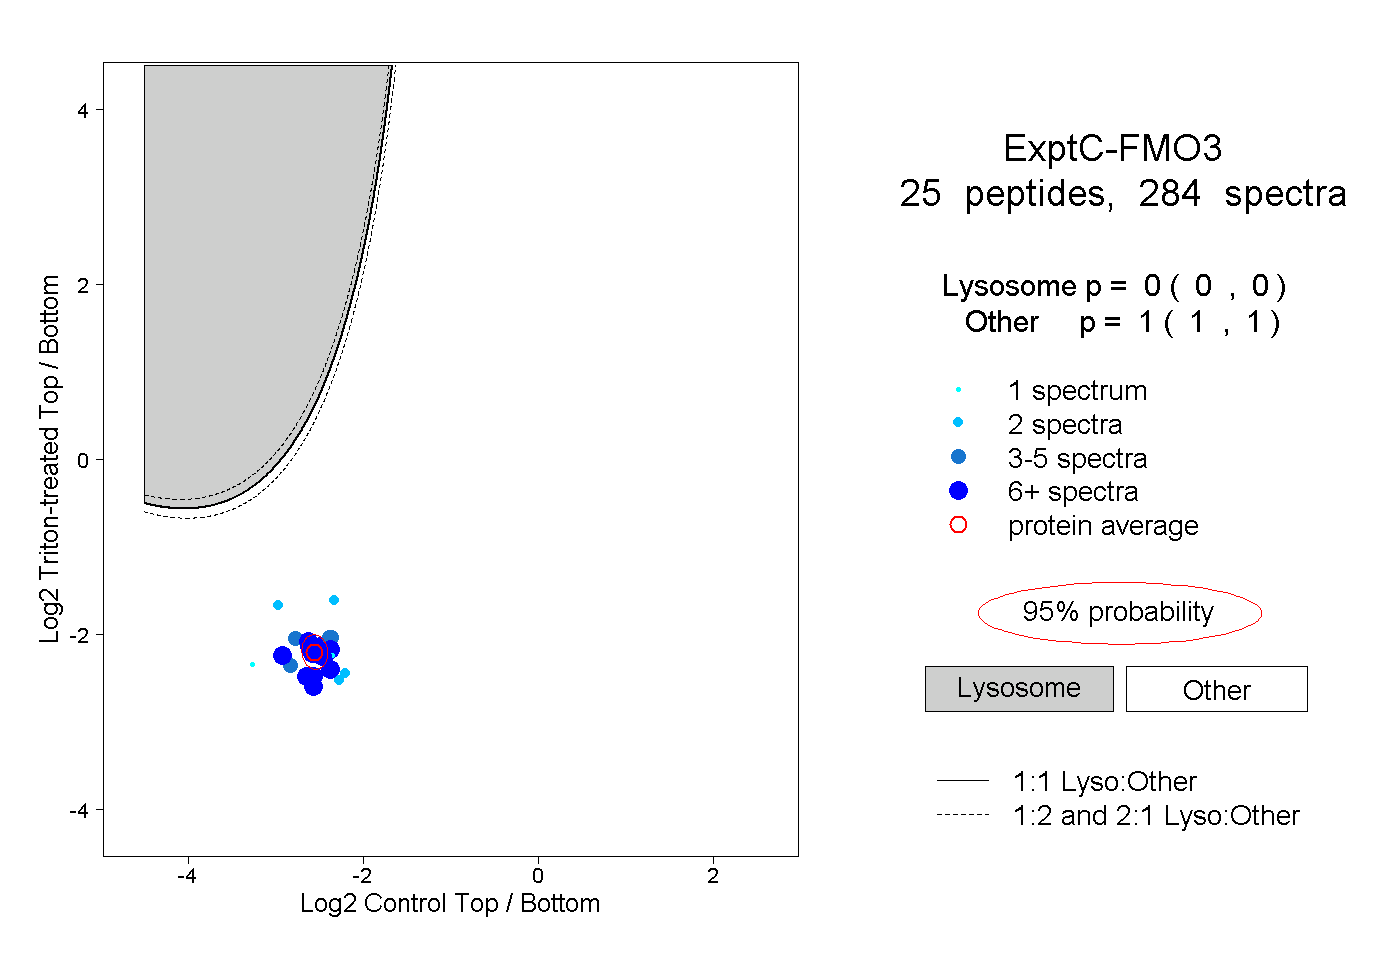 |
0.000 0.000 | 0.000 |
1.000 1.000 | 1.000 |
||||||||
| Plot | Lyso | Other | |||||||||||
| Expt D |
8 peptides |
37 spectra |
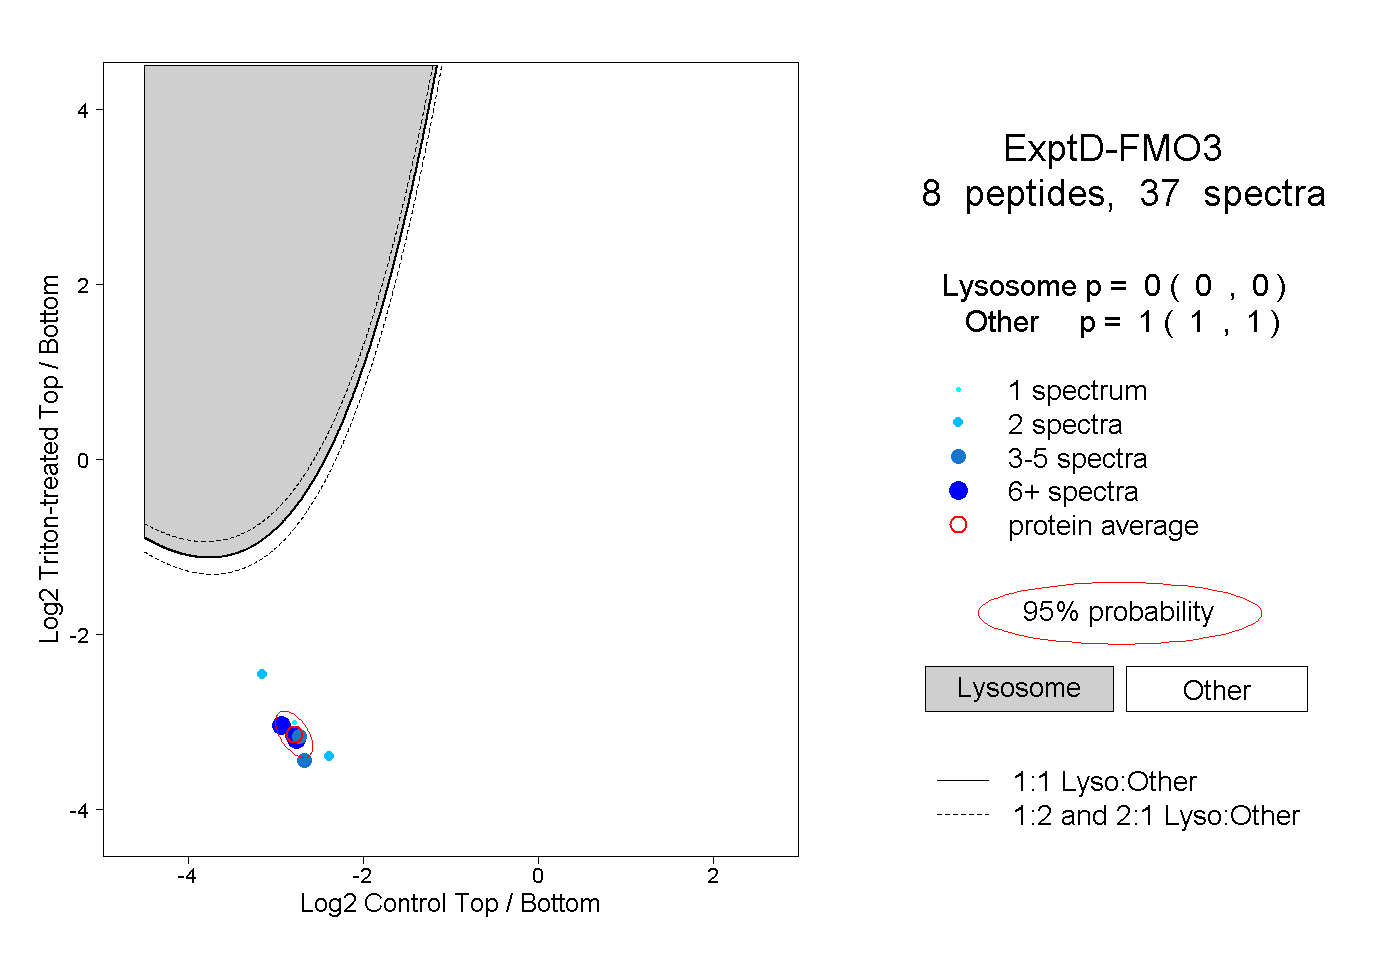 |
0.000 0.000 | 0.000 |
1.000 1.000 | 1.000 |