 8
8peptides
spectra
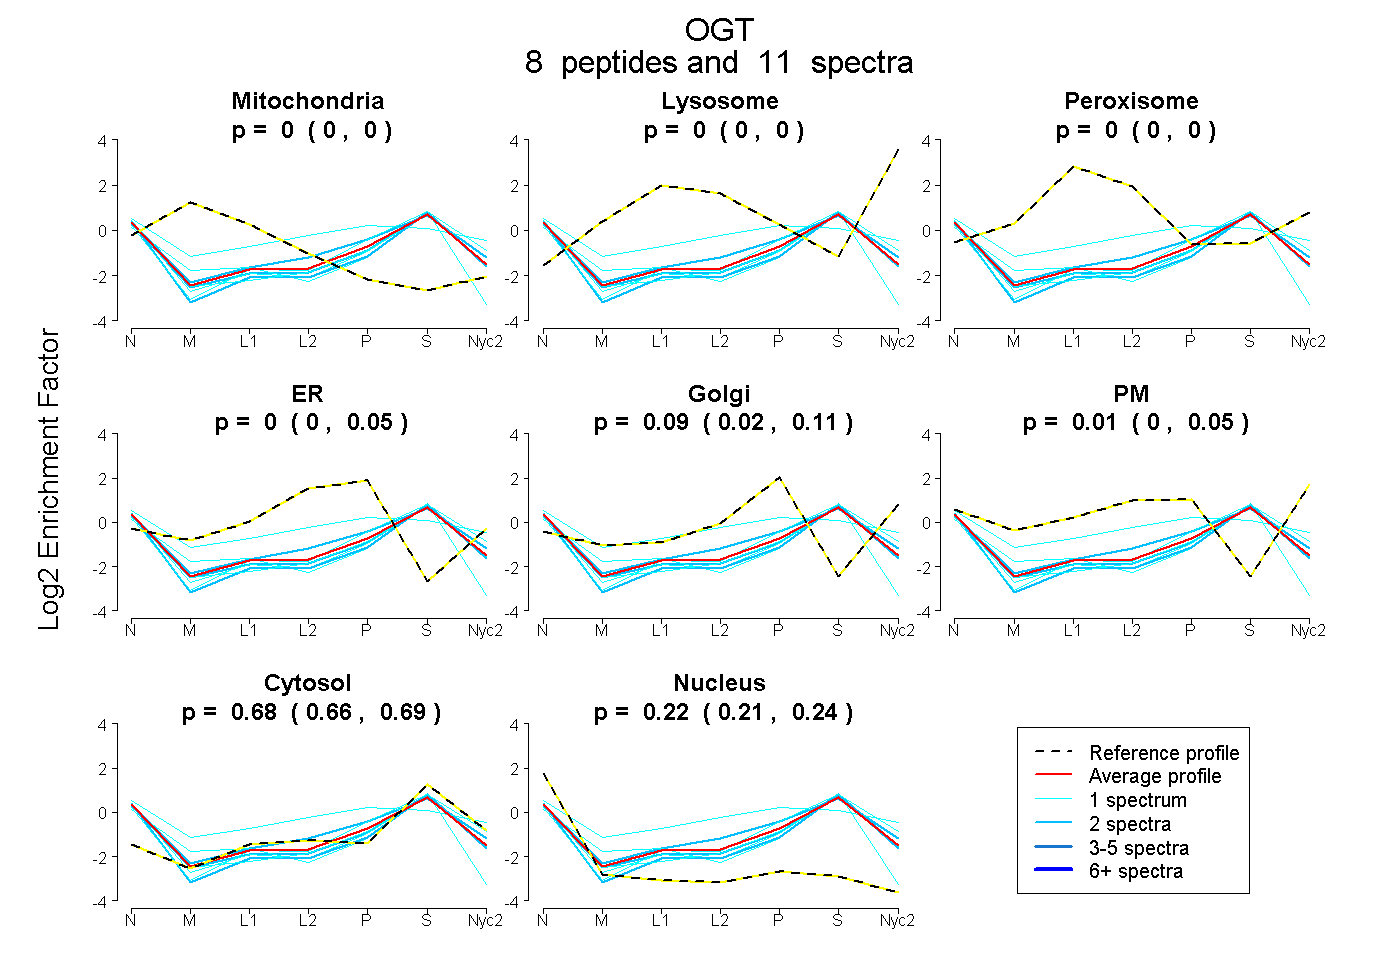
0.000 | 0.000
0.000 | 0.000
0.000 | 0.000
0.000 | 0.047
0.020 | 0.107
0.000 | 0.052
0.664 | 0.688
0.208 | 0.238
2peptides
spectra
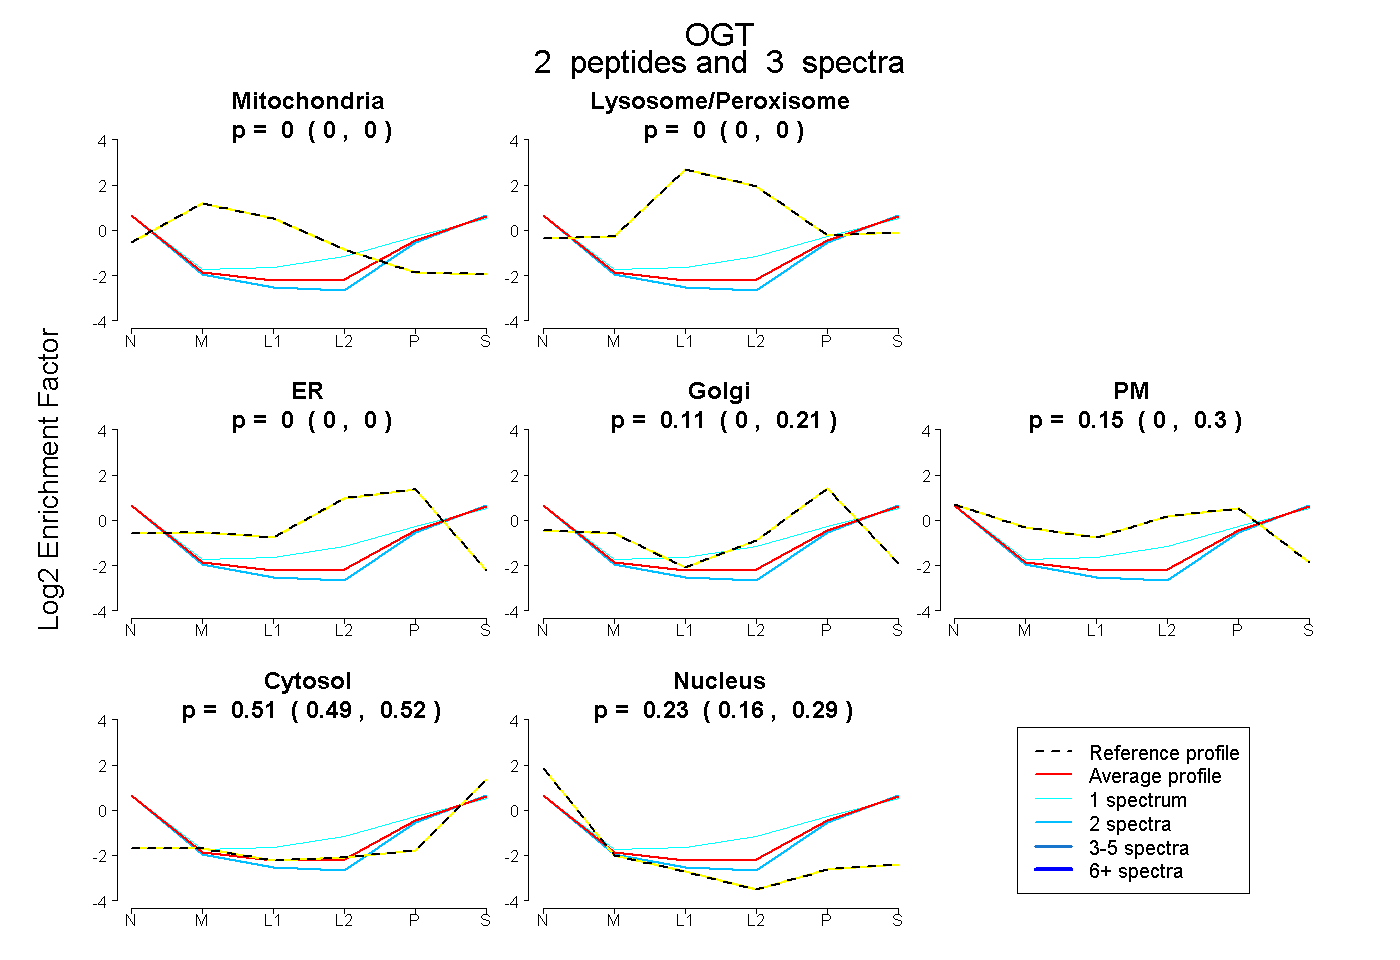
0.000 | 0.000
0.000 | 0.000
0.000 | 0.000
0.000 | 0.212
0.000 | 0.296
0.494 | 0.523
0.160 | 0.287
4peptides
spectra
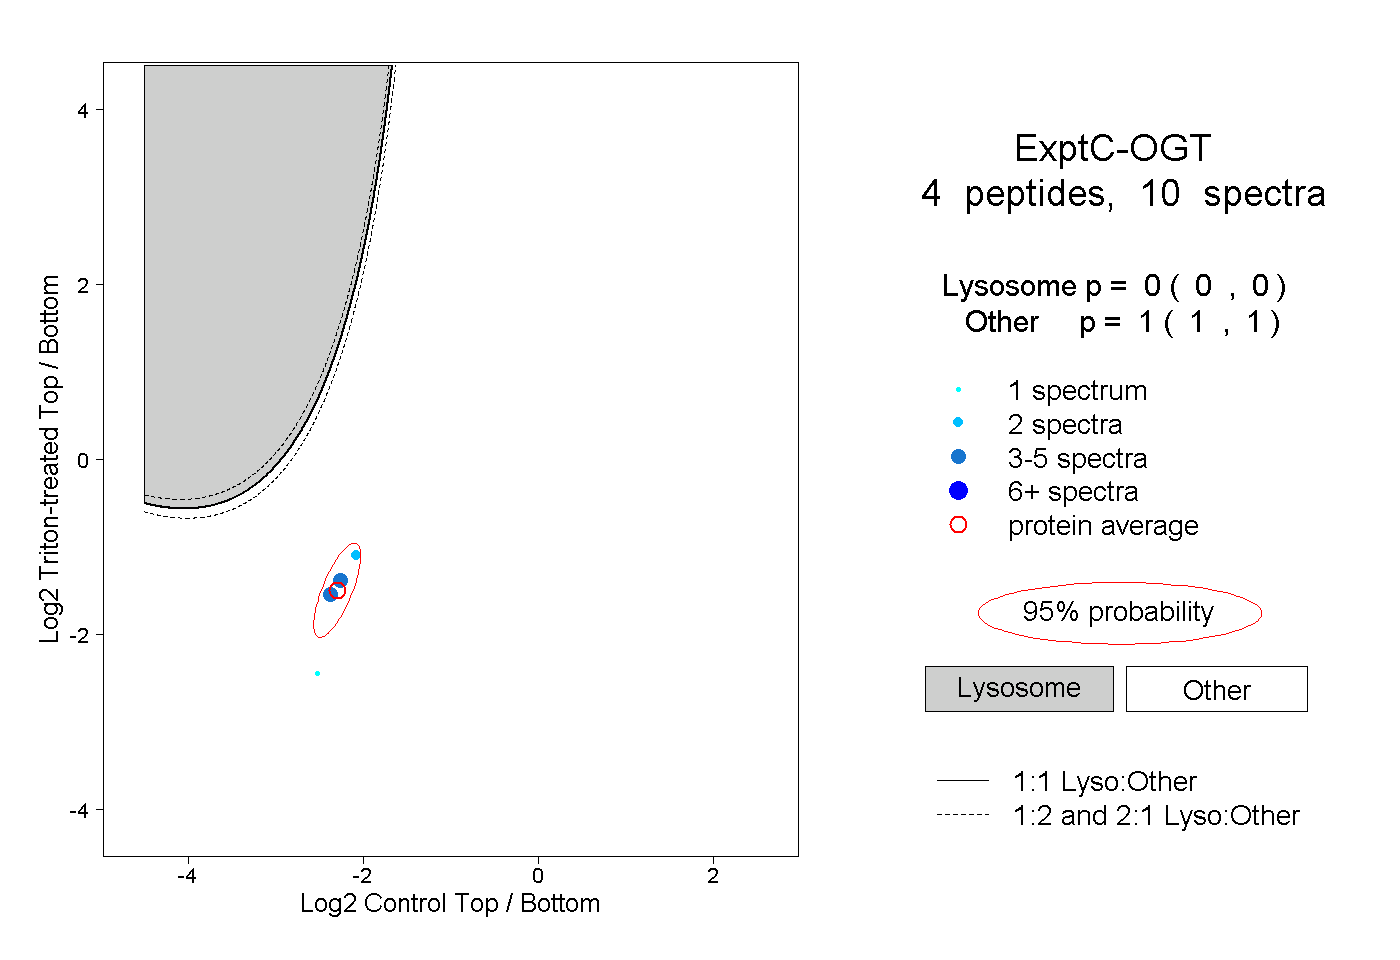
0.000 | 0.000
1.000 | 1.000
1peptide
spectrum
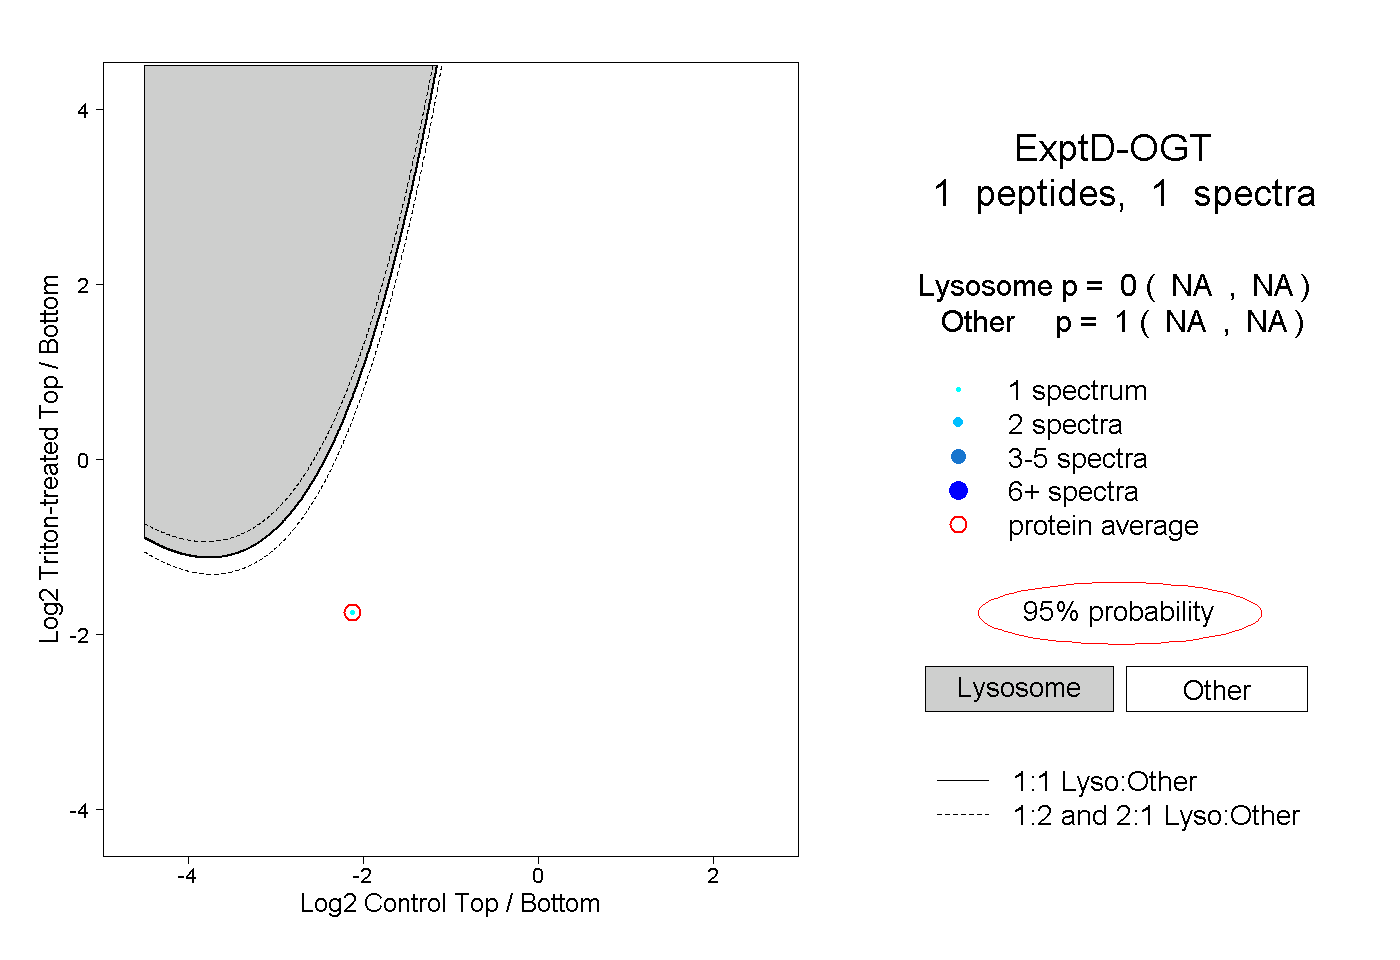
NA | NA
NA | NA