 8
8peptides
spectra
0.000 | 0.000
0.000 | 0.000
0.000 | 0.000
0.000 | 0.047
0.020 | 0.107
0.000 | 0.052
0.664 | 0.688
0.208 | 0.238
| Plot | Mito | Lyso | Perox | ER | Golgi | PM | Cytosol | Nucleus | |||||
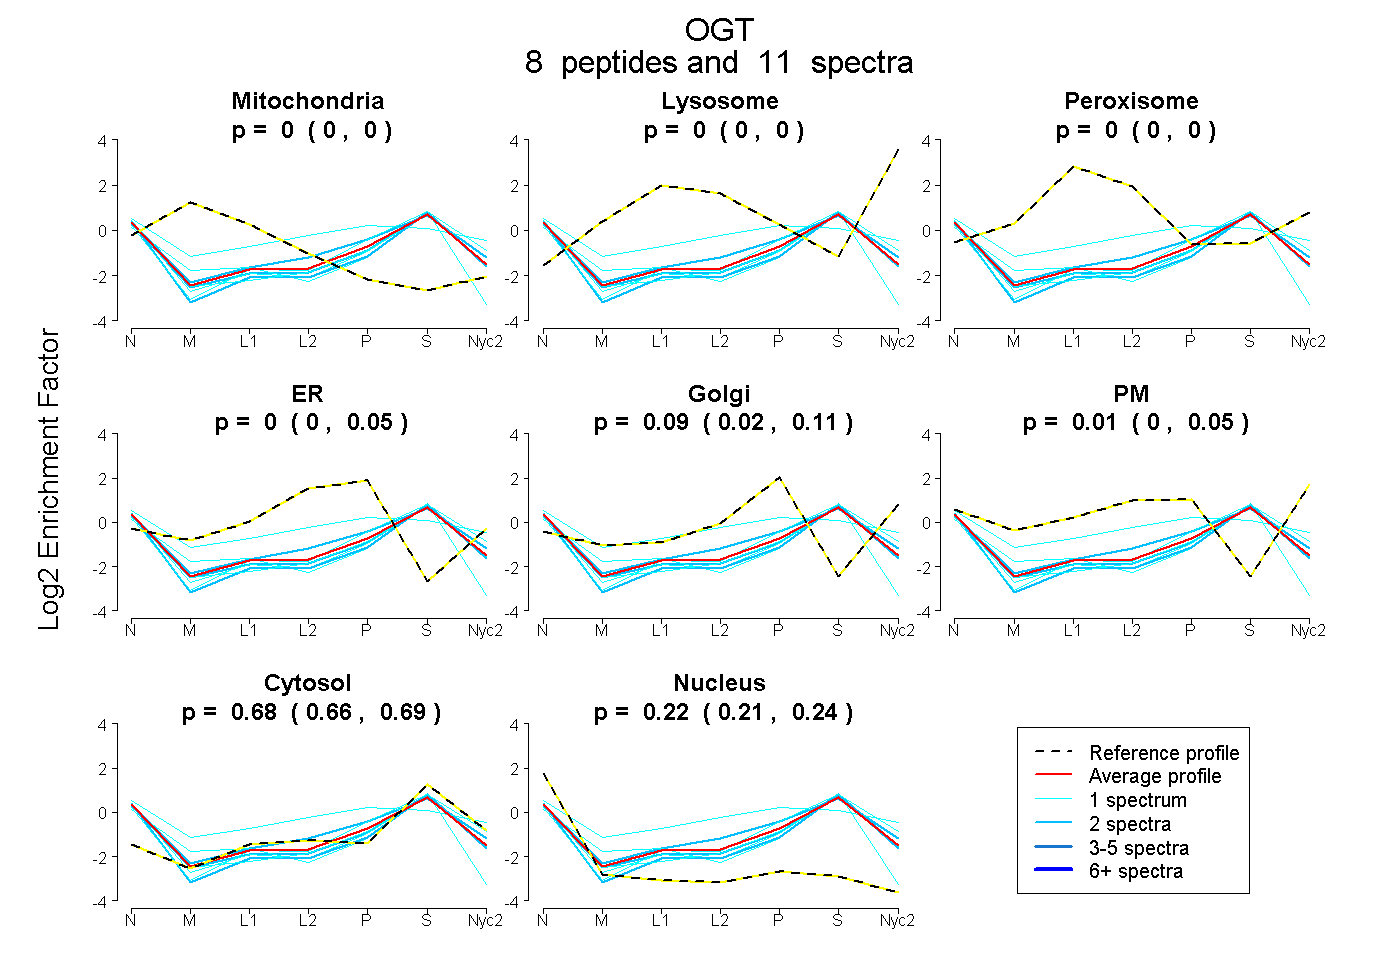
| Expt A |
8 peptides |
11 spectra |
|
0.000 0.000 | 0.000 |
0.000 0.000 | 0.000 |
0.000 0.000 | 0.000 |
0.000 0.000 | 0.047 |
0.086 0.020 | 0.107 |
0.014 0.000 | 0.052 |
0.677 0.664 | 0.688 |
0.224 0.208 | 0.238 |
| 1 spectrum, EQGNIEEAVR | 0.000 | 0.000 | 0.000 | 0.000 | 0.030 | 0.000 | 0.708 | 0.262 | ||
| 1 spectrum, GSVAEAEDCYNTALR | 0.000 | 0.000 | 0.053 | 0.114 | 0.000 | 0.308 | 0.455 | 0.070 | ||
| 1 spectrum, EMQDVQGALQCYTR | 0.054 | 0.000 | 0.000 | 0.000 | 0.000 | 0.000 | 0.617 | 0.329 | ||
| 2 spectra, AATGEEVPR | 0.000 | 0.000 | 0.000 | 0.048 | 0.070 | 0.063 | 0.652 | 0.166 | ||
| 1 spectrum, IVLNGIDLK | 0.000 | 0.000 | 0.000 | 0.000 | 0.122 | 0.000 | 0.723 | 0.156 | ||
| 2 spectra, AVIDFK | 0.000 | 0.000 | 0.000 | 0.000 | 0.045 | 0.000 | 0.708 | 0.247 | ||
| 2 spectra, EYQAGDFEAAER | 0.000 | 0.000 | 0.000 | 0.000 | 0.000 | 0.000 | 0.716 | 0.284 | ||
| 1 spectrum, IIFSPVAPK | 0.000 | 0.000 | 0.000 | 0.000 | 0.054 | 0.000 | 0.680 | 0.266 |
| Plot | Mito | Lyso or Perox | ER | Golgi | PM | Cytosol | Nucleus | ||||||
| Expt B |
2 peptides |
3 spectra |
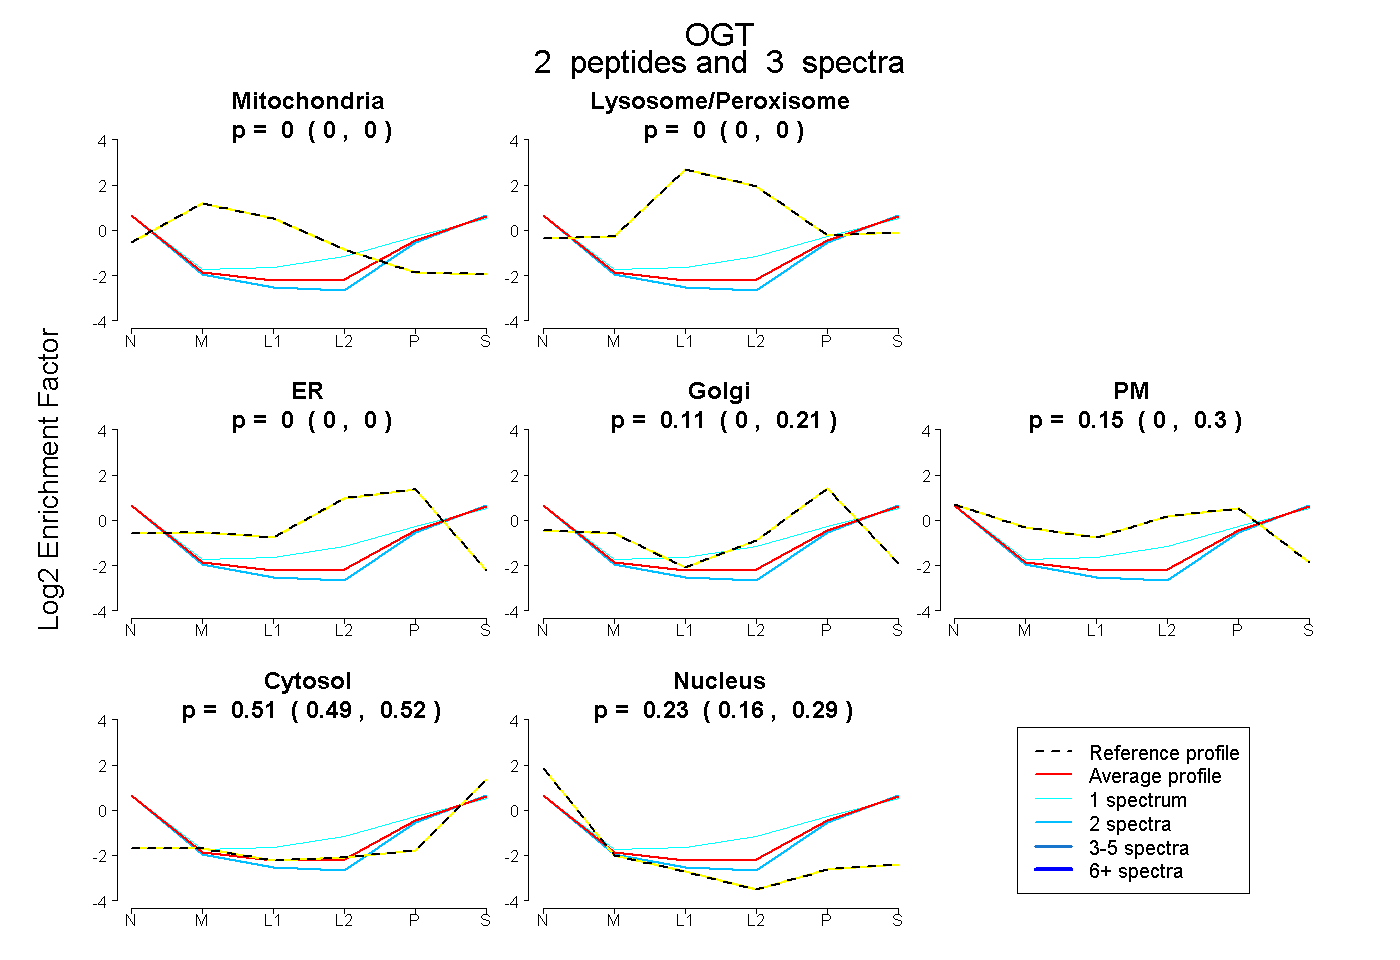 |
0.000 0.000 | 0.000 |
0.000 0.000 | 0.000 |
0.000 0.000 | 0.000 |
0.111 0.000 | 0.212 |
0.151 0.000 | 0.296 |
0.510 0.494 | 0.523 |
0.229 0.160 | 0.287 |
|||
| Plot | Lyso | Other | |||||||||||
| Expt C |
4 peptides |
10 spectra |
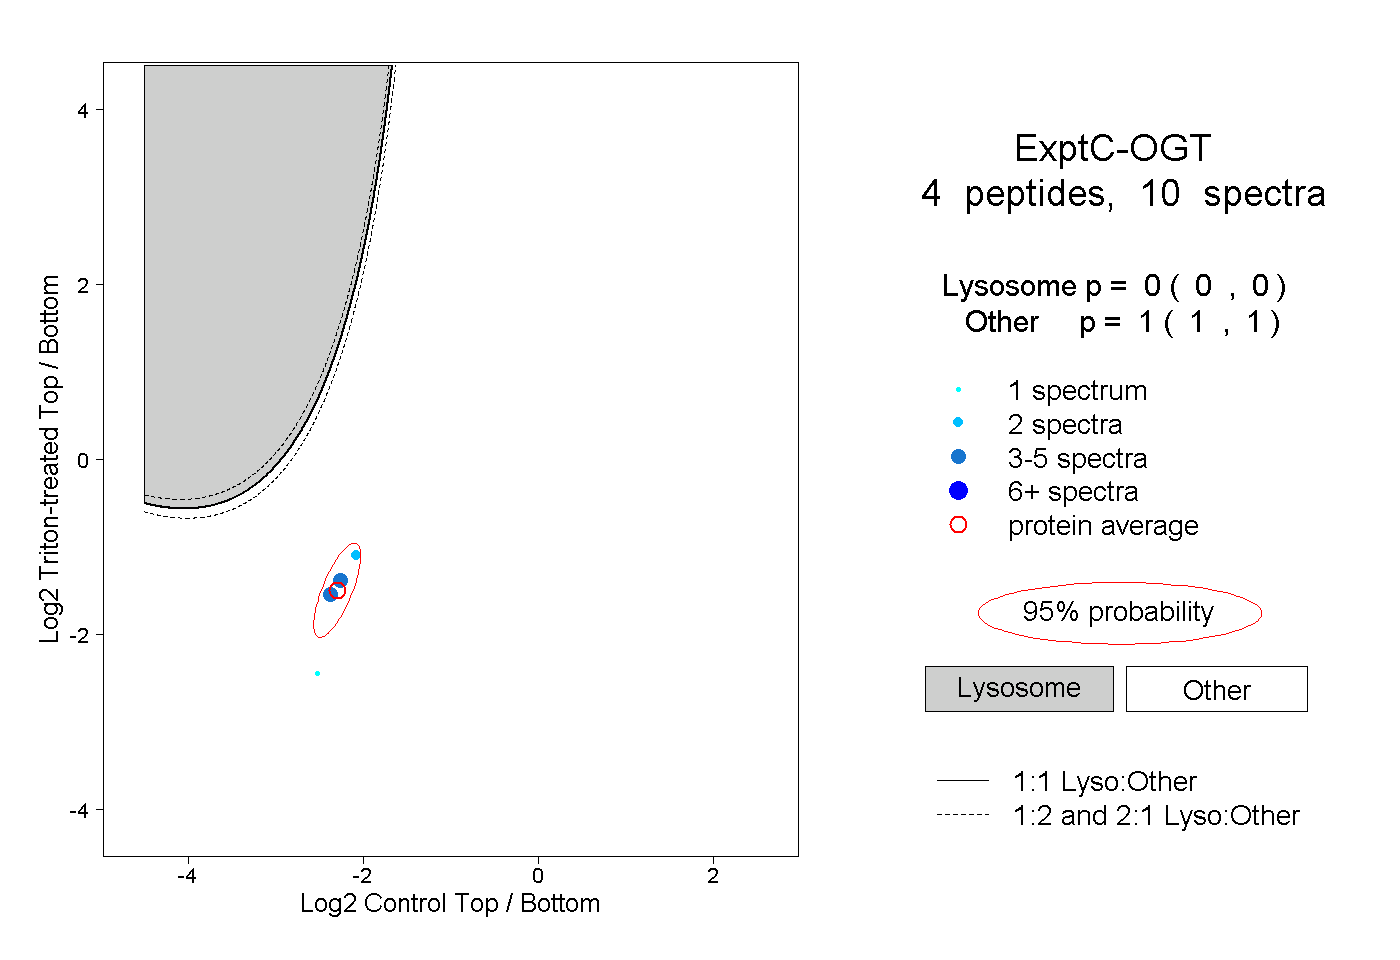 |
0.000 0.000 | 0.000 |
1.000 1.000 | 1.000 |
||||||||
| Plot | Lyso | Other | |||||||||||
| Expt D |
1 peptide |
1 spectrum |
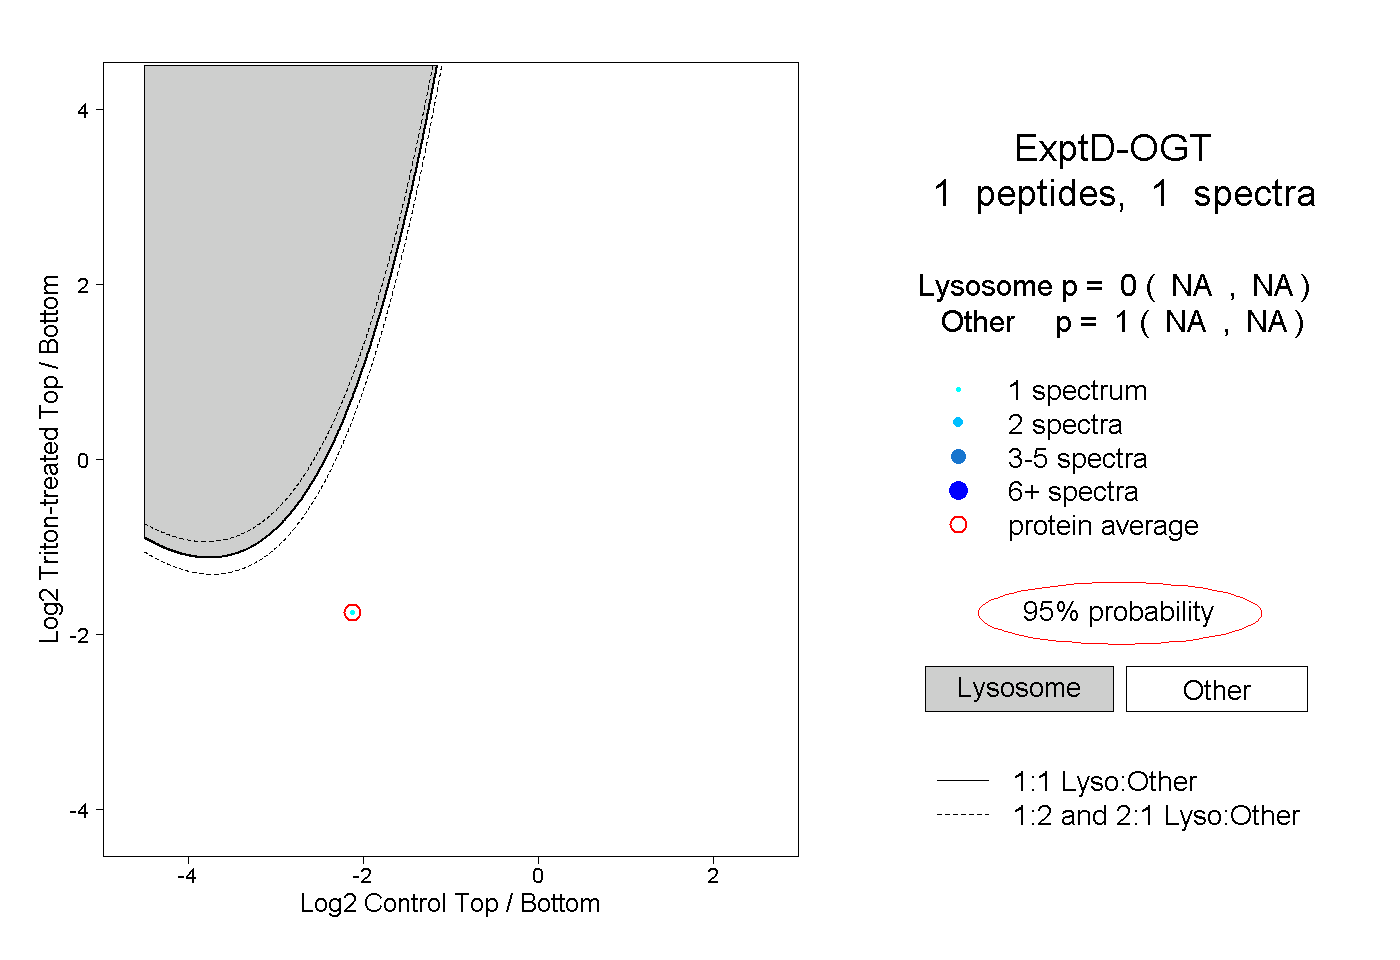 |
0.000 NA | NA |
1.000 NA | NA |