OGT
[ENSRNOP00000004692]
Main page
| | | Plot |
Mito |
Lyso |
|
Perox |
ER |
Golgi |
PM |
Cytosol |
Nucleus |
|
| Expt A |
 8
8
peptides |
11
spectra |
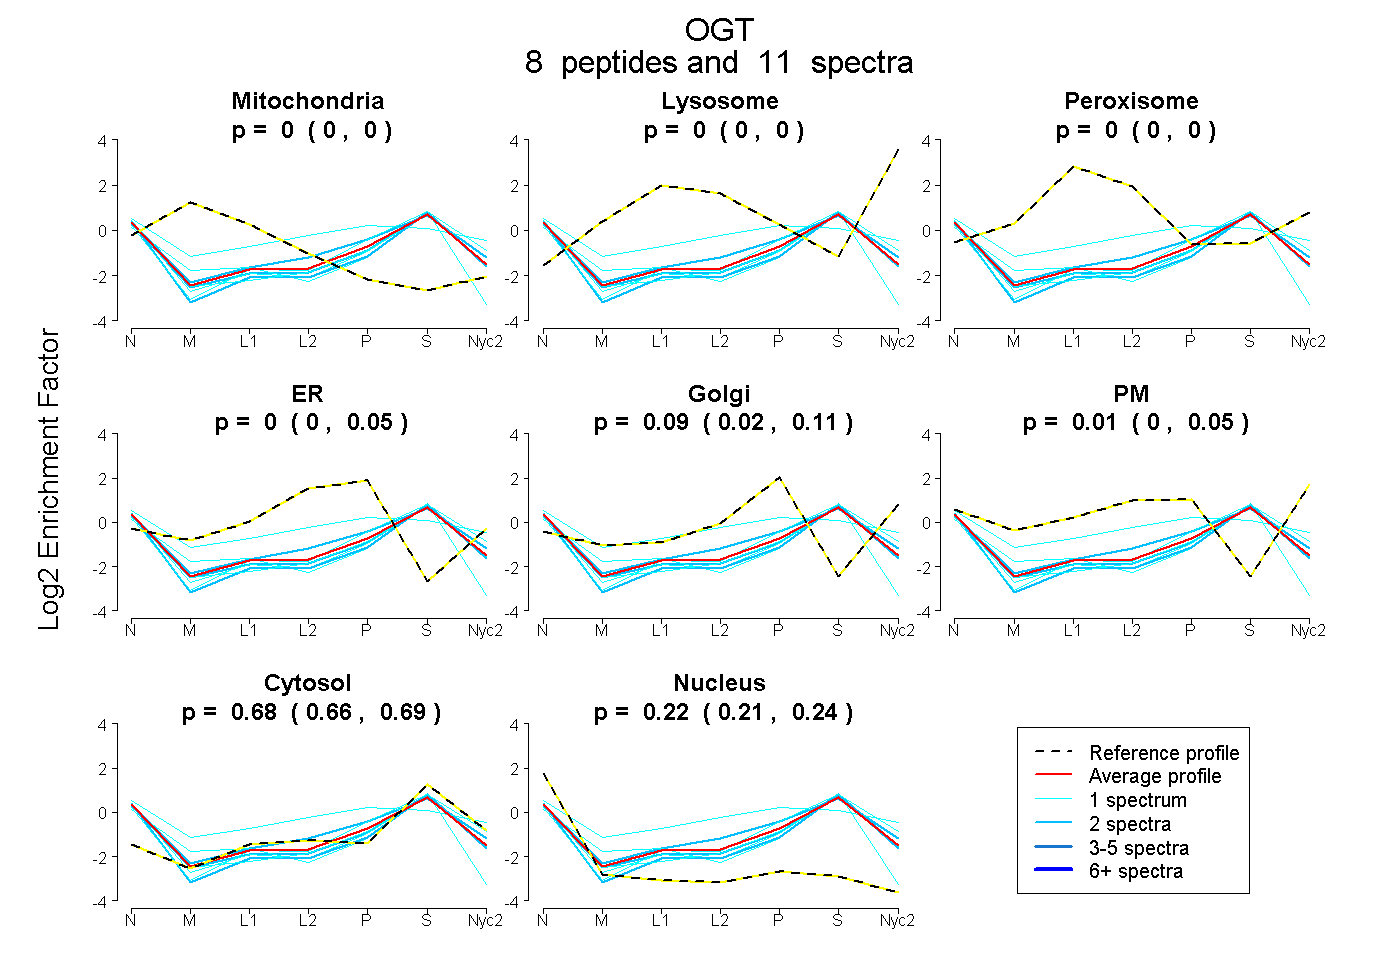 |
0.000
0.000 | 0.000 |
0.000
0.000 | 0.000 |
|
0.000
0.000 | 0.000 |
0.000
0.000 | 0.047 |
0.086
0.020 | 0.107 |
0.014
0.000 | 0.052 |
0.677
0.664 | 0.688 |
0.224
0.208 | 0.238 |
|
| | | Plot |
Mito |
|
Lyso or Perox |
|
ER |
Golgi |
PM |
Cytosol |
Nucleus |
|
| Expt B |
2
peptides |
3
spectra |
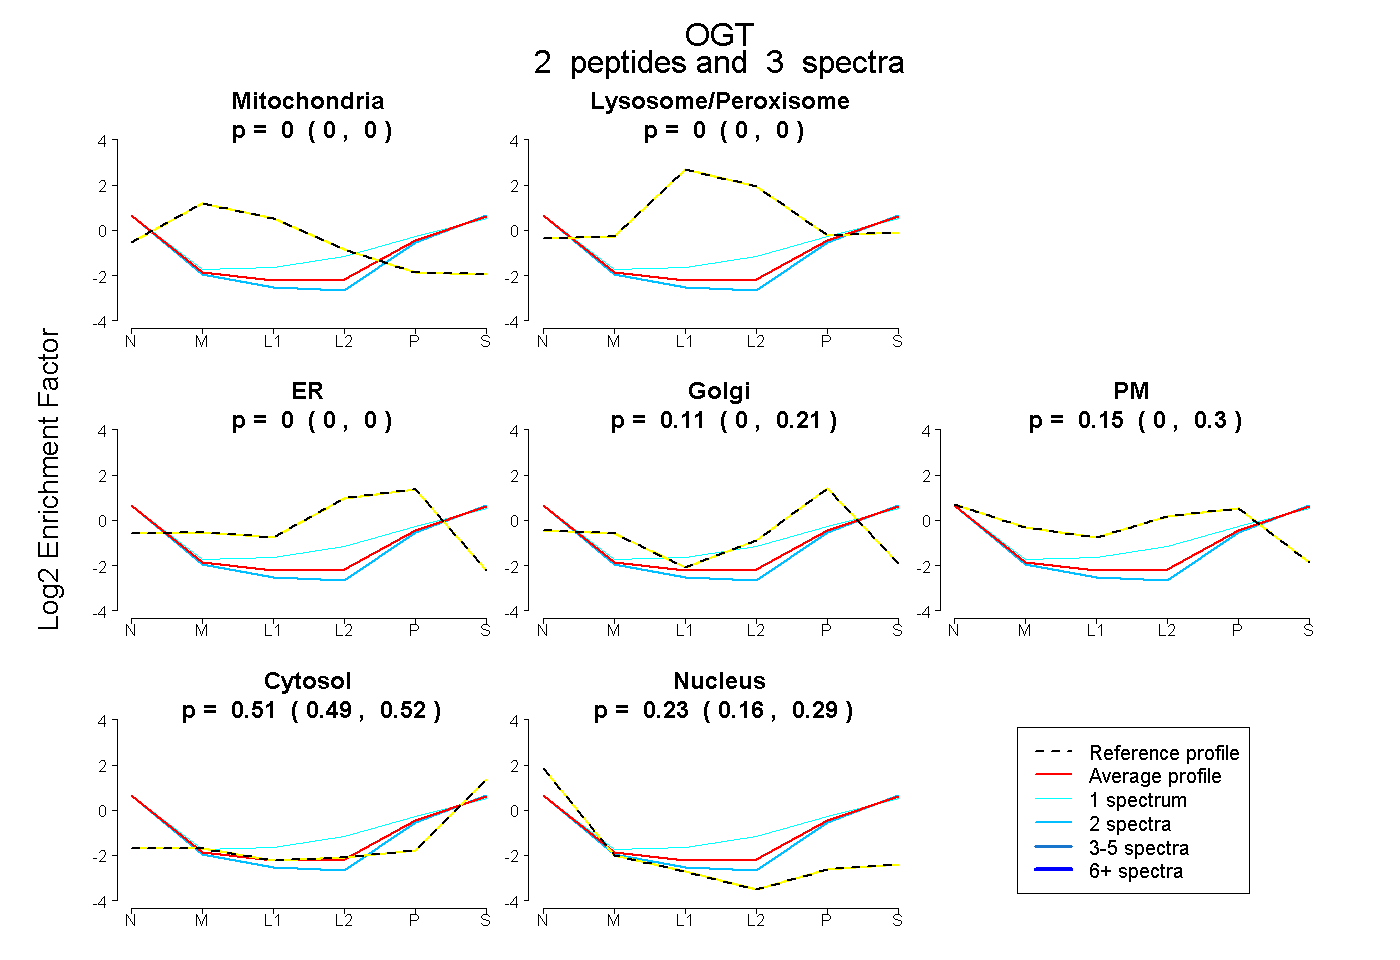 |
0.000
0.000 | 0.000 |
|
0.000
0.000 | 0.000 |
|
0.000
0.000 | 0.000 |
0.111
0.000 | 0.212 |
0.151
0.000 | 0.296 |
0.510
0.494 | 0.523 |
0.229
0.160 | 0.287 |
|
| 2 spectra, EQGNIEEAVR |
0.000 |
|
0.000 |
|
0.000 |
0.185 |
0.000 |
0.516 |
0.299 |
|
| 1 spectrum, AATGEEVPR |
0.000 |
|
0.006 |
|
0.000 |
0.000 |
0.436 |
0.477 |
0.081 |
|
| | | Plot |
|
Lyso |
|
|
|
|
|
|
|
Other |
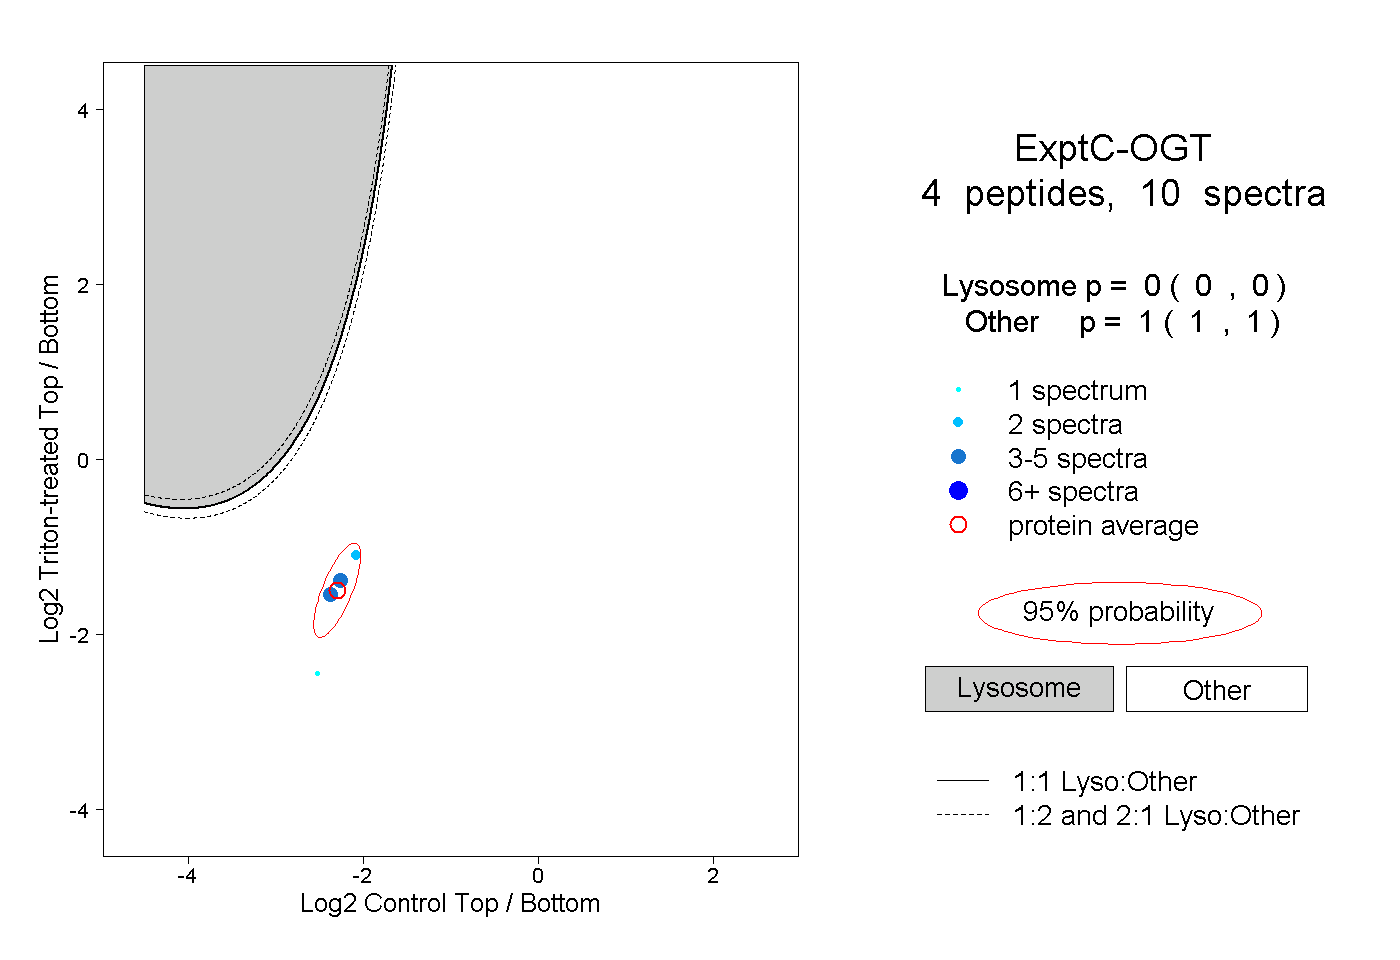
| Expt C |
4
peptides |
10
spectra |
 |
|
0.000
0.000 | 0.000 |
|
|
|
|
|
|
|
1.000
1.000 | 1.000 |
| | | Plot |
|
Lyso |
|
|
|
|
|
|
|
Other |
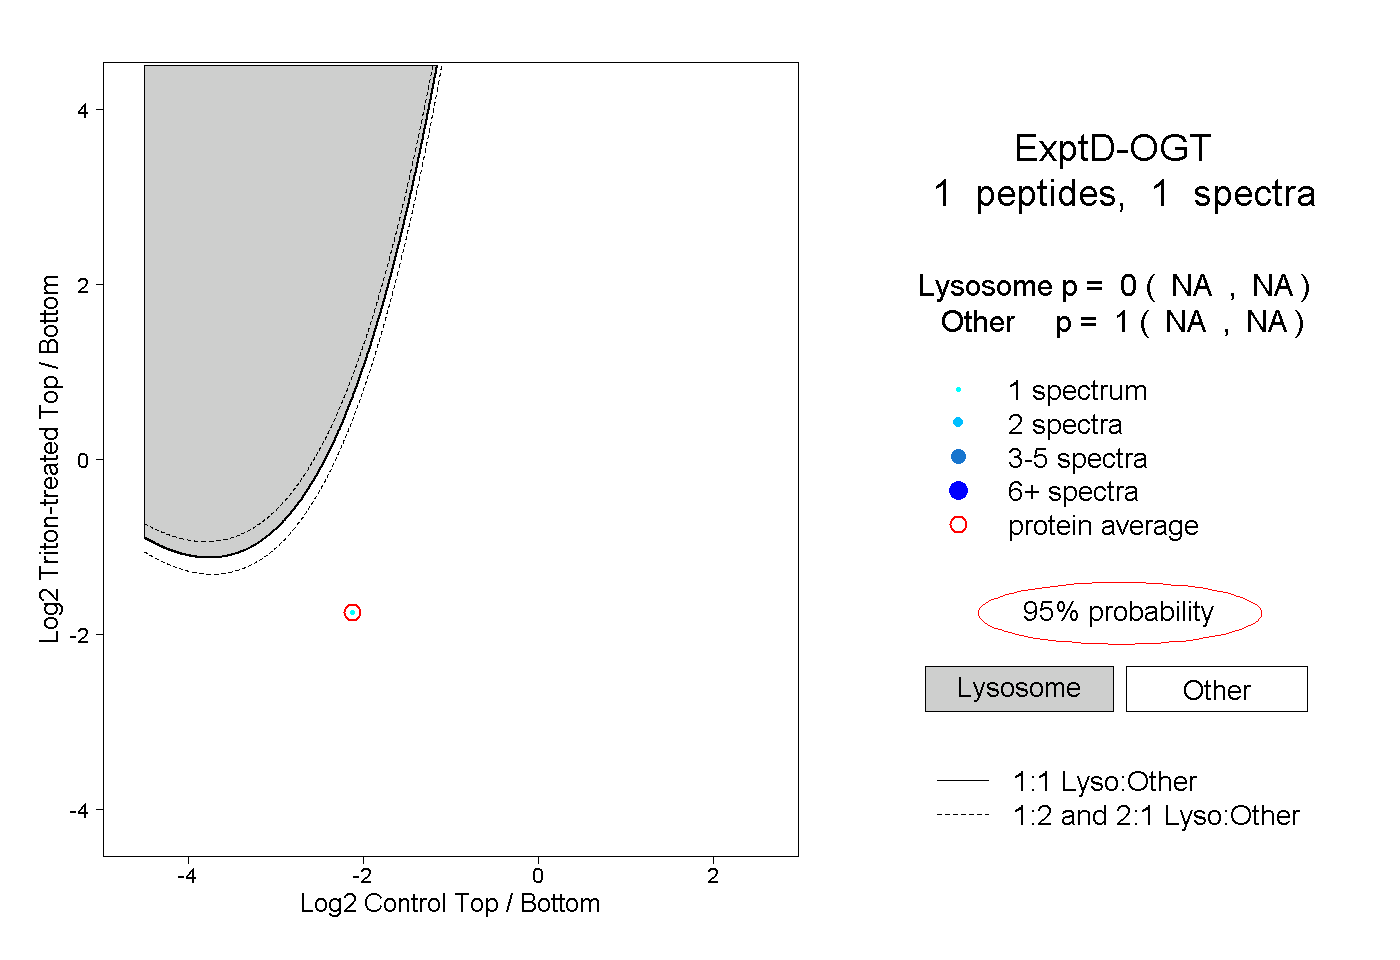
| Expt D |
1
peptide |
1
spectrum |
 |
|
0.000
NA | NA |
|
|
|
|
|
|
|
1.000
NA | NA |