 15
15peptides
spectra
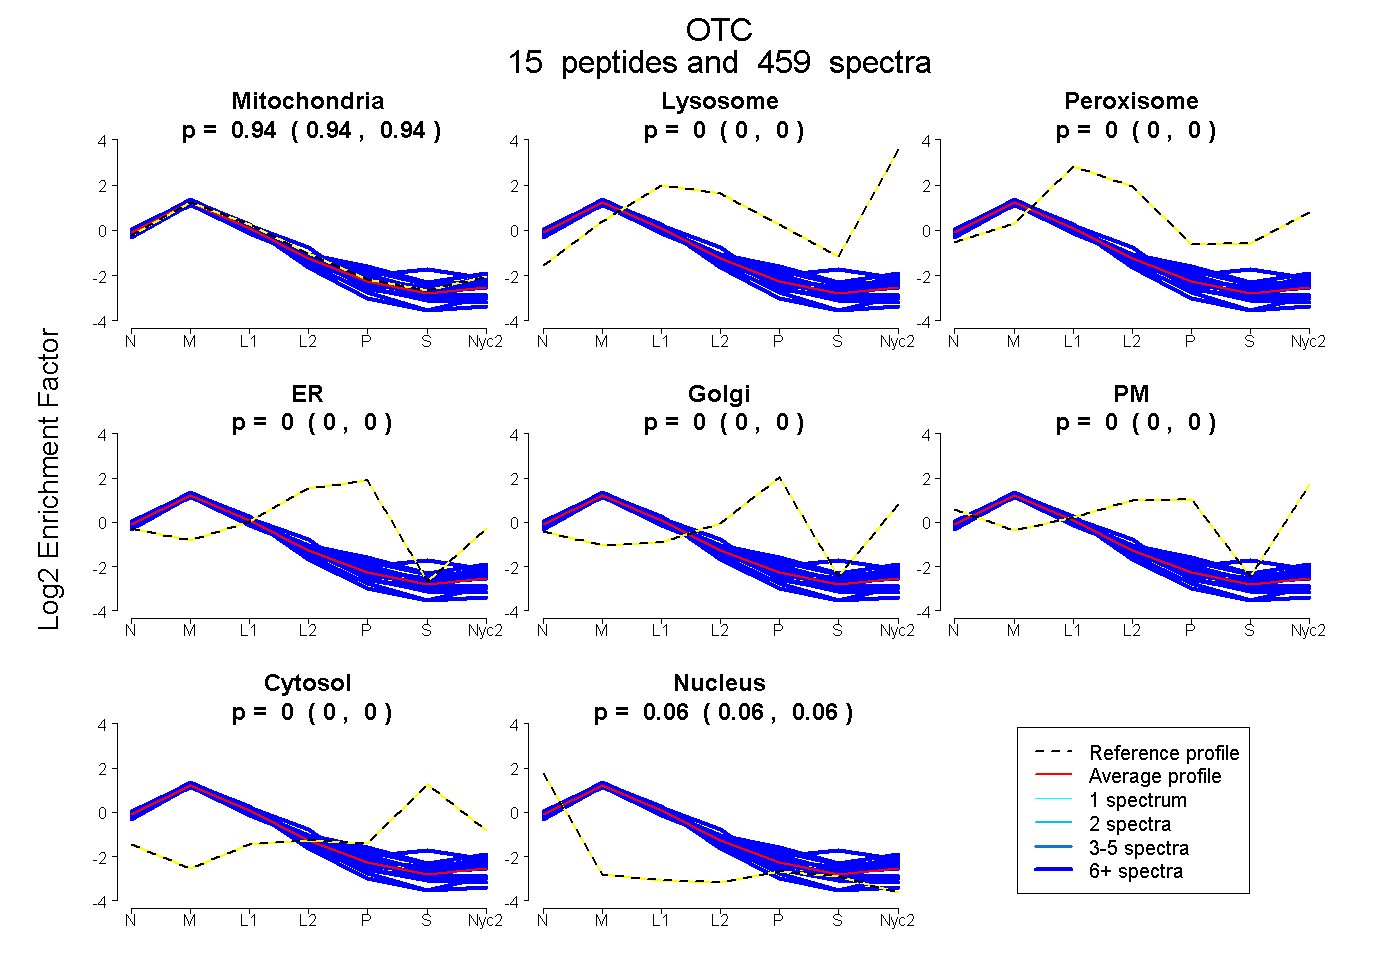
0.940 | 0.942
0.000 | 0.000
0.000 | 0.000
0.000 | 0.000
0.000 | 0.000
0.000 | 0.000
0.000 | 0.000
0.058 | 0.060
13peptides
spectra
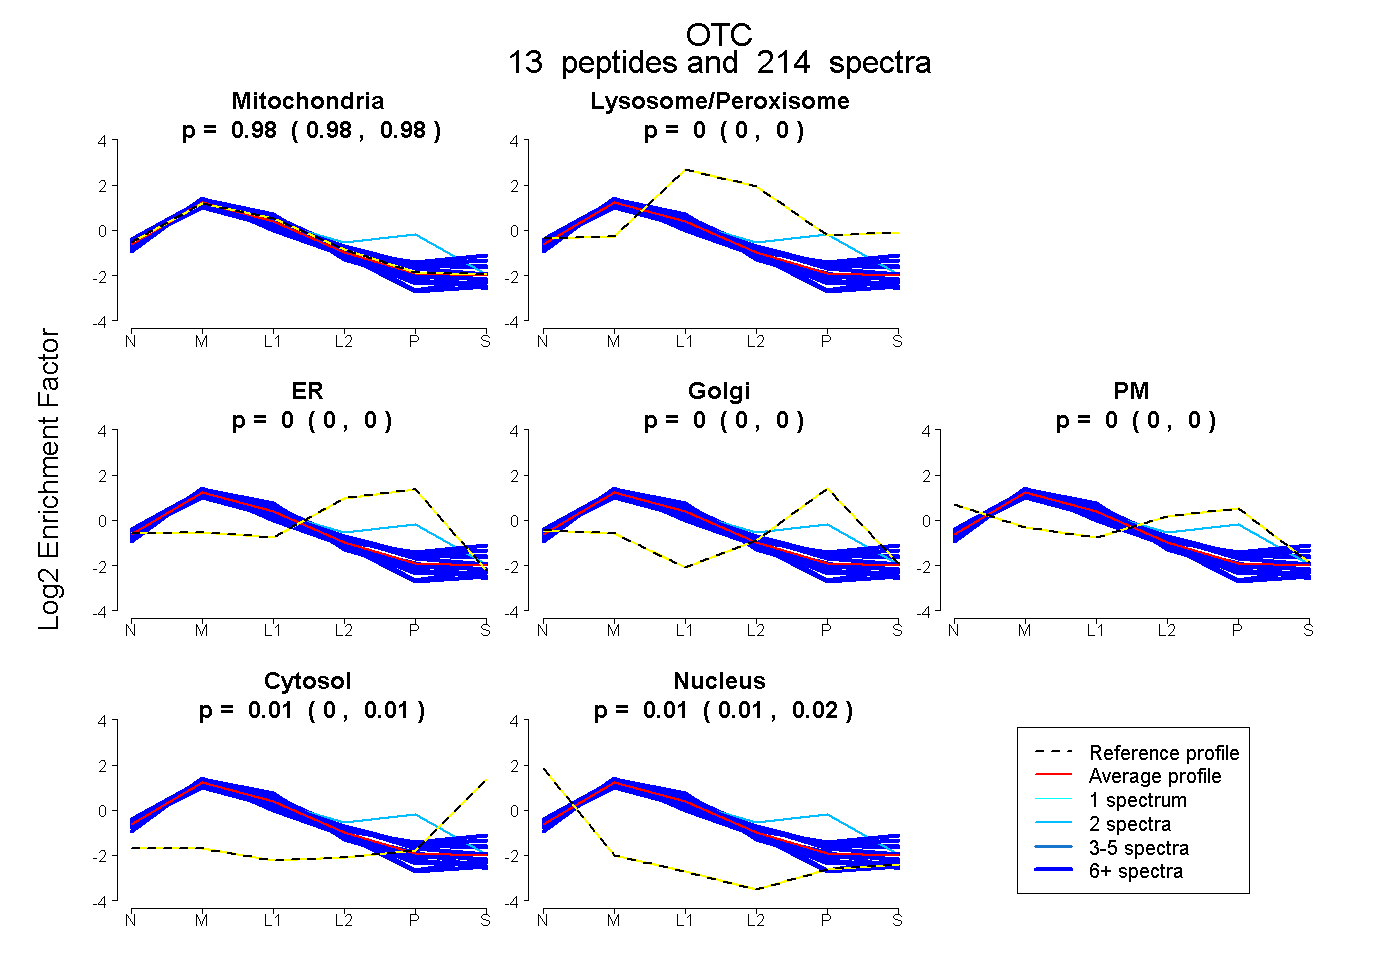
0.980 | 0.983
0.000 | 0.000
0.000 | 0.000
0.000 | 0.000
0.000 | 0.000
0.002 | 0.008
0.011 | 0.015
16peptides
spectra
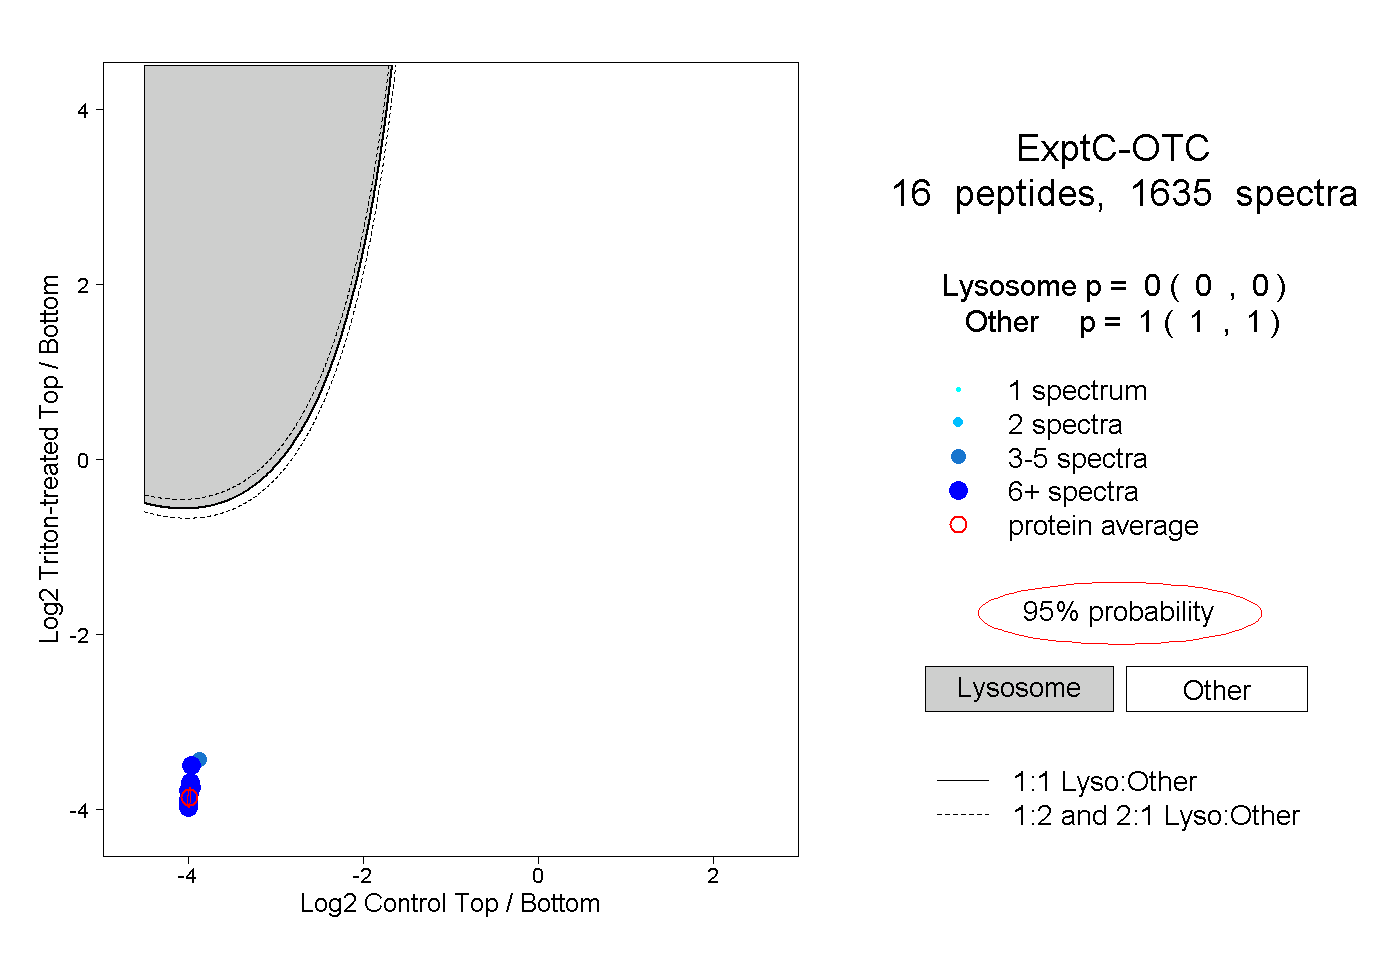
0.000 | 0.000
1.000 | 1.000
13peptides
spectra
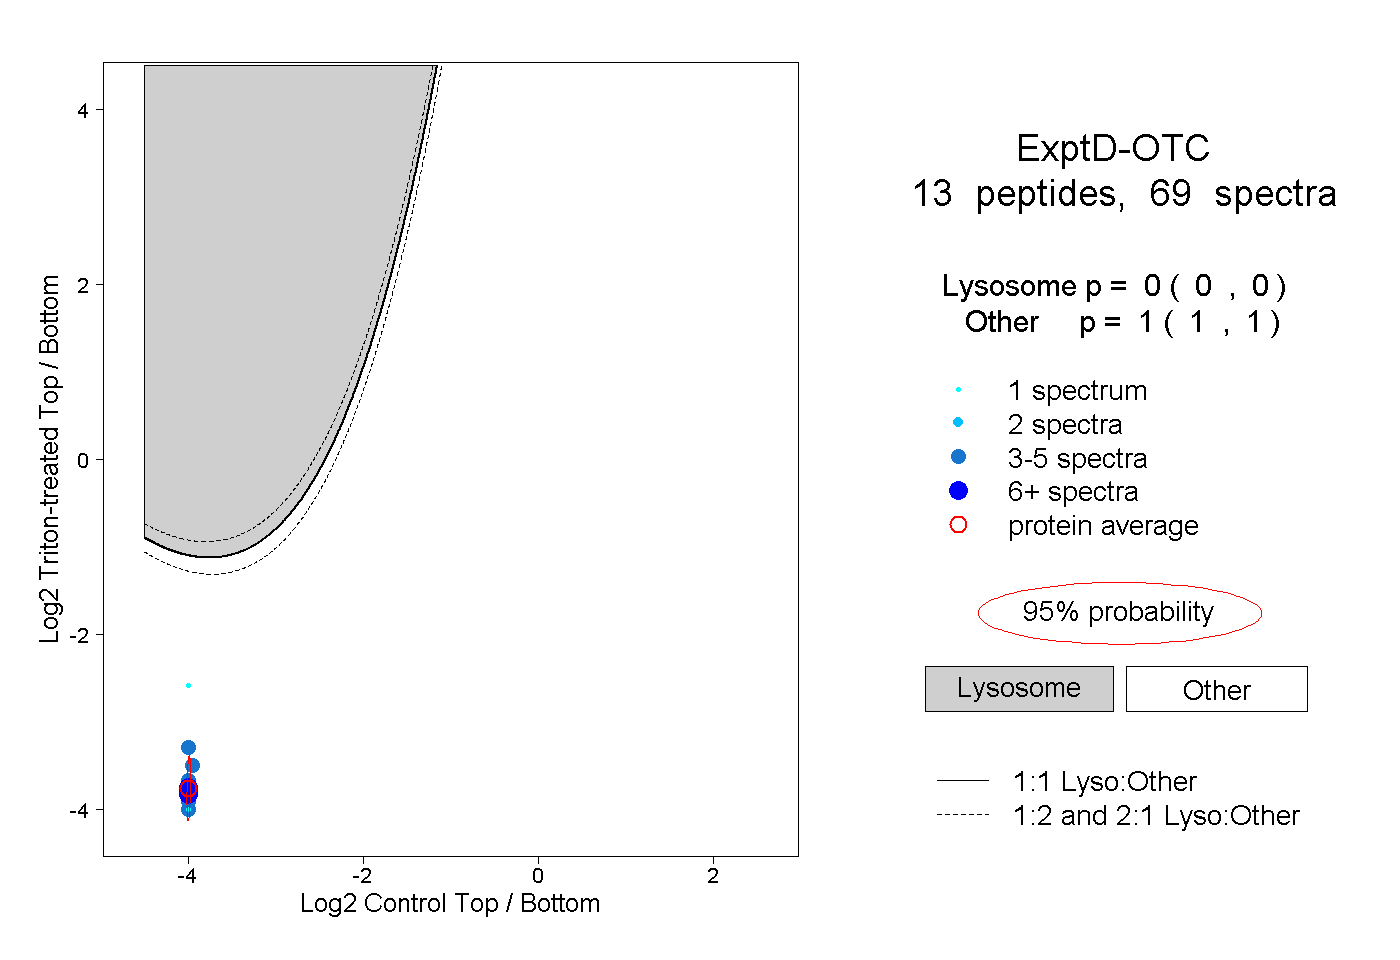
0.000 | 0.000
1.000 | 1.000