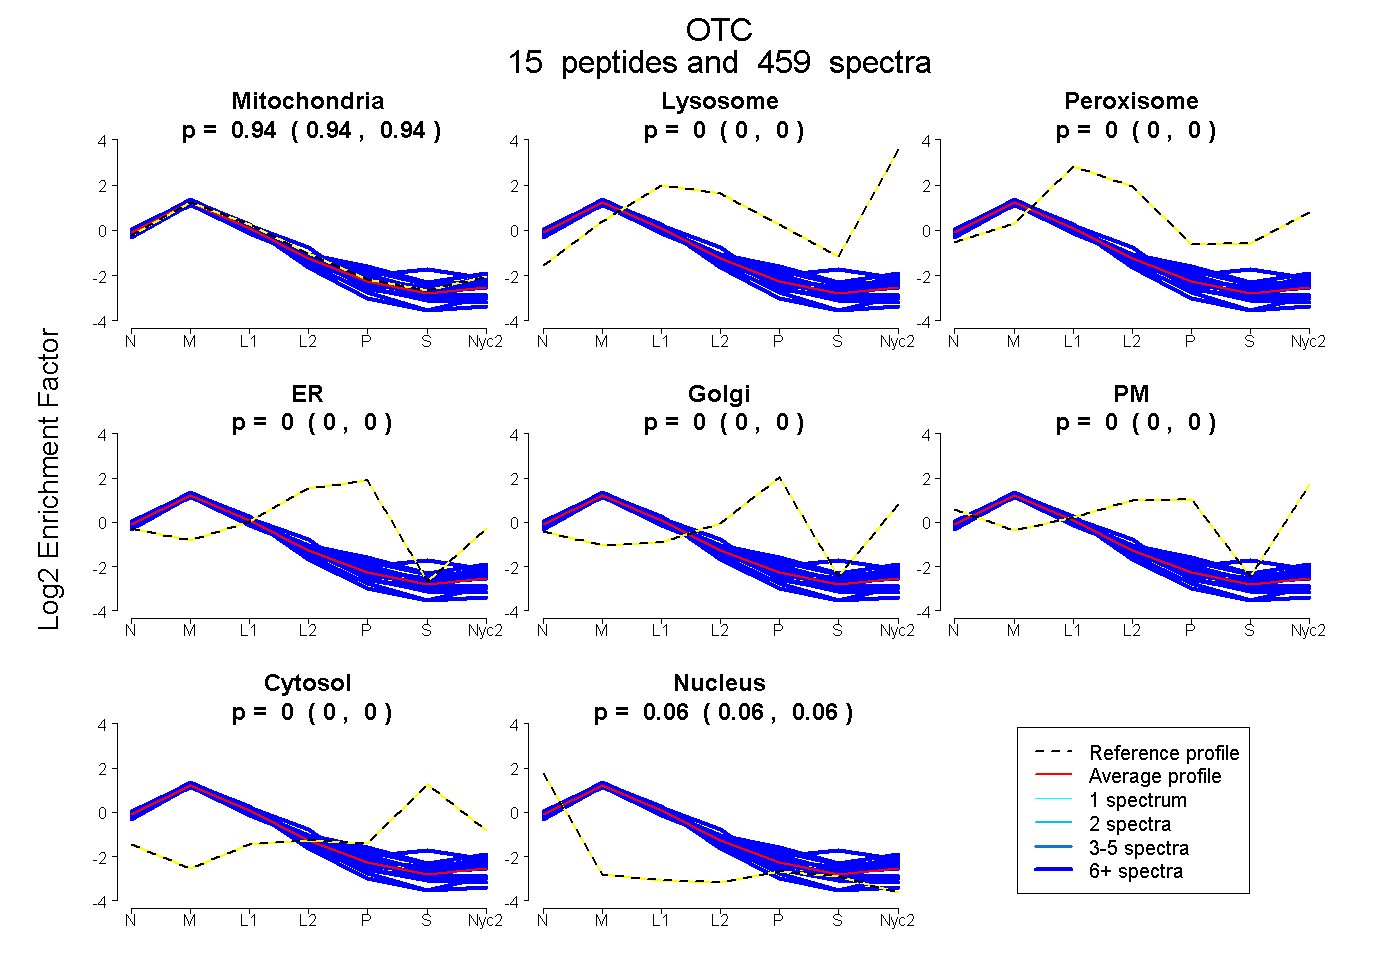
| 45 spectra, VLSSMTDAVLAR |
0.941 |
|
0.000 |
|
0.000 |
0.000 |
0.000 |
0.000 |
0.059 |
|
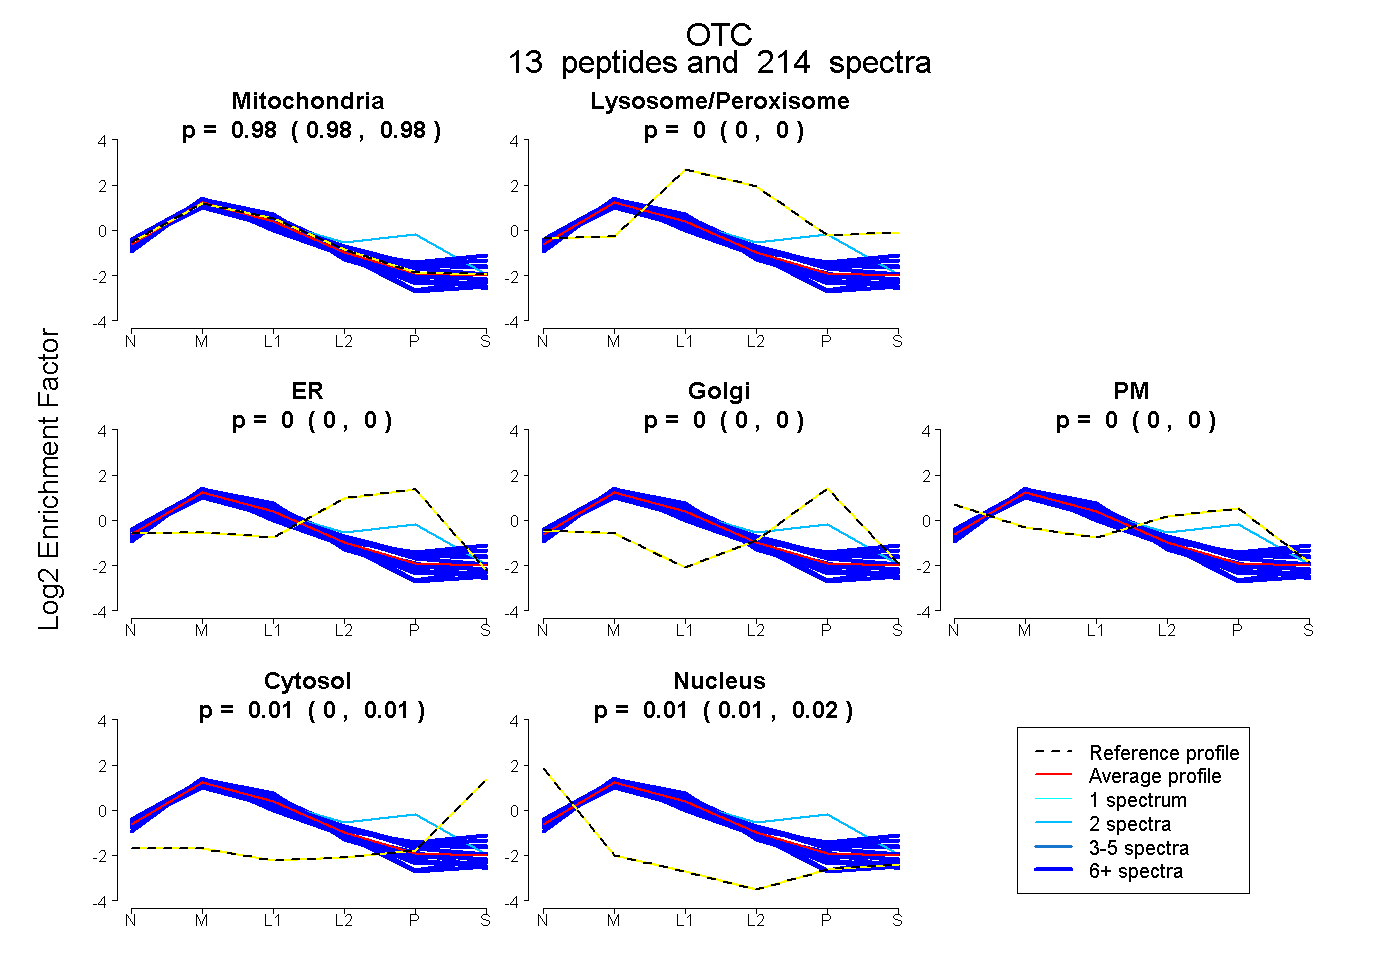
| 41 spectra, VAASDWTFLHCLPR |
0.988 |
|
0.000 |
|
0.000 |
0.000 |
0.000 |
0.000 |
0.012 |
|
| 13 spectra, SLVFPEAENR |
0.760 |
|
0.062 |
|
0.000 |
0.050 |
0.000 |
0.128 |
0.000 |
|
| 10 spectra, GEYLPLLQGK |
0.879 |
|
0.072 |
|
0.000 |
0.032 |
0.000 |
0.017 |
0.000 |
|
| 10 spectra, SLGMIFEK |
0.959 |
|
0.000 |
|
0.000 |
0.000 |
0.000 |
0.008 |
0.034 |
|
| 17 spectra, LSMTNDPLEAAR |
0.929 |
|
0.000 |
|
0.000 |
0.071 |
0.000 |
0.000 |
0.000 |
|
| 19 spectra, KPEEVDDEVFYSPR |
0.985 |
|
0.000 |
|
0.000 |
0.000 |
0.000 |
0.000 |
0.015 |
|
| 2 spectra, GGNVLITDTWISMGQEDEK |
0.625 |
|
0.038 |
|
0.233 |
0.103 |
0.000 |
0.000 |
0.000 |
|
| 12 spectra, LAEQYAK |
0.997 |
|
0.000 |
|
0.000 |
0.000 |
0.000 |
0.000 |
0.003 |
|
| 9 spectra, QSDLDILAK |
0.952 |
|
0.000 |
|
0.000 |
0.000 |
0.000 |
0.000 |
0.048 |
|
| 12 spectra, FGMHLQAATPK |
0.886 |
|
0.017 |
|
0.000 |
0.055 |
0.000 |
0.042 |
0.000 |
|
| 7 spectra, GYEPDPNIVK |
0.982 |
|
0.000 |
|
0.000 |
0.000 |
0.000 |
0.000 |
0.018 |
|
| 17 spectra, LQAFQGYQVTMK |
0.812 |
|
0.081 |
|
0.000 |
0.035 |
0.000 |
0.072 |
0.000 |
|
 15
15