 15
15peptides
spectra
0.940 | 0.942
0.000 | 0.000
0.000 | 0.000
0.000 | 0.000
0.000 | 0.000
0.000 | 0.000
0.000 | 0.000
0.058 | 0.060
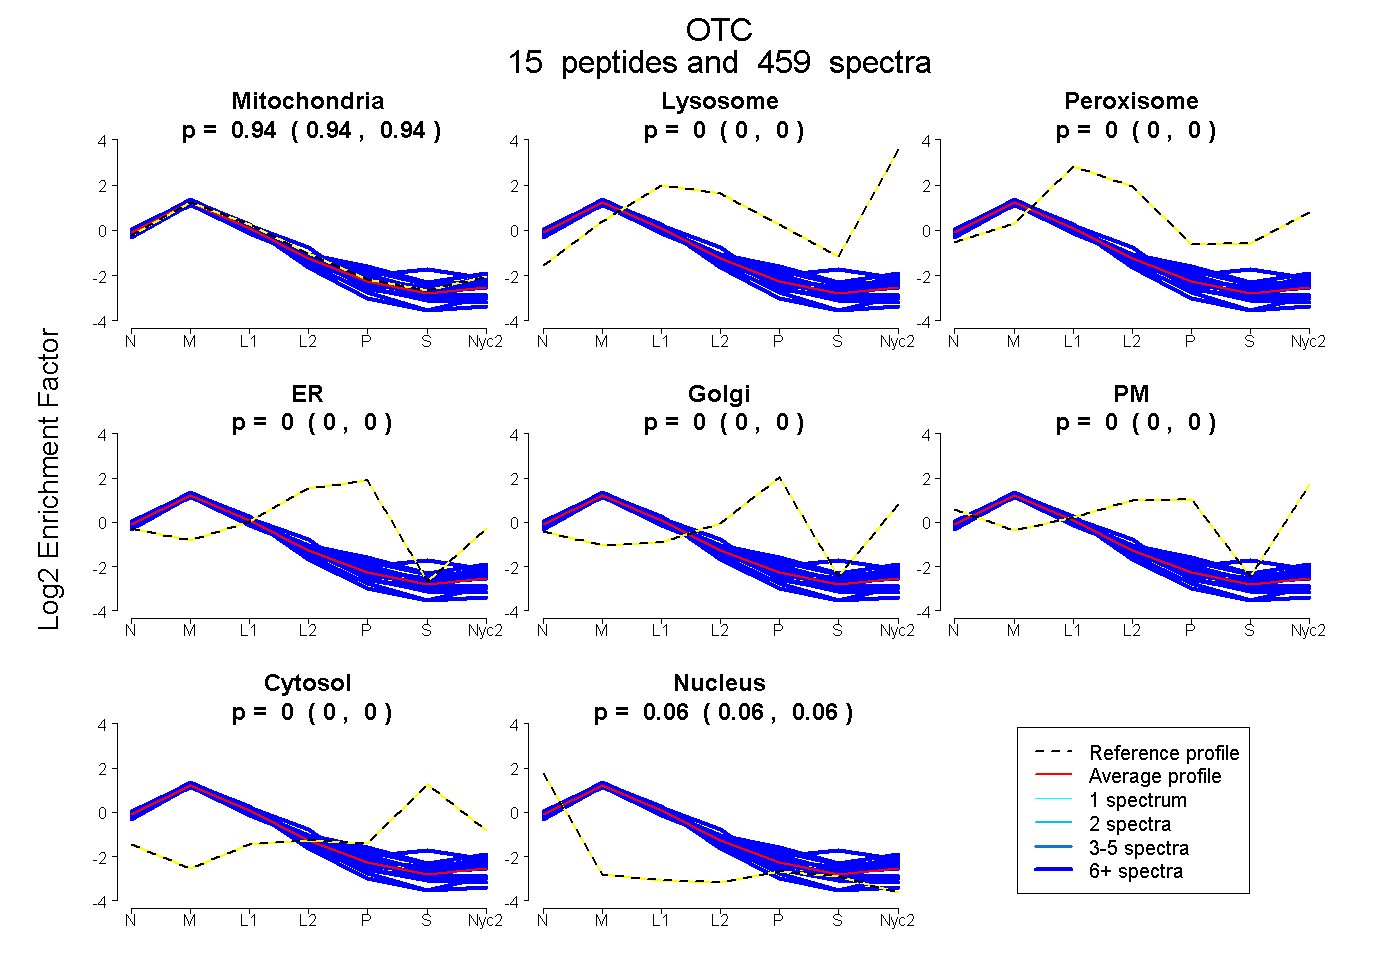
| Plot | Mito | Lyso | Perox | ER | Golgi | PM | Cytosol | Nucleus | |||||
| Expt A |
15 peptides |
459 spectra |
|
0.941 0.940 | 0.942 |
0.000 0.000 | 0.000 |
0.000 0.000 | 0.000 |
0.000 0.000 | 0.000 |
0.000 0.000 | 0.000 |
0.000 0.000 | 0.000 |
0.000 0.000 | 0.000 |
0.059 0.058 | 0.060 |
| 44 spectra, VLSSMTDAVLAR | 0.928 | 0.000 | 0.000 | 0.000 | 0.041 | 0.000 | 0.000 | 0.031 | ||
| 37 spectra, VAASDWTFLHCLPR | 0.913 | 0.000 | 0.000 | 0.000 | 0.000 | 0.000 | 0.000 | 0.087 | ||
| 33 spectra, SLVFPEAENR | 0.929 | 0.000 | 0.000 | 0.000 | 0.000 | 0.000 | 0.000 | 0.071 | ||
| 8 spectra, GEYLPLLQGK | 0.938 | 0.000 | 0.000 | 0.000 | 0.000 | 0.000 | 0.000 | 0.062 | ||
| 26 spectra, SLGMIFEK | 0.930 | 0.000 | 0.000 | 0.000 | 0.000 | 0.000 | 0.000 | 0.070 | ||
| 51 spectra, LSMTNDPLEAAR | 0.968 | 0.000 | 0.000 | 0.000 | 0.000 | 0.000 | 0.000 | 0.032 | ||
| 66 spectra, KPEEVDDEVFYSPR | 0.902 | 0.000 | 0.000 | 0.000 | 0.000 | 0.000 | 0.000 | 0.098 | ||
| 7 spectra, GGNVLITDTWISMGQEDEK | 0.976 | 0.000 | 0.000 | 0.000 | 0.000 | 0.000 | 0.000 | 0.024 | ||
| 16 spectra, LAEQYAK | 0.945 | 0.000 | 0.000 | 0.000 | 0.000 | 0.000 | 0.000 | 0.055 | ||
| 23 spectra, QSDLDILAK | 0.919 | 0.000 | 0.000 | 0.000 | 0.000 | 0.000 | 0.000 | 0.081 | ||
| 70 spectra, FGMHLQAATPK | 0.921 | 0.000 | 0.000 | 0.032 | 0.000 | 0.000 | 0.024 | 0.023 | ||
| 7 spectra, NFTGEEIQYMLWLSADLK | 0.866 | 0.000 | 0.000 | 0.000 | 0.000 | 0.000 | 0.134 | 0.000 | ||
| 14 spectra, GYEPDPNIVK | 0.923 | 0.000 | 0.000 | 0.000 | 0.000 | 0.000 | 0.000 | 0.077 | ||
| 47 spectra, LQAFQGYQVTMK | 0.881 | 0.000 | 0.000 | 0.000 | 0.085 | 0.000 | 0.030 | 0.003 | ||
| 10 spectra, DLLTLK | 0.906 | 0.000 | 0.000 | 0.000 | 0.000 | 0.000 | 0.000 | 0.094 |
| Plot | Mito | Lyso or Perox | ER | Golgi | PM | Cytosol | Nucleus | ||||||
| Expt B |
13 peptides |
214 spectra |
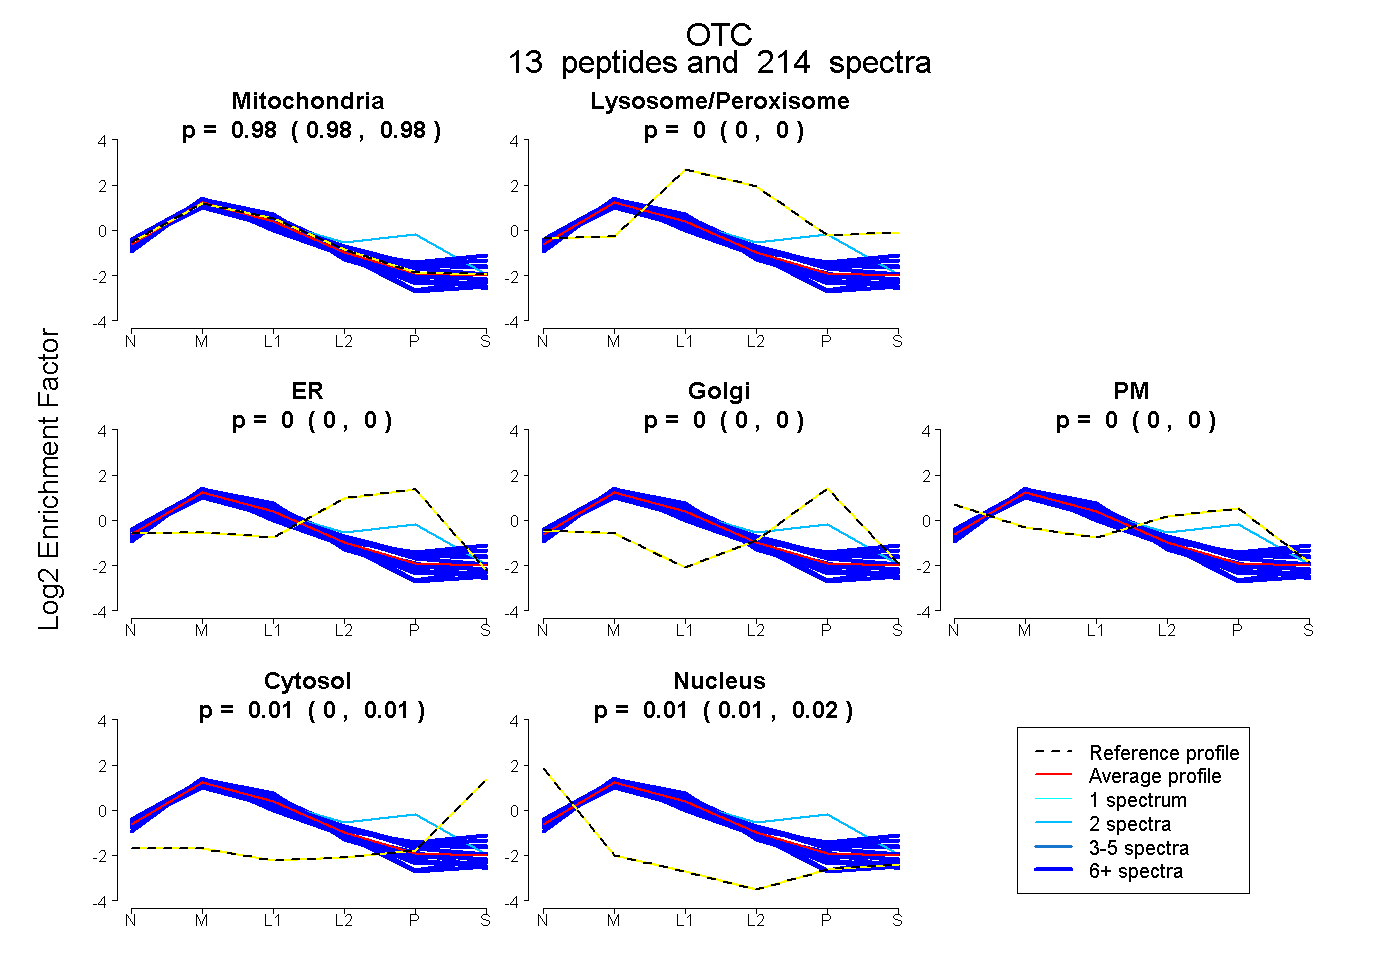 |
0.981 0.980 | 0.983 |
0.000 0.000 | 0.000 |
0.000 0.000 | 0.000 |
0.000 0.000 | 0.000 |
0.000 0.000 | 0.000 |
0.005 0.002 | 0.008 |
0.013 0.011 | 0.015 |
|||
| Plot | Lyso | Other | |||||||||||
| Expt C |
16 peptides |
1635 spectra |
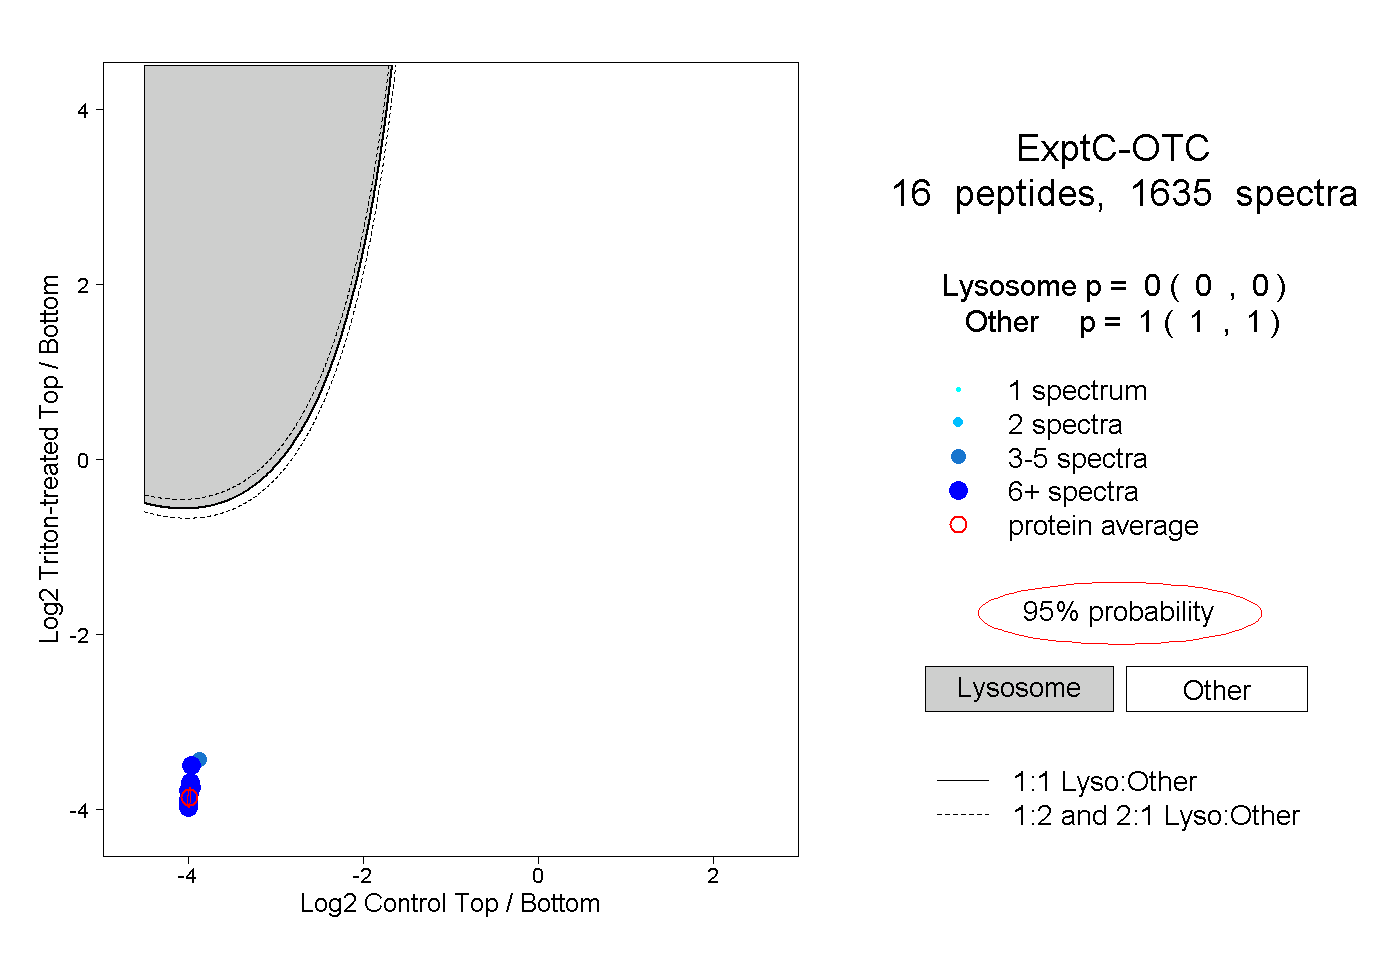 |
0.000 0.000 | 0.000 |
1.000 1.000 | 1.000 |
||||||||
| Plot | Lyso | Other | |||||||||||
| Expt D |
13 peptides |
69 spectra |
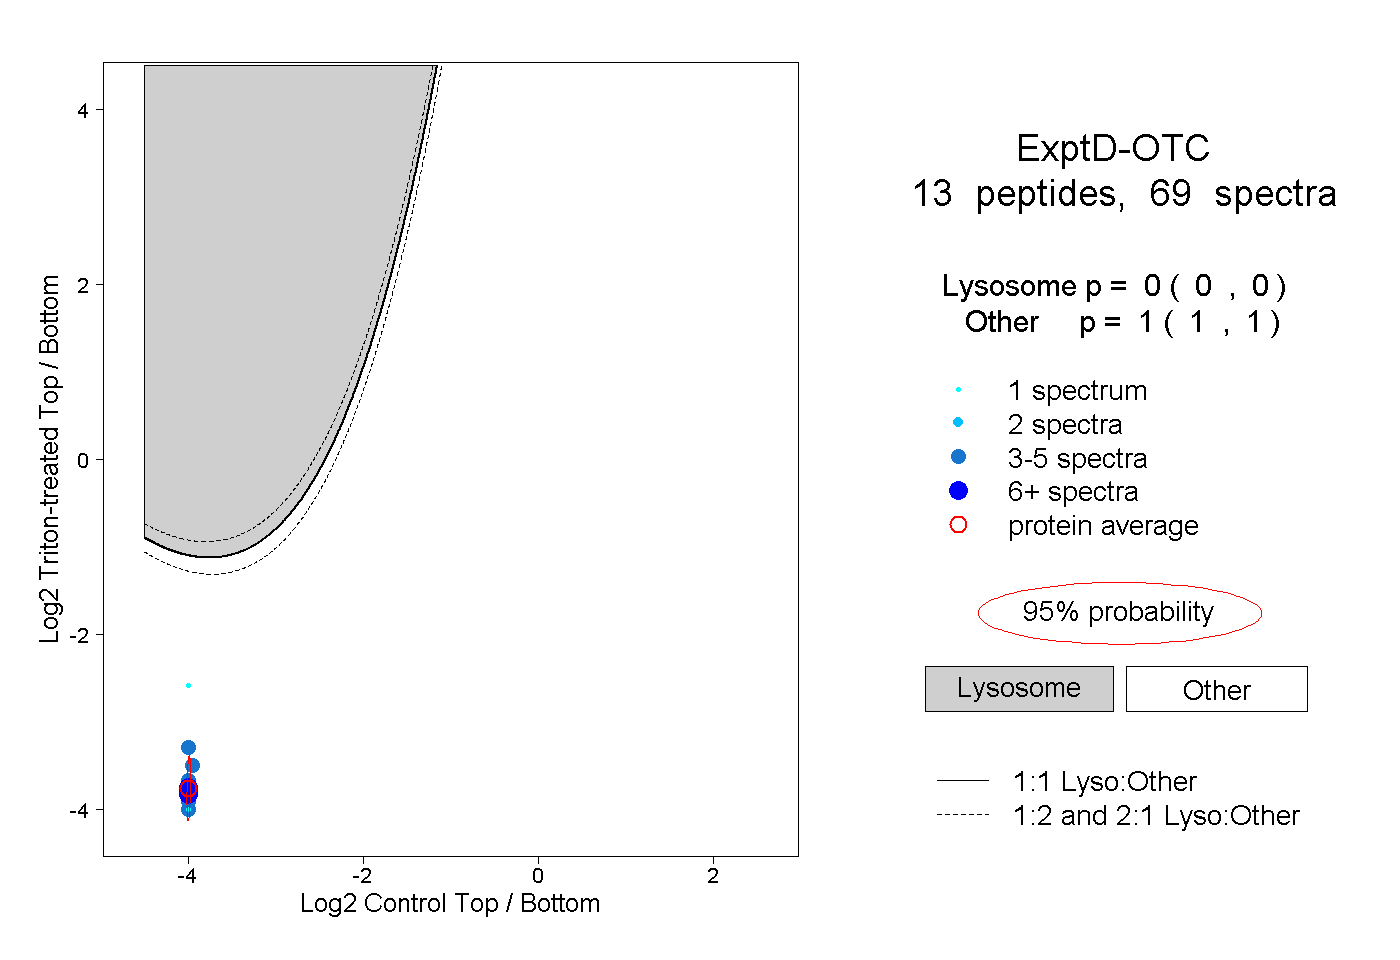 |
0.000 0.000 | 0.000 |
1.000 1.000 | 1.000 |