 11
11peptides
spectra
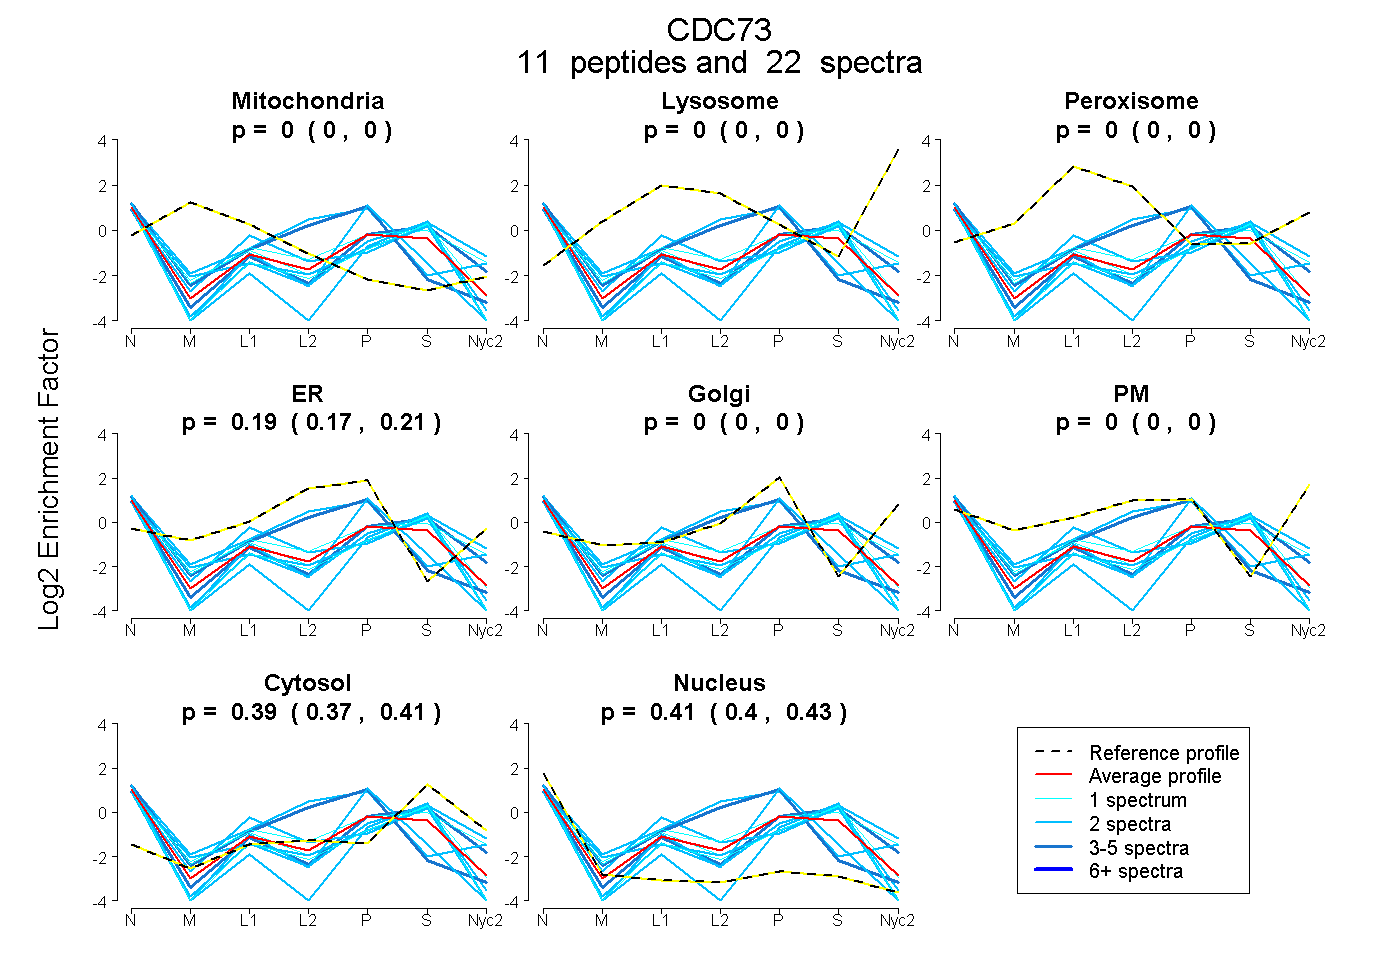
0.000 | 0.000
0.000 | 0.000
0.000 | 0.000
0.174 | 0.210
0.000 | 0.000
0.000 | 0.000
0.369 | 0.411
0.396 | 0.430
7peptides
spectra
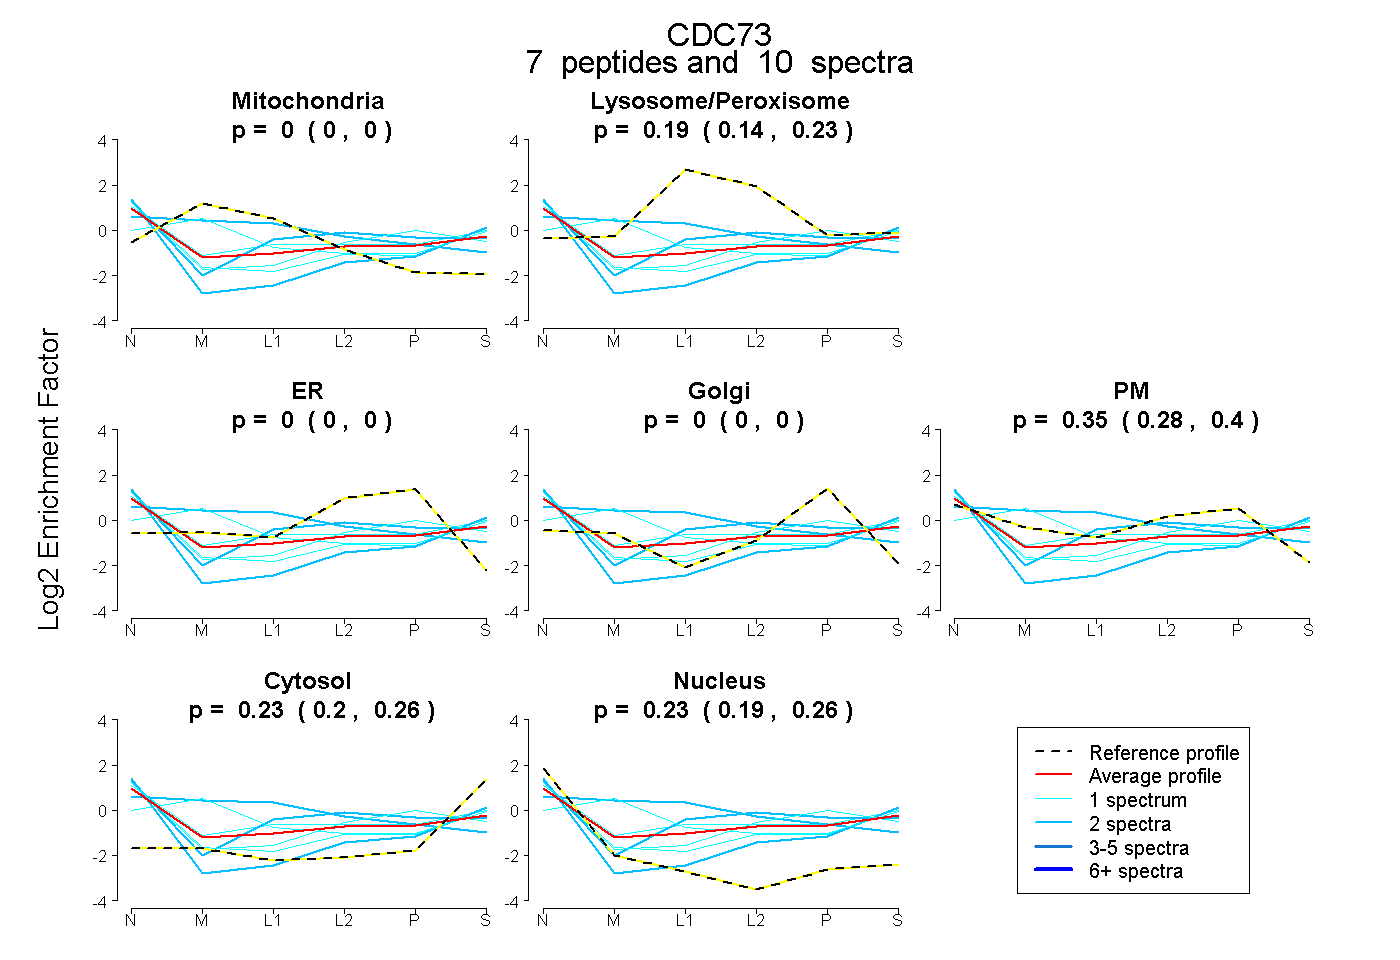
0.000 | 0.000
0.135 | 0.234
0.000 | 0.000
0.000 | 0.000
0.280 | 0.405
0.200 | 0.258
0.193 | 0.262
2peptides
spectra
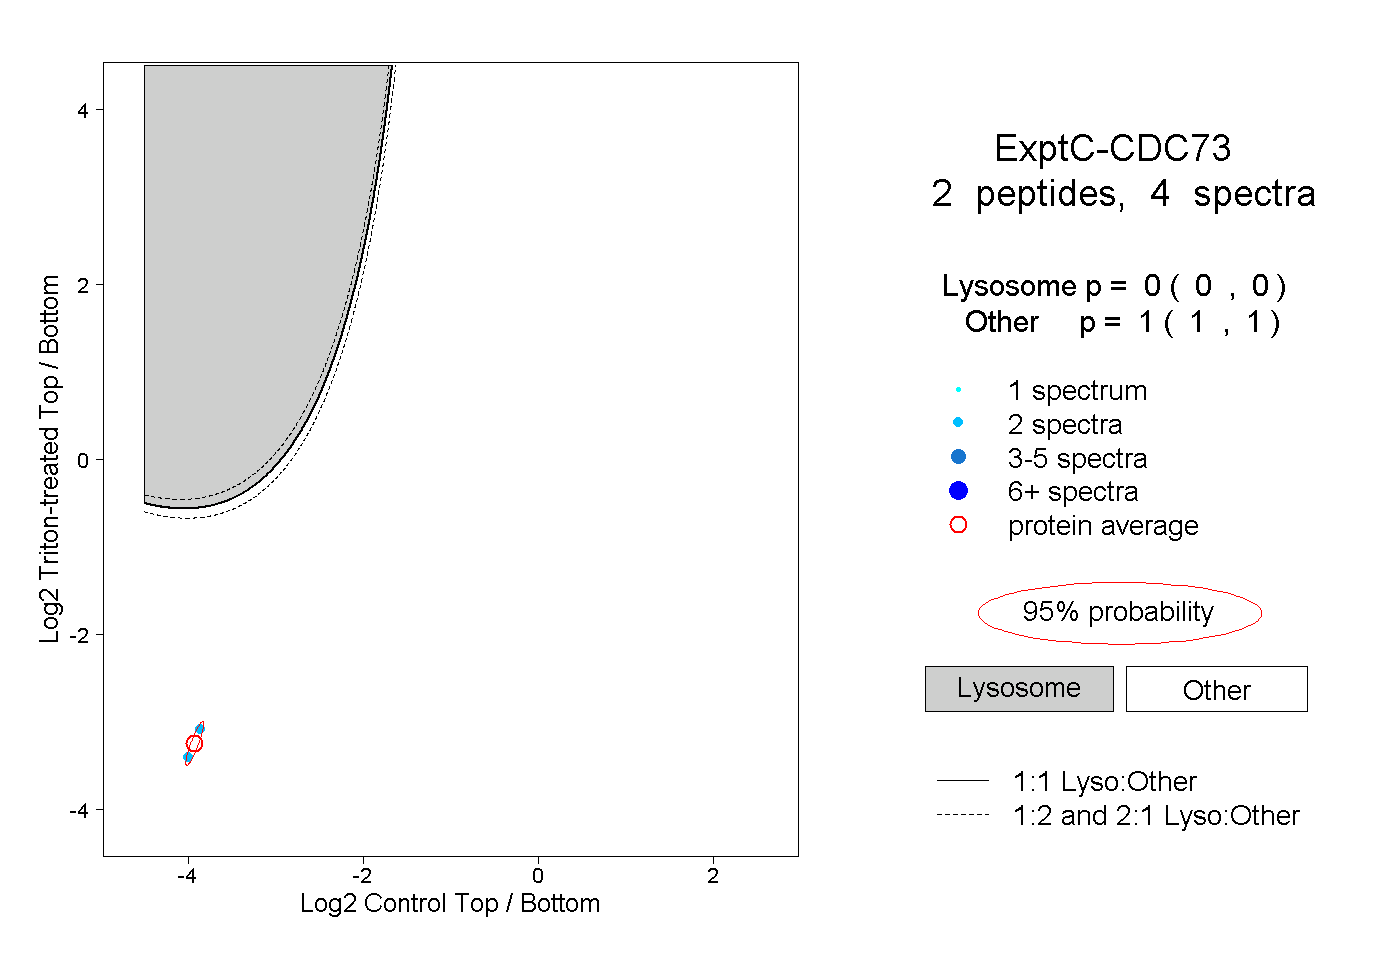
0.000 | 0.000
1.000 | 1.000
2peptides
spectra
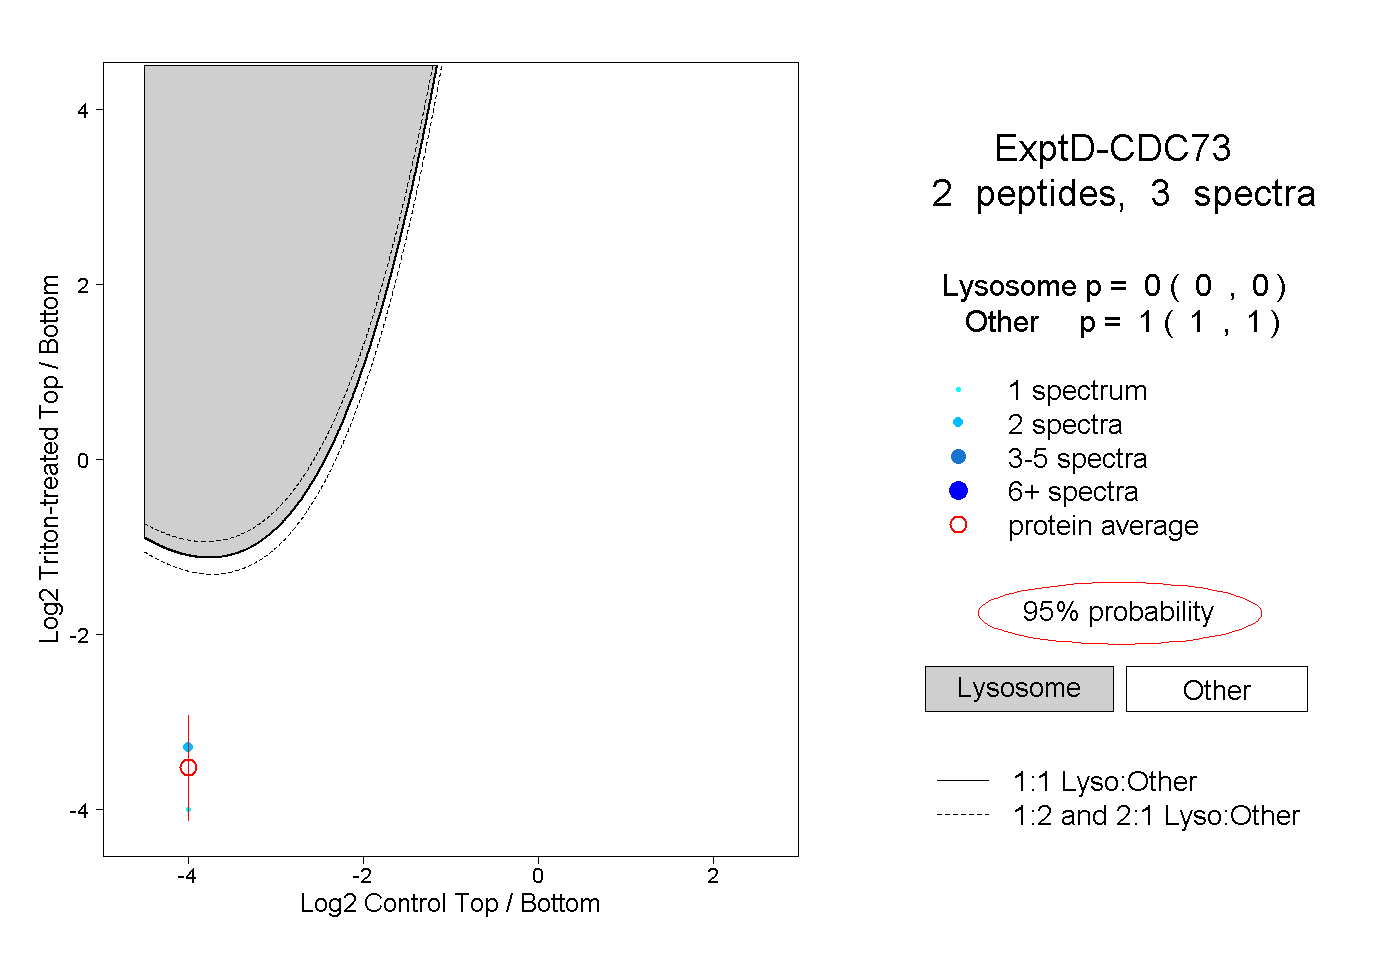
0.000 | 0.000
1.000 | 1.000