 11
11peptides
spectra
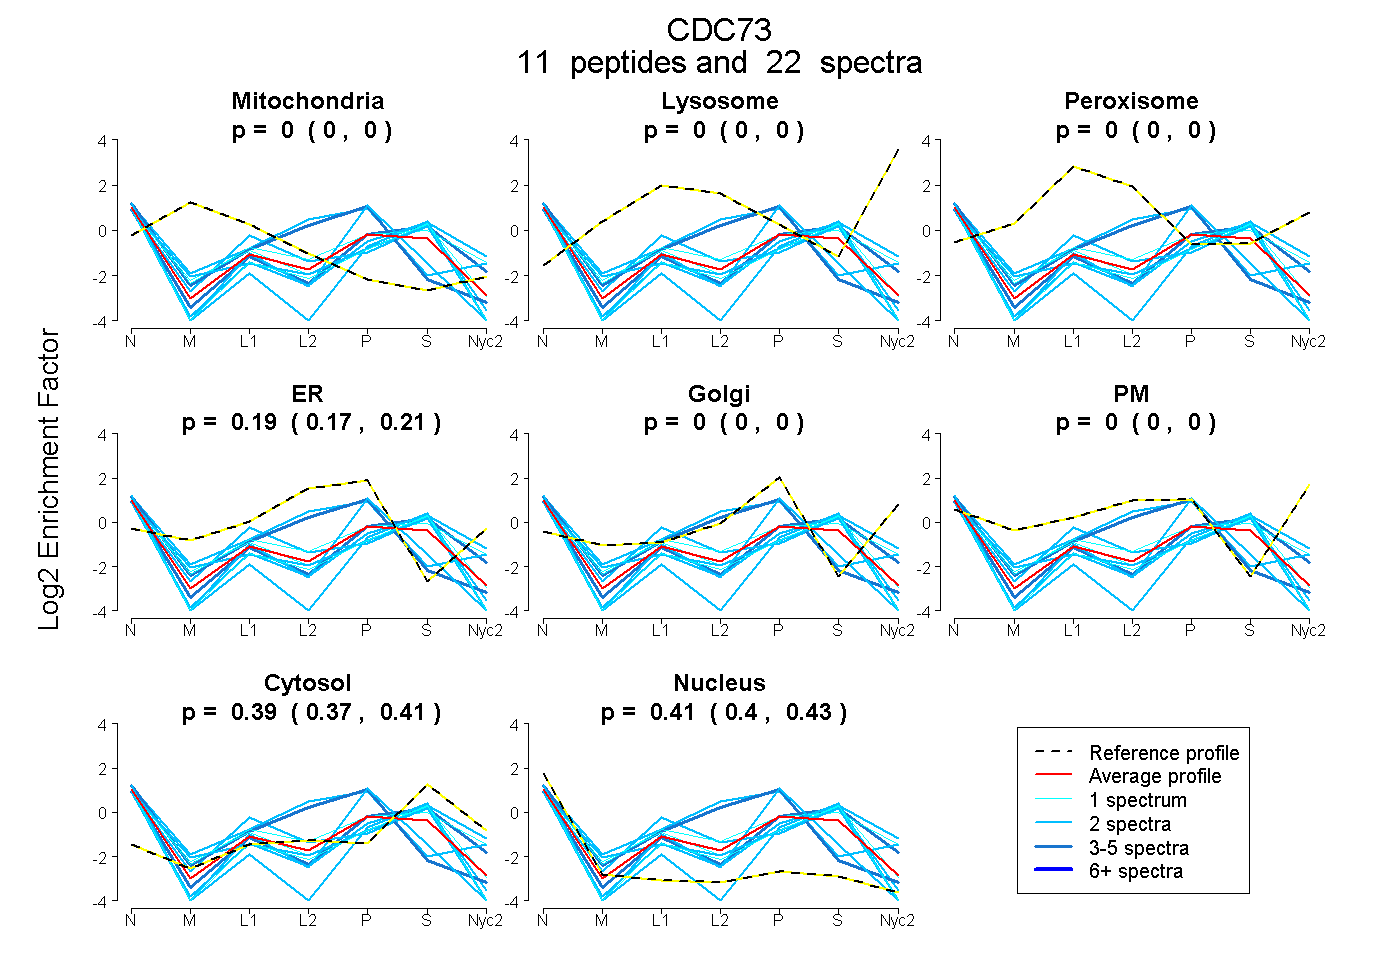
0.000 | 0.000
0.000 | 0.000
0.000 | 0.000
0.174 | 0.210
0.000 | 0.000
0.000 | 0.000
0.369 | 0.411
0.396 | 0.430
| Plot | Mito | Lyso | Perox | ER | Golgi | PM | Cytosol | Nucleus | |||||
| Expt A |
11 peptides |
22 spectra |
|
0.000 0.000 | 0.000 |
0.000 0.000 | 0.000 |
0.000 0.000 | 0.000 |
0.193 0.174 | 0.210 |
0.000 0.000 | 0.000 |
0.000 0.000 | 0.000 |
0.392 0.369 | 0.411 |
0.414 0.396 | 0.430 |
| 3 spectra, AADEVLAEAK | 0.000 | 0.000 | 0.000 | 0.000 | 0.137 | 0.000 | 0.537 | 0.326 | ||
| 4 spectra, HLDRPVFLR | 0.000 | 0.000 | 0.000 | 0.599 | 0.000 | 0.000 | 0.000 | 0.401 | ||
| 2 spectra, GDEVIFGEFSWPK | 0.000 | 0.000 | 0.189 | 0.000 | 0.000 | 0.000 | 0.374 | 0.437 | ||
| 2 spectra, SVTEGASAR | 0.000 | 0.000 | 0.000 | 0.272 | 0.000 | 0.000 | 0.130 | 0.598 | ||
| 1 spectrum, NIFAILQSVK | 0.000 | 0.000 | 0.050 | 0.129 | 0.000 | 0.108 | 0.451 | 0.263 | ||
| 2 spectra, AATENIPVVR | 0.000 | 0.000 | 0.000 | 0.000 | 0.097 | 0.000 | 0.603 | 0.300 | ||
| 2 spectra, FWETLDR | 0.000 | 0.000 | 0.000 | 0.694 | 0.000 | 0.000 | 0.027 | 0.278 | ||
| 2 spectra, SFVDAEVDVTR | 0.030 | 0.000 | 0.004 | 0.058 | 0.000 | 0.000 | 0.438 | 0.471 | ||
| 1 spectrum, QYNIQK | 0.000 | 0.000 | 0.130 | 0.000 | 0.000 | 0.000 | 0.446 | 0.423 | ||
| 1 spectrum, TDLDDDITALK | 0.000 | 0.000 | 0.000 | 0.000 | 0.000 | 0.000 | 0.491 | 0.509 | ||
| 2 spectra, IEDEECVR | 0.000 | 0.000 | 0.000 | 0.000 | 0.000 | 0.000 | 0.410 | 0.590 |
| Plot | Mito | Lyso or Perox | ER | Golgi | PM | Cytosol | Nucleus | ||||||
| Expt B |
7 peptides |
10 spectra |
 |
0.000 0.000 | 0.000 |
0.190 0.135 | 0.234 |
0.000 0.000 | 0.000 |
0.000 0.000 | 0.000 |
0.346 0.280 | 0.405 |
0.231 0.200 | 0.258 |
0.233 0.193 | 0.262 |
|||
| Plot | Lyso | Other | |||||||||||
| Expt C |
2 peptides |
4 spectra |
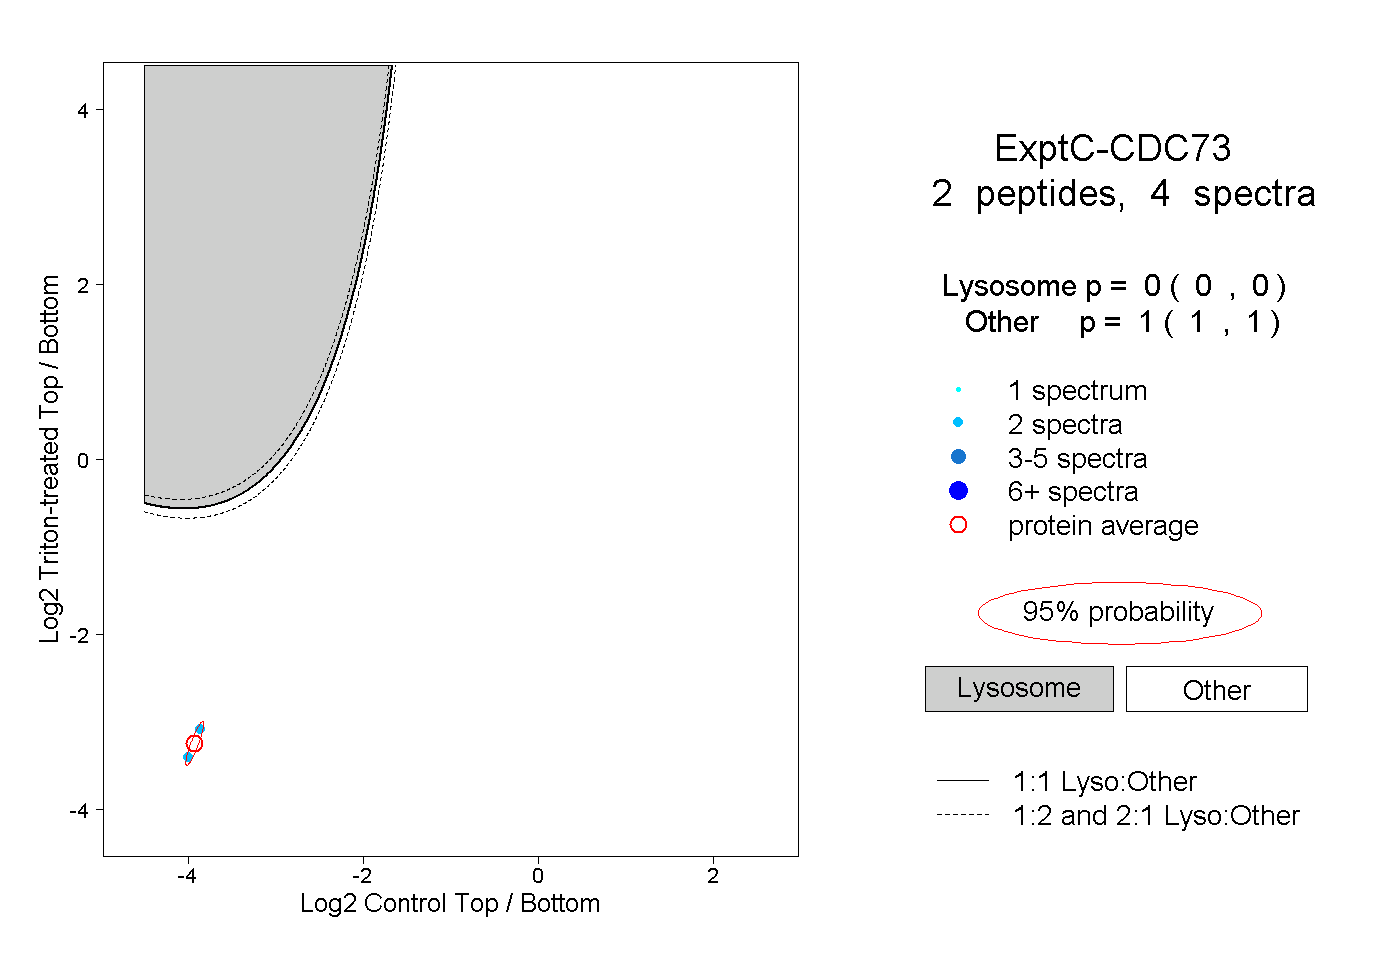 |
0.000 0.000 | 0.000 |
1.000 1.000 | 1.000 |
||||||||
| Plot | Lyso | Other | |||||||||||
| Expt D |
2 peptides |
3 spectra |
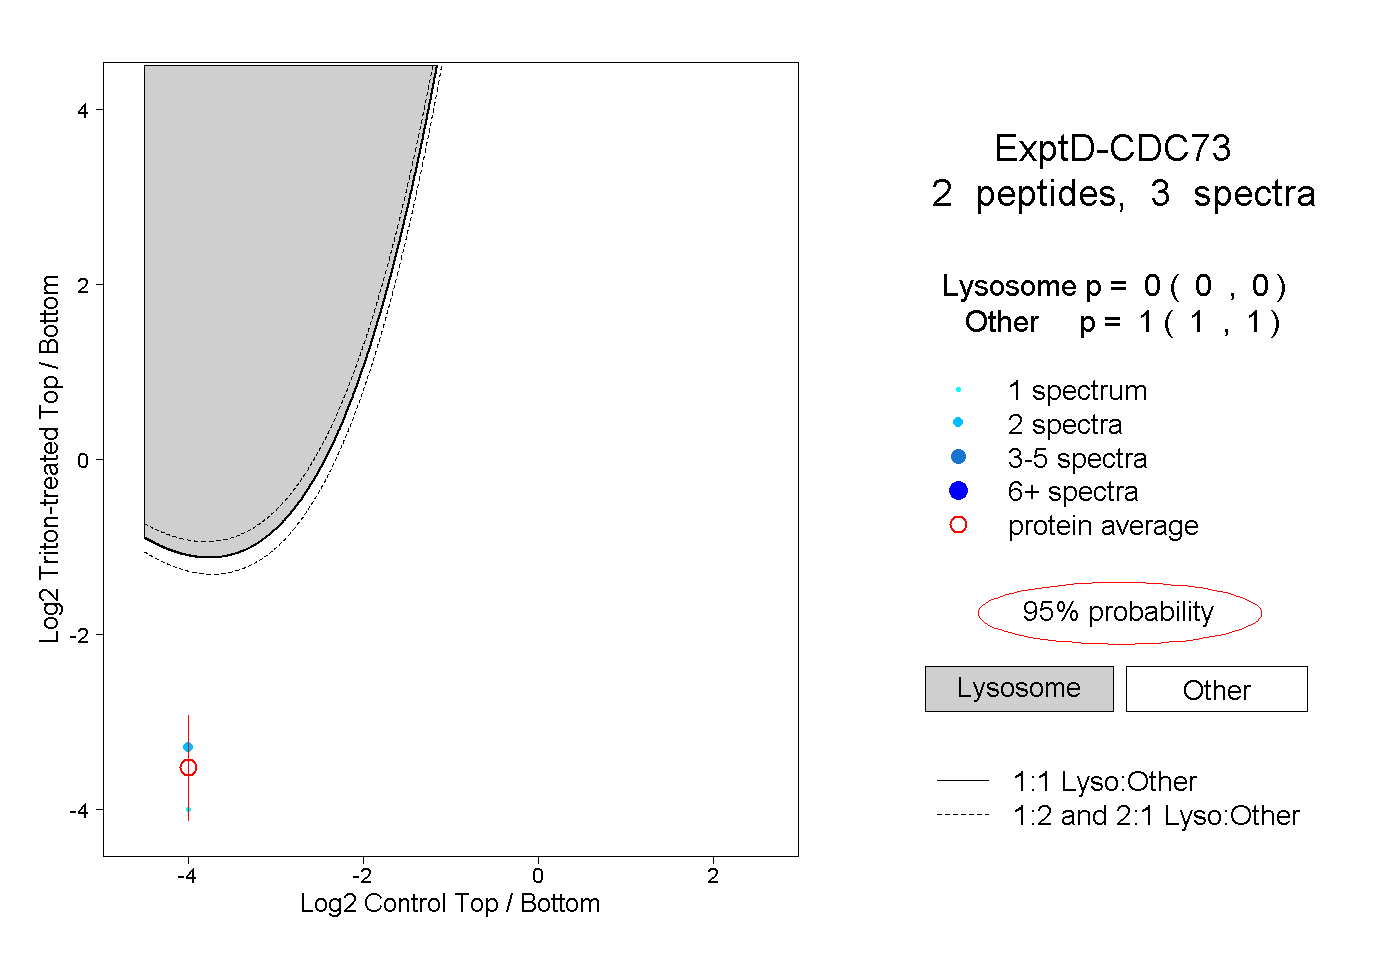 |
0.000 0.000 | 0.000 |
1.000 1.000 | 1.000 |