CDC73
[ENSRNOP00000004495]
Main page
| | | Plot |
Mito |
Lyso |
|
Perox |
ER |
Golgi |
PM |
Cytosol |
Nucleus |
|
| Expt A |
 11
11
peptides |
22
spectra |
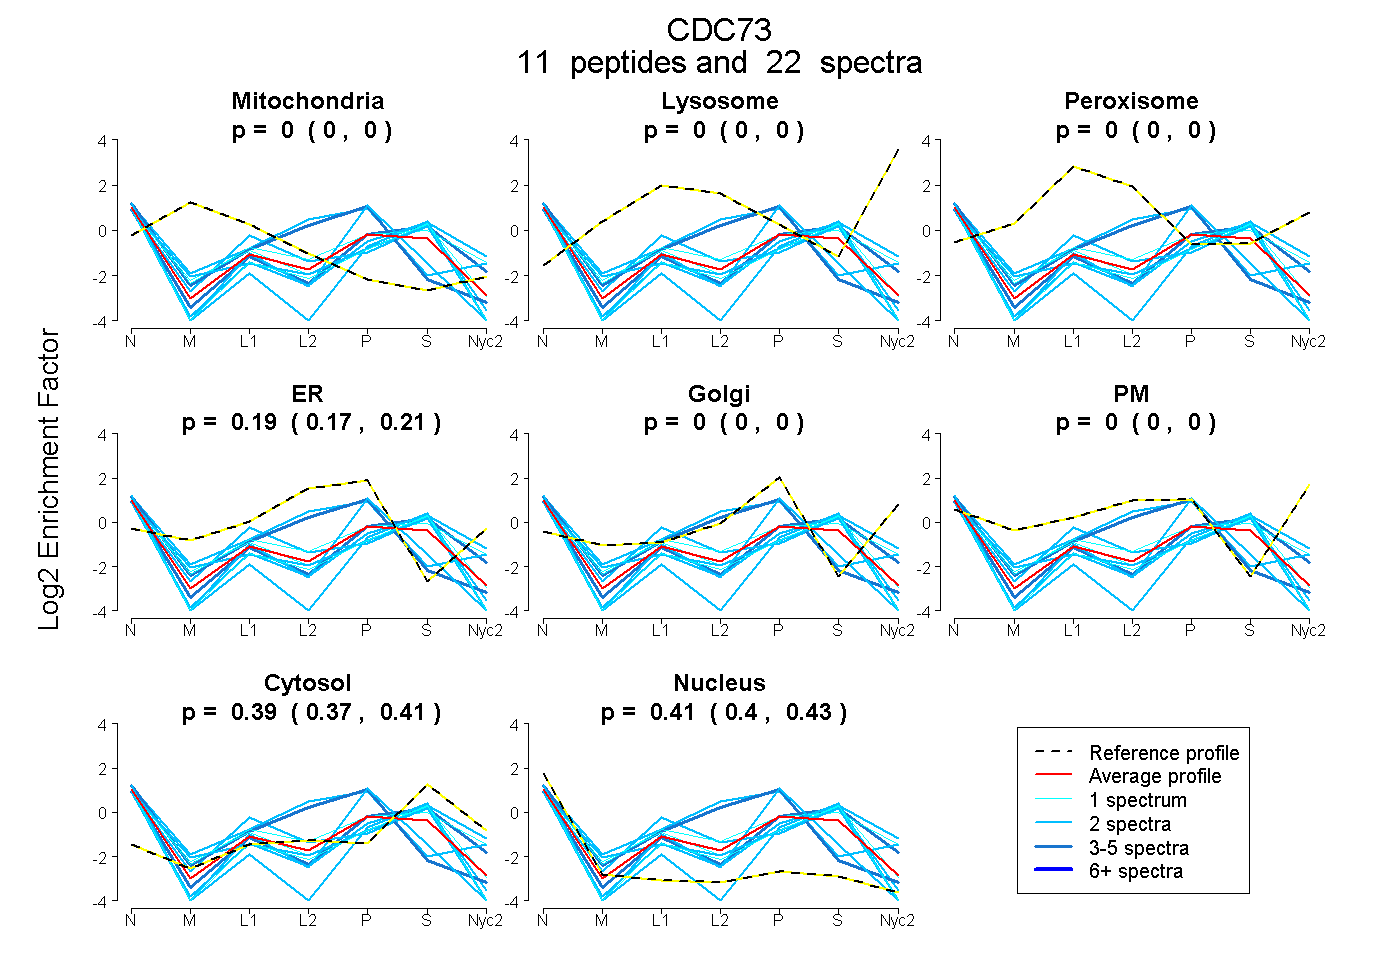 |
0.000
0.000 | 0.000 |
0.000
0.000 | 0.000 |
|
0.000
0.000 | 0.000 |
0.193
0.174 | 0.210 |
0.000
0.000 | 0.000 |
0.000
0.000 | 0.000 |
0.392
0.369 | 0.411 |
0.414
0.396 | 0.430 |
|
| | | Plot |
Mito |
|
Lyso or Perox |
|
ER |
Golgi |
PM |
Cytosol |
Nucleus |
|
| Expt B |
7
peptides |
10
spectra |
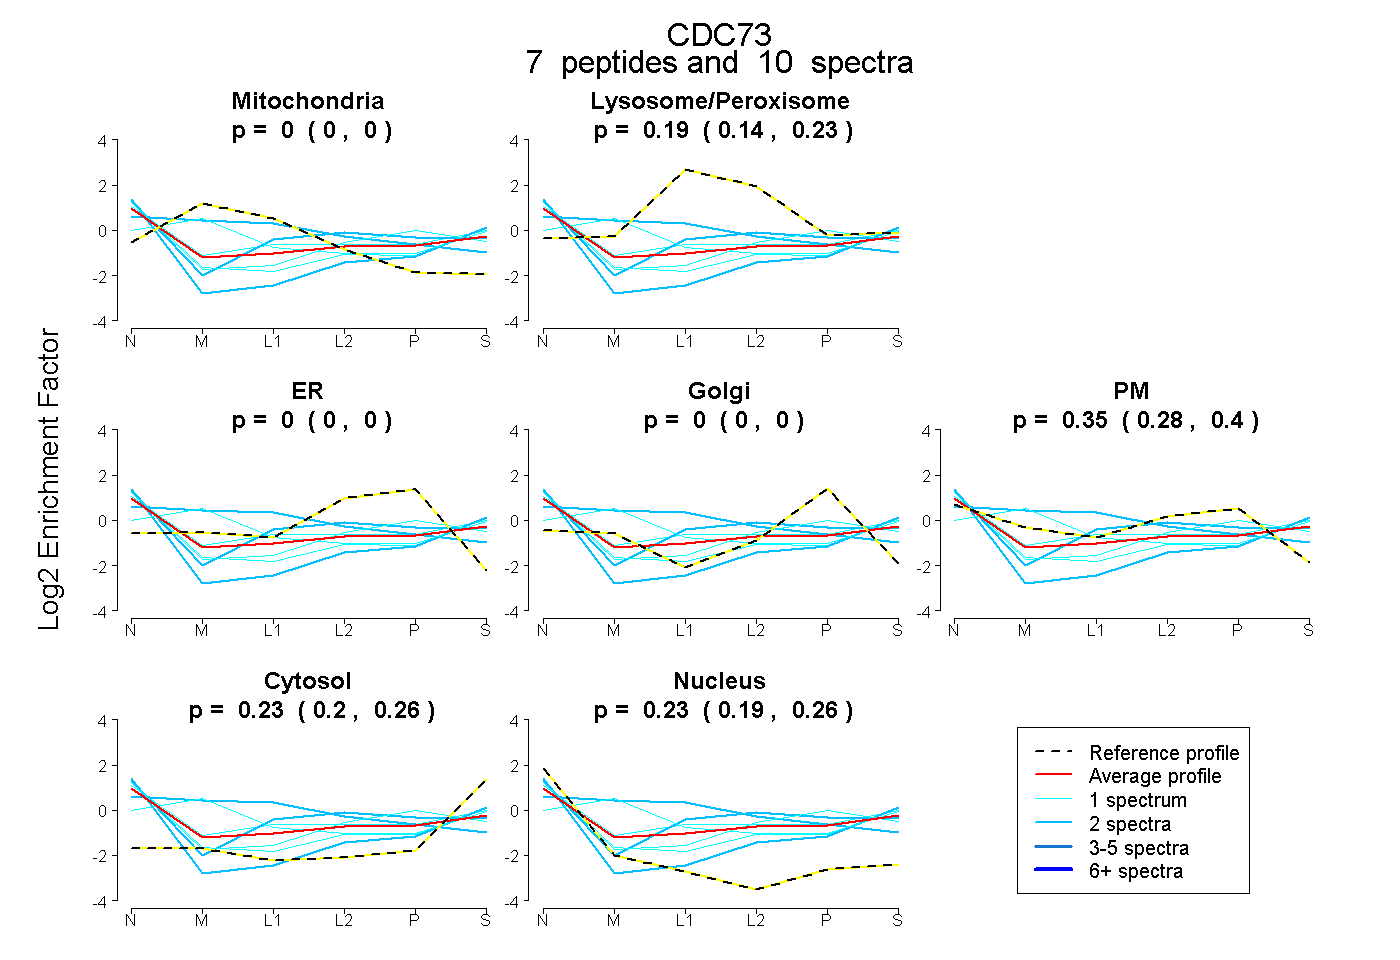 |
0.000
0.000 | 0.000 |
|
0.190
0.135 | 0.234 |
|
0.000
0.000 | 0.000 |
0.000
0.000 | 0.000 |
0.346
0.280 | 0.405 |
0.231
0.200 | 0.258 |
0.233
0.193 | 0.262 |
|
| 1 spectrum, AADEVLAEAK |
0.000 |
|
0.095 |
|
0.000 |
0.000 |
0.276 |
0.321 |
0.308 |
|
| 2 spectra, HLDRPVFLR |
0.000 |
|
0.342 |
|
0.000 |
0.000 |
0.285 |
0.101 |
0.272 |
|
| 1 spectrum, AATENIPVVR |
0.000 |
|
0.287 |
|
0.000 |
0.000 |
0.269 |
0.208 |
0.236 |
|
| 1 spectrum, SAPLEIGLQR |
0.376 |
|
0.032 |
|
0.000 |
0.000 |
0.261 |
0.332 |
0.000 |
|
| 2 spectra, ENETLIQR |
0.319 |
|
0.245 |
|
0.000 |
0.000 |
0.330 |
0.017 |
0.089 |
|
| 1 spectrum, SVTEGASAR |
0.000 |
|
0.000 |
|
0.000 |
0.000 |
0.639 |
0.224 |
0.137 |
|
| 2 spectra, IEDEECVR |
0.000 |
|
0.000 |
|
0.000 |
0.000 |
0.229 |
0.389 |
0.382 |
|
| | | Plot |
|
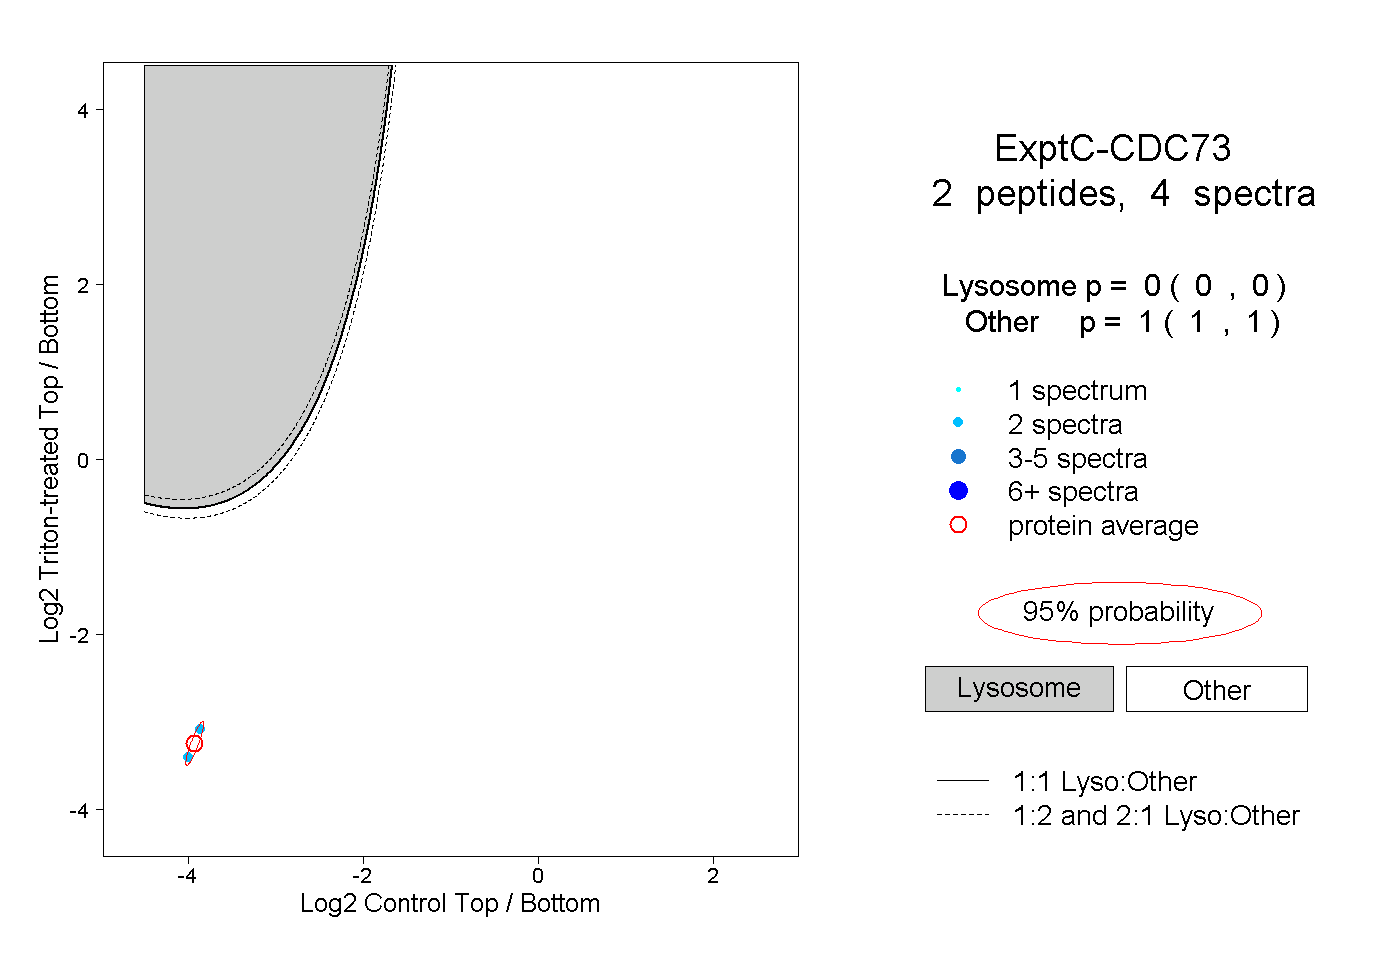
Lyso |
|
|
|
|
|
|
|
Other |
| Expt C |
2
peptides |
4
spectra |
 |
|
0.000
0.000 | 0.000 |
|
|
|
|
|
|
|
1.000
1.000 | 1.000 |
| | | Plot |
|
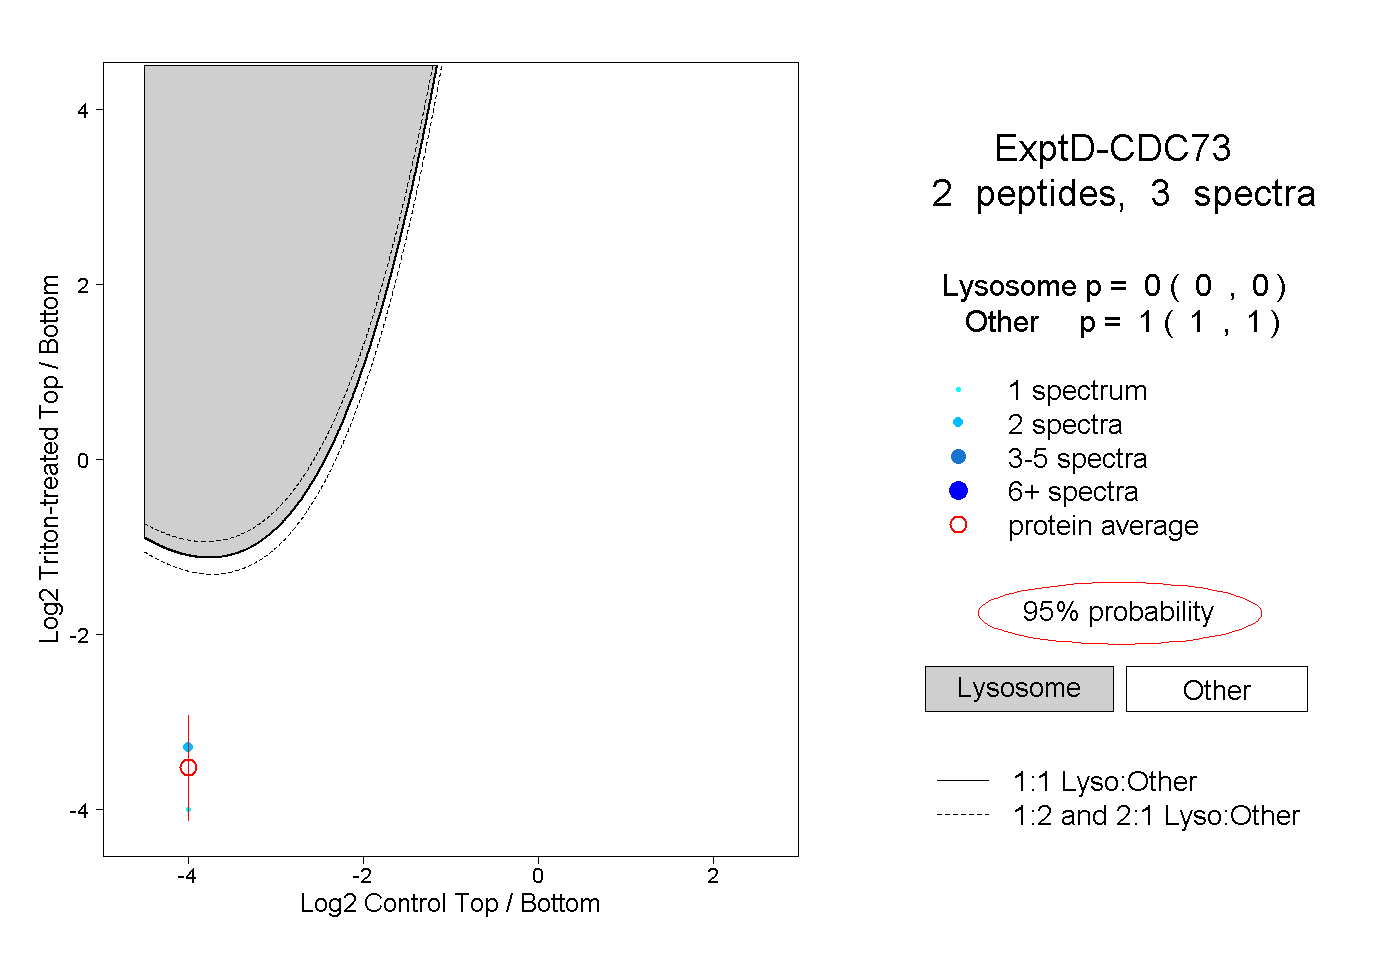
Lyso |
|
|
|
|
|
|
|
Other |
| Expt D |
2
peptides |
3
spectra |
 |
|
0.000
0.000 | 0.000 |
|
|
|
|
|
|
|
1.000
1.000 | 1.000 |