 8
8peptides
spectra
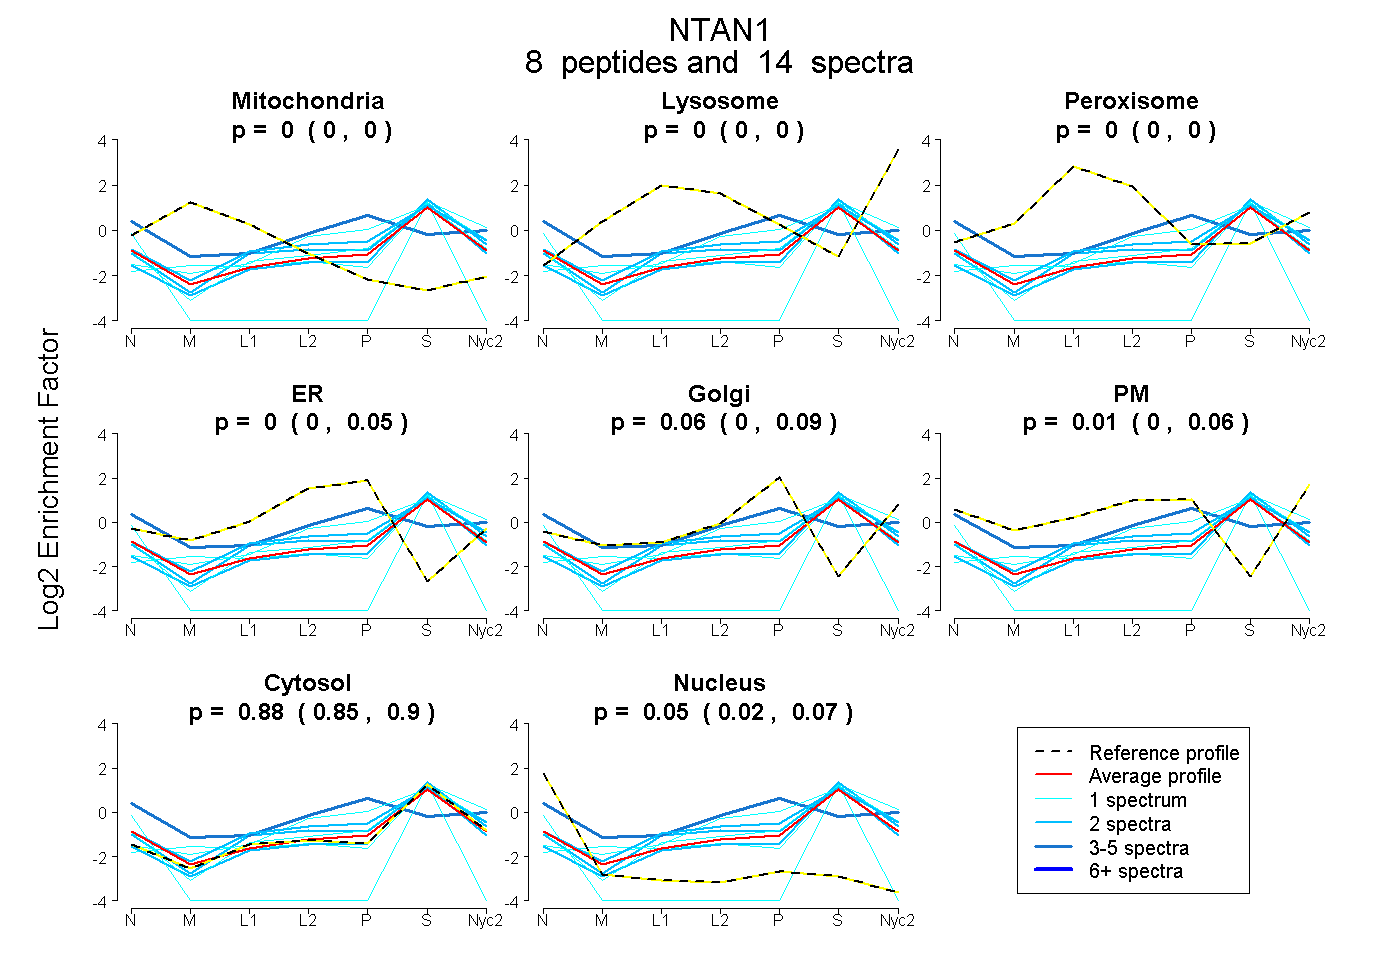
0.000 | 0.000
0.000 | 0.000
0.000 | 0.000
0.000 | 0.055
0.000 | 0.093
0.000 | 0.063
0.852 | 0.901
0.024 | 0.073
4peptides
spectra
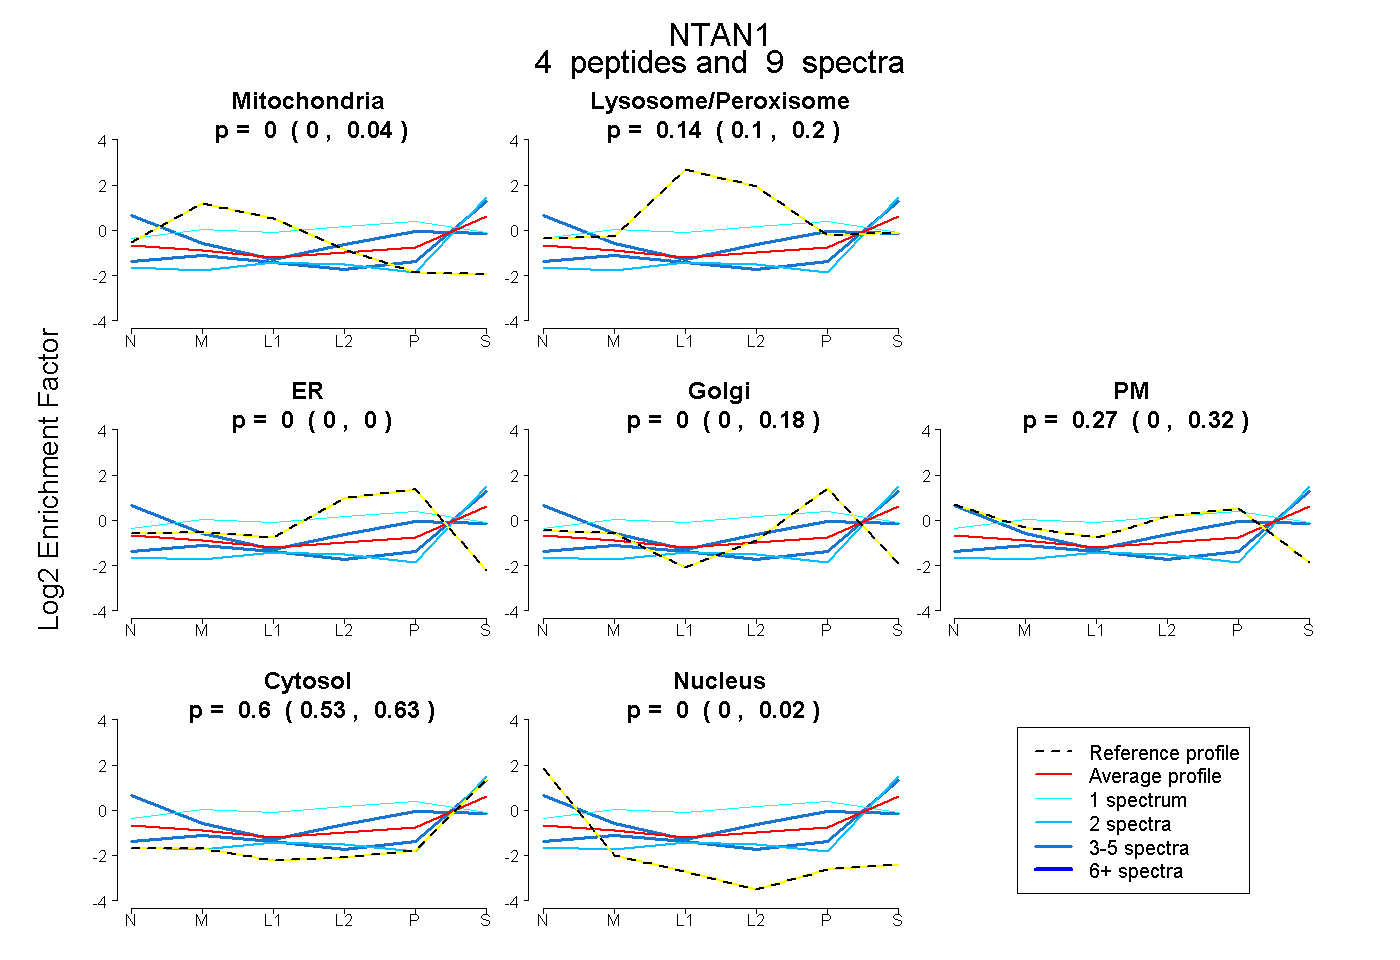
0.000 | 0.042
0.095 | 0.201
0.000 | 0.000
0.000 | 0.179
0.000 | 0.317
0.530 | 0.634
0.000 | 0.019
3peptides
spectra
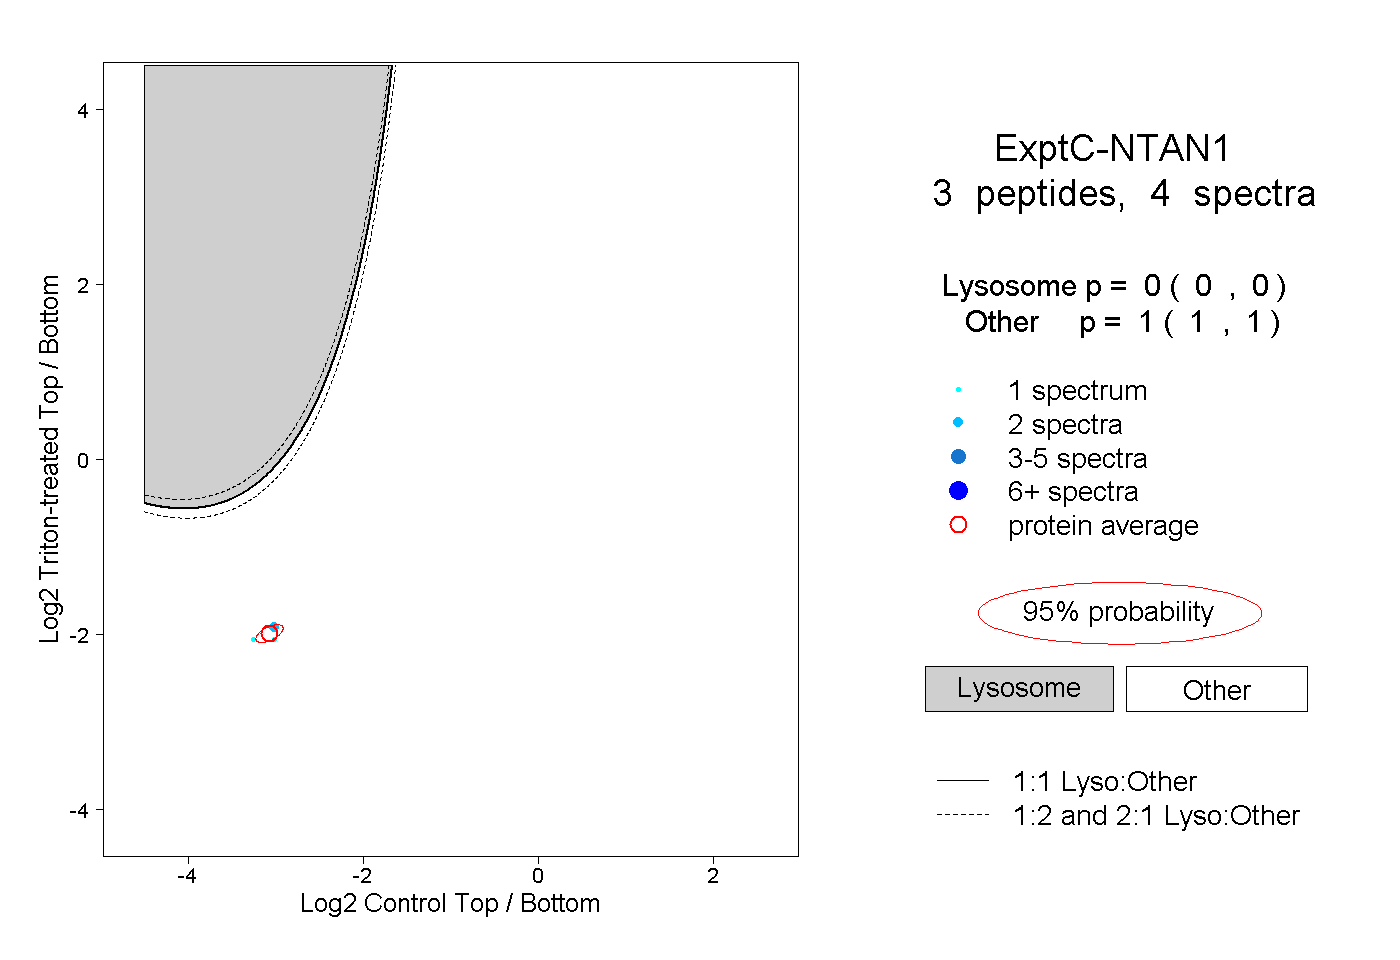
0.000 | 0.000
1.000 | 1.000
1peptide
spectrum
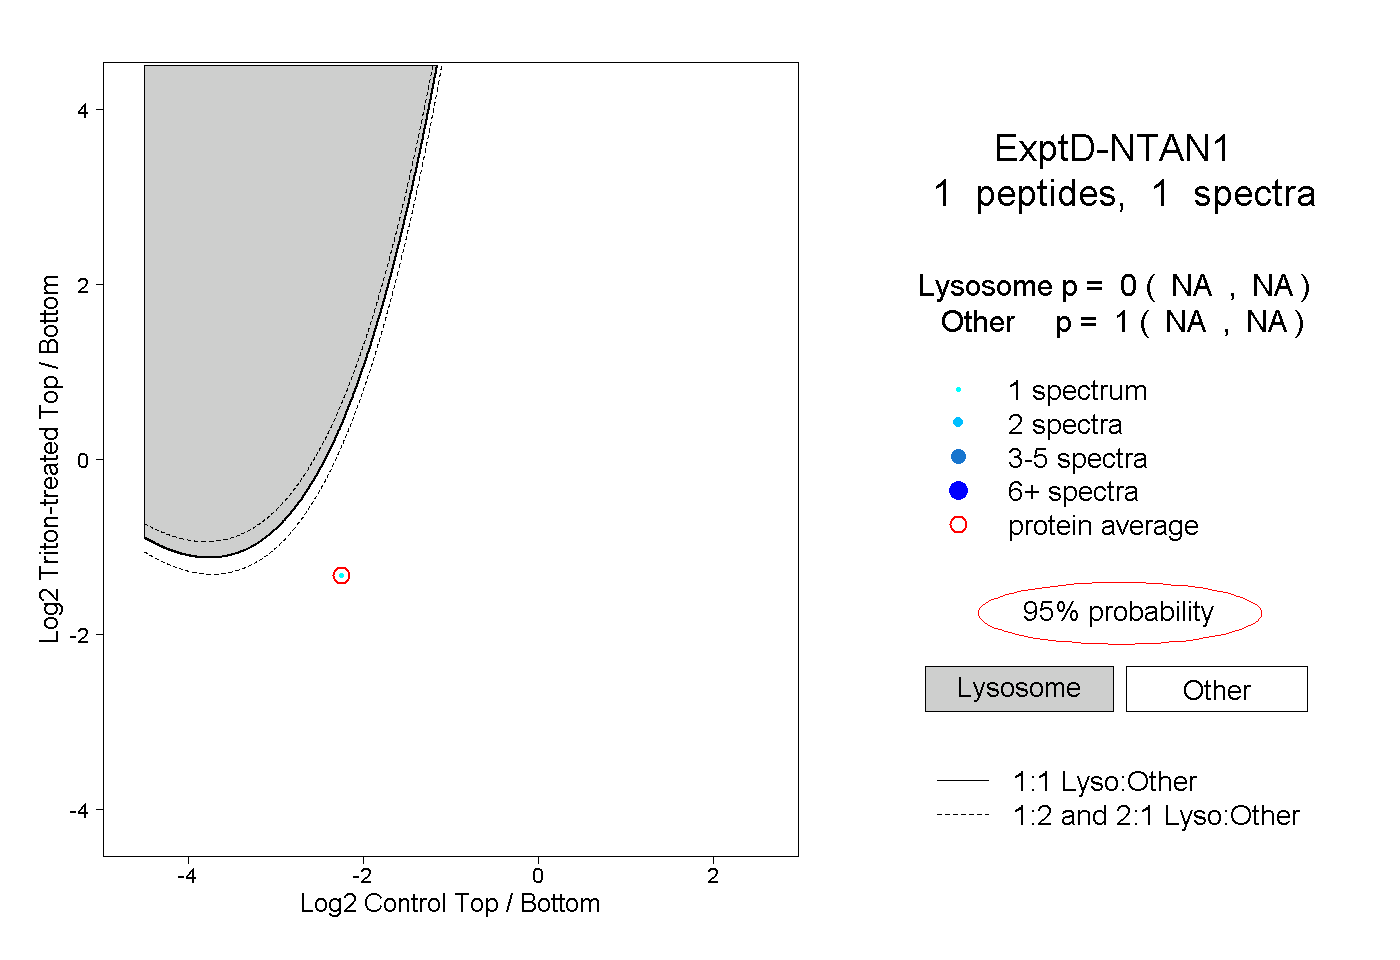
NA | NA
NA | NA