 8
8peptides
spectra
0.000 | 0.000
0.000 | 0.000
0.000 | 0.000
0.000 | 0.055
0.000 | 0.093
0.000 | 0.063
0.852 | 0.901
0.024 | 0.073
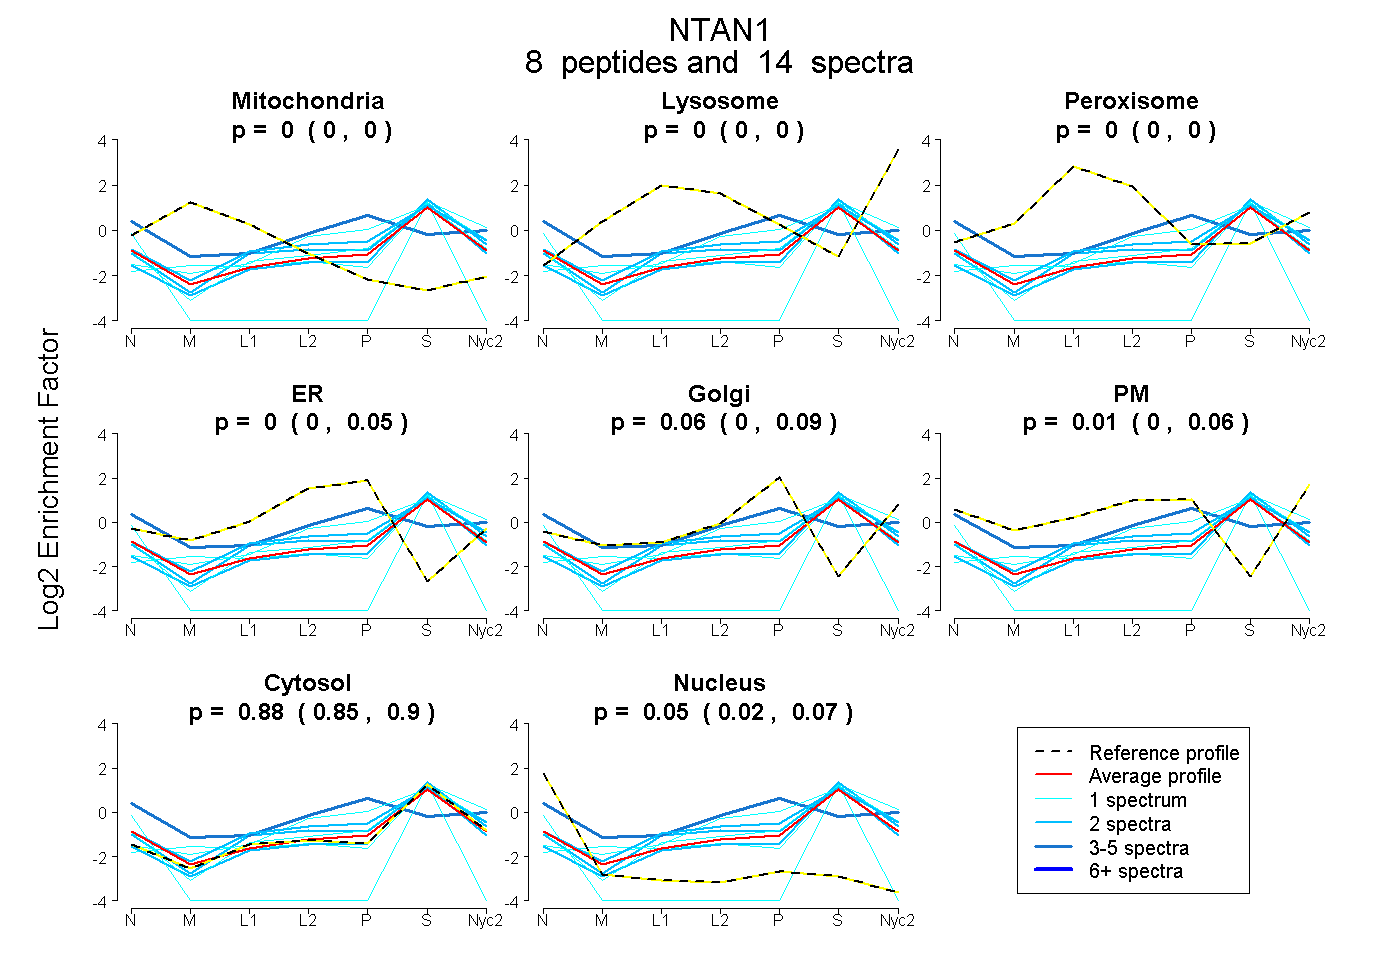
| Plot | Mito | Lyso | Perox | ER | Golgi | PM | Cytosol | Nucleus | |||||
| Expt A |
8 peptides |
14 spectra |
|
0.000 0.000 | 0.000 |
0.000 0.000 | 0.000 |
0.000 0.000 | 0.000 |
0.000 0.000 | 0.055 |
0.059 0.000 | 0.093 |
0.012 0.000 | 0.063 |
0.879 0.852 | 0.901 |
0.050 0.024 | 0.073 |
| 2 spectra, AHPLLEER | 0.000 | 0.000 | 0.006 | 0.088 | 0.000 | 0.000 | 0.906 | 0.000 | ||
| 4 spectra, ALLYR | 0.000 | 0.000 | 0.000 | 0.075 | 0.130 | 0.343 | 0.428 | 0.024 | ||
| 2 spectra, GPEEQLR | 0.000 | 0.000 | 0.000 | 0.000 | 0.000 | 0.000 | 1.000 | 0.000 | ||
| 1 spectrum, LPLSATELVR | 0.000 | 0.000 | 0.000 | 0.000 | 0.081 | 0.002 | 0.917 | 0.000 | ||
| 1 spectrum, LEVHLVGGFSDDR | 0.000 | 0.000 | 0.000 | 0.223 | 0.000 | 0.000 | 0.777 | 0.000 | ||
| 1 spectrum, ALAGGPMISIYDAK | 0.000 | 0.103 | 0.000 | 0.000 | 0.000 | 0.000 | 0.897 | 0.000 | ||
| 1 spectrum, GQSVQQVGPQGLLYVQQR | 0.000 | 0.000 | 0.000 | 0.000 | 0.000 | 0.000 | 0.397 | 0.603 | ||
| 2 spectra, TAEIYR | 0.000 | 0.000 | 0.064 | 0.053 | 0.032 | 0.059 | 0.792 | 0.000 |
| Plot | Mito | Lyso or Perox | ER | Golgi | PM | Cytosol | Nucleus | ||||||
| Expt B |
4 peptides |
9 spectra |
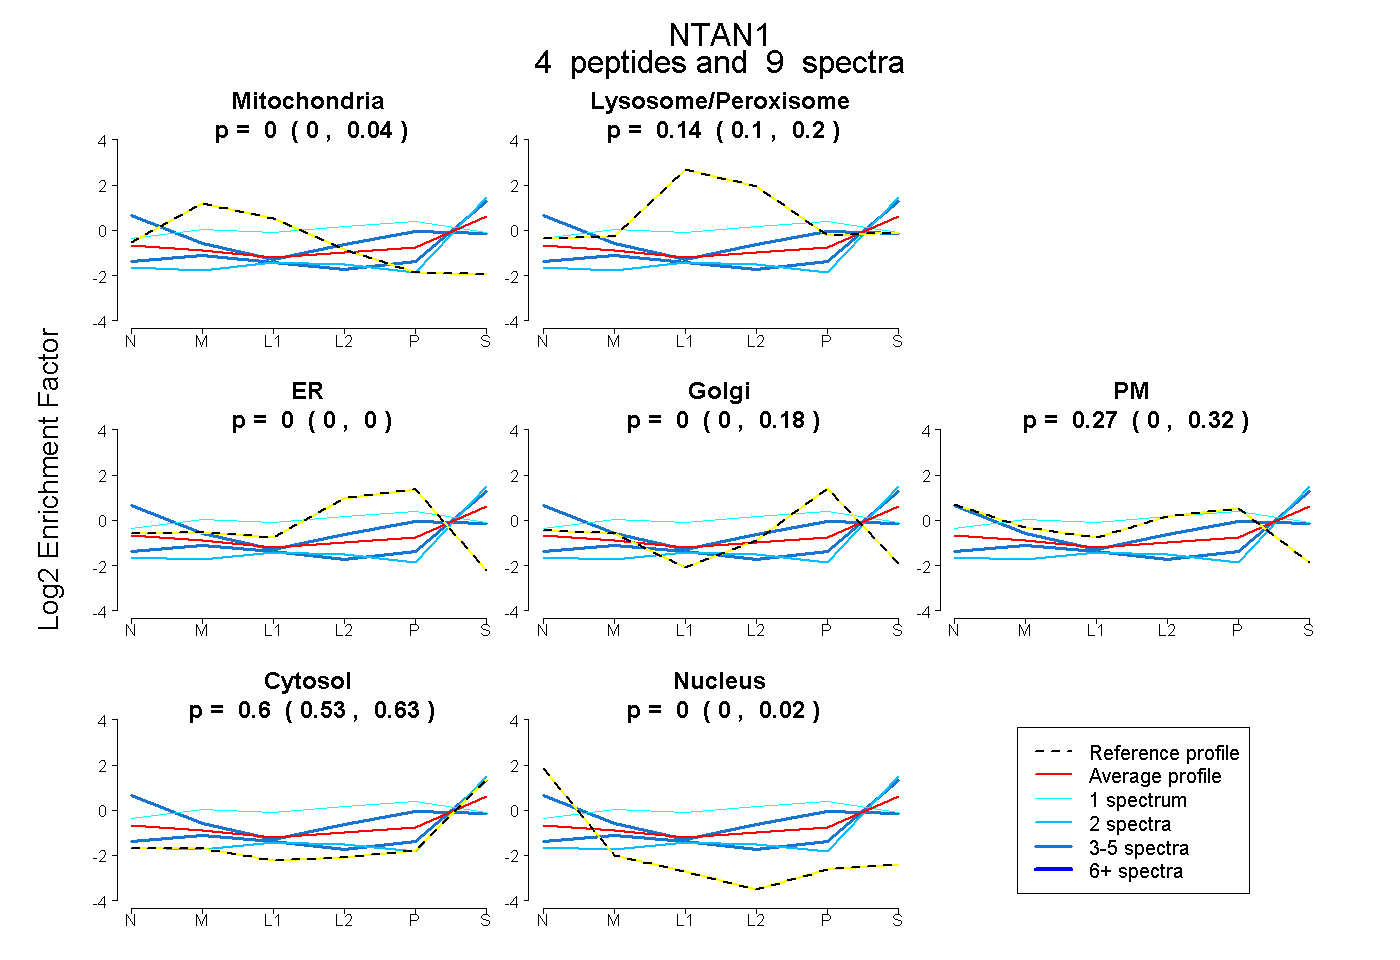 |
0.000 0.000 | 0.042 |
0.136 0.095 | 0.201 |
0.000 0.000 | 0.000 |
0.000 0.000 | 0.179 |
0.267 0.000 | 0.317 |
0.597 0.530 | 0.634 |
0.000 0.000 | 0.019 |
|||
| Plot | Lyso | Other | |||||||||||
| Expt C |
3 peptides |
4 spectra |
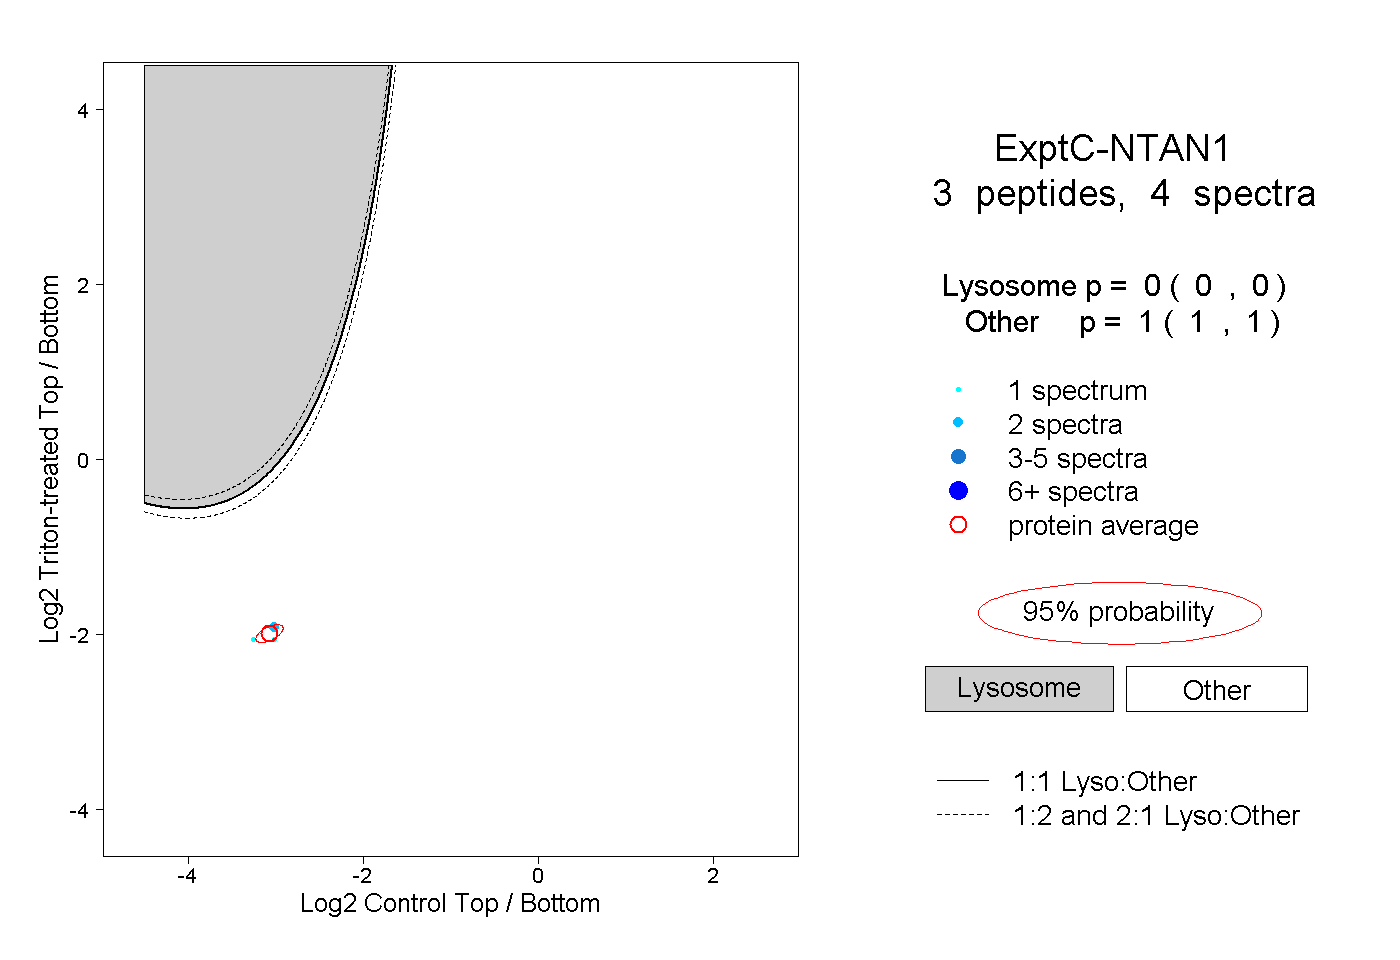 |
0.000 0.000 | 0.000 |
1.000 1.000 | 1.000 |
||||||||
| Plot | Lyso | Other | |||||||||||
| Expt D |
1 peptide |
1 spectrum |
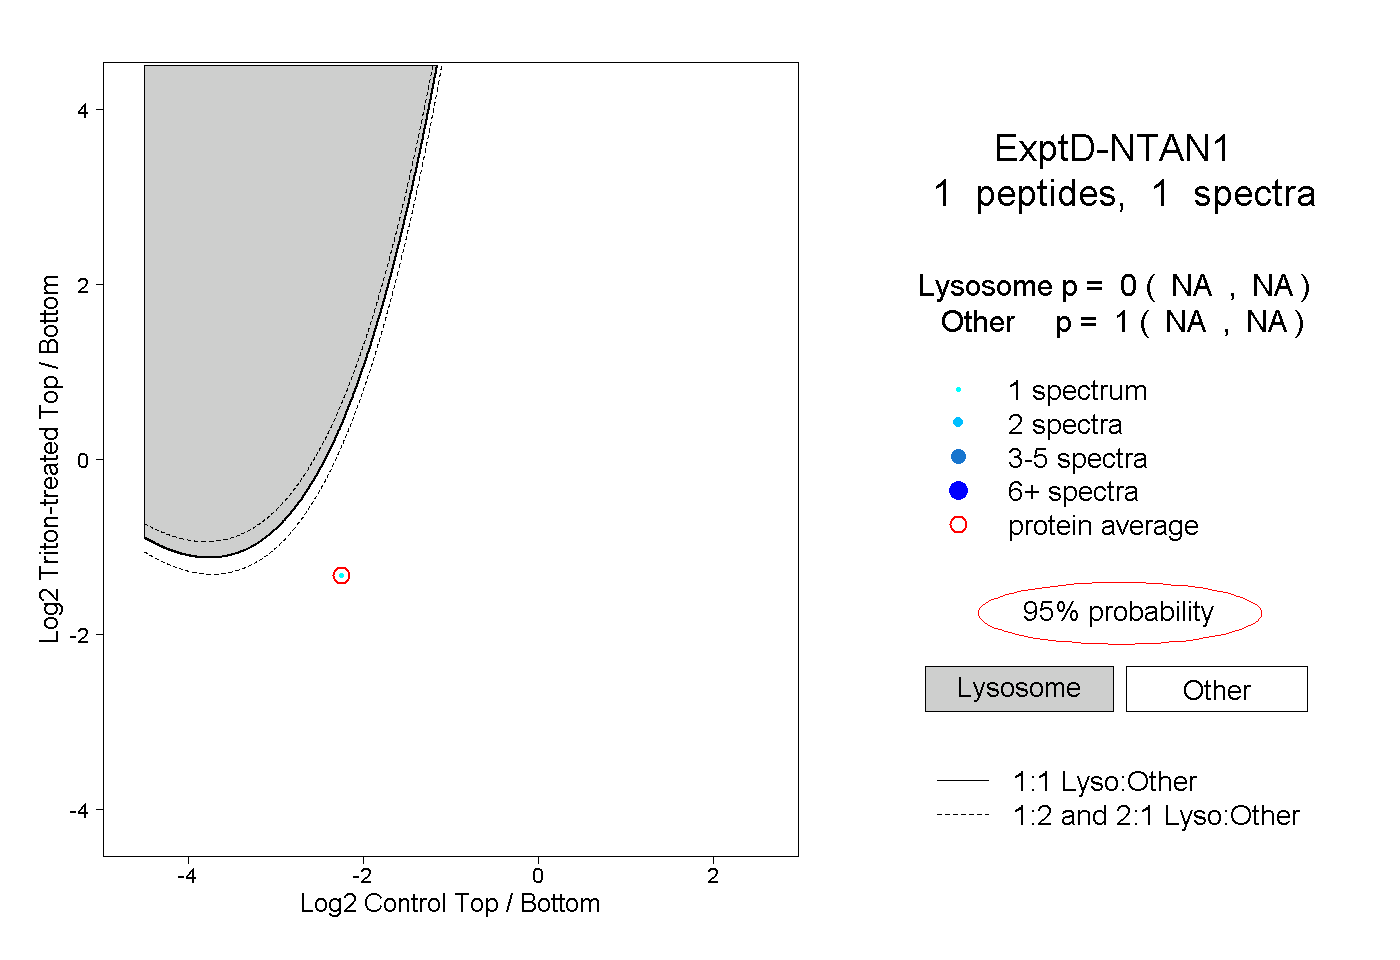 |
0.000 NA | NA |
1.000 NA | NA |