NTAN1
[ENSRNOP00000004429]
Main page
| | | Plot |
Mito |
Lyso |
|
Perox |
ER |
Golgi |
PM |
Cytosol |
Nucleus |
|
| Expt A |
 8
8
peptides |
14
spectra |
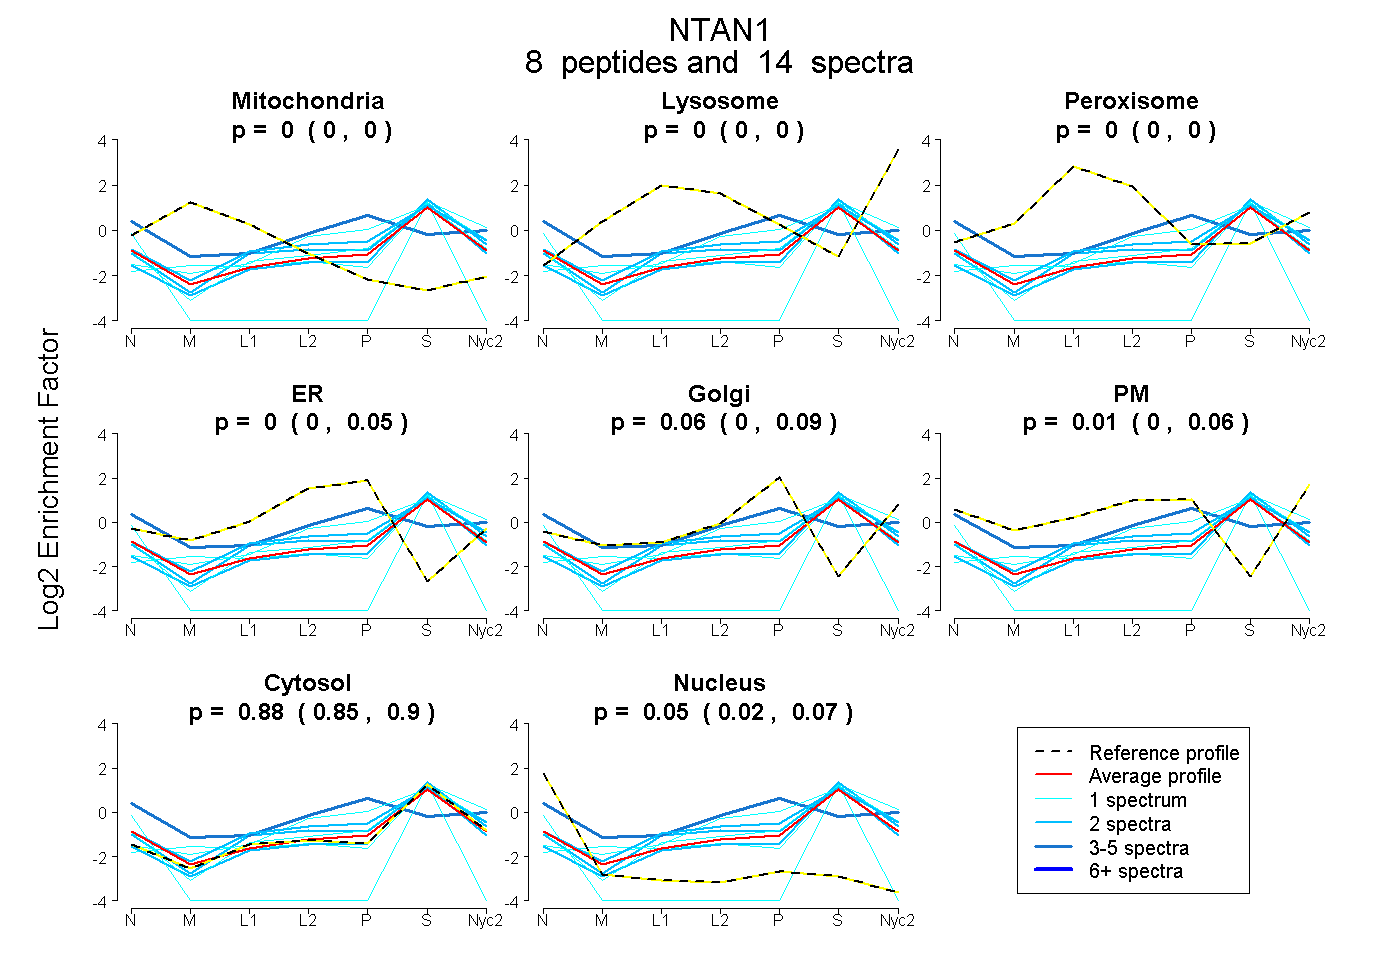 |
0.000
0.000 | 0.000 |
0.000
0.000 | 0.000 |
|
0.000
0.000 | 0.000 |
0.000
0.000 | 0.055 |
0.059
0.000 | 0.093 |
0.012
0.000 | 0.063 |
0.879
0.852 | 0.901 |
0.050
0.024 | 0.073 |
|
| | | Plot |
Mito |
|
Lyso or Perox |
|
ER |
Golgi |
PM |
Cytosol |
Nucleus |
|
| Expt B |
4
peptides |
9
spectra |
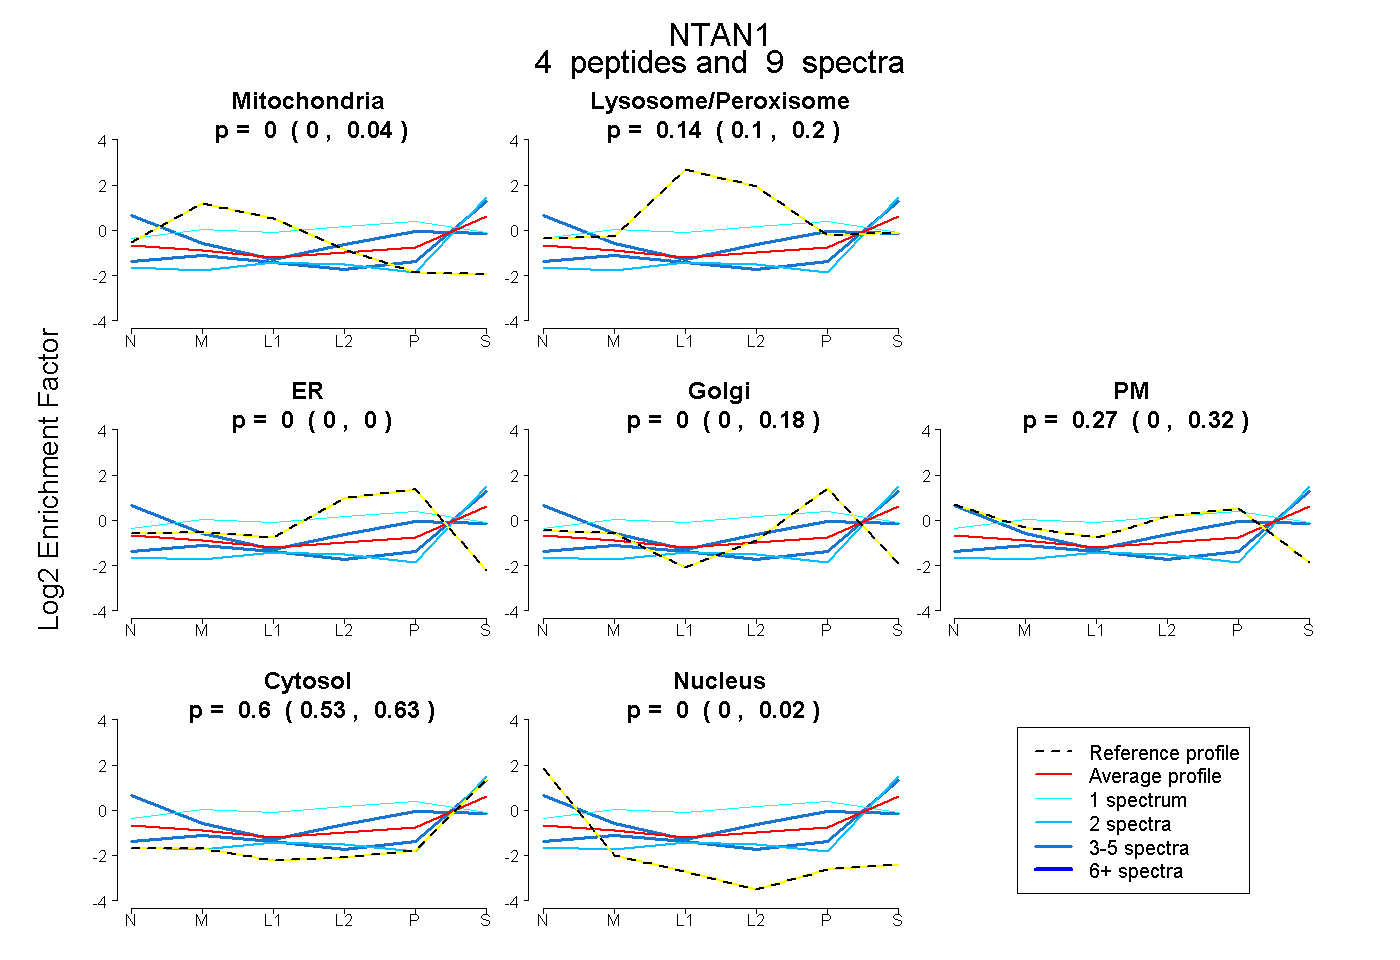 |
0.000
0.000 | 0.042 |
|
0.136
0.095 | 0.201 |
|
0.000
0.000 | 0.000 |
0.000
0.000 | 0.179 |
0.267
0.000 | 0.317 |
0.597
0.530 | 0.634 |
0.000
0.000 | 0.019 |
|
| 1 spectrum, MPLLVDGR |
0.008 |
|
0.440 |
|
0.000 |
0.362 |
0.035 |
0.156 |
0.000 |
|
| 3 spectra, AHPLLEER |
0.044 |
|
0.125 |
|
0.000 |
0.000 |
0.000 |
0.830 |
0.000 |
|
| 3 spectra, ALLYR |
0.000 |
|
0.011 |
|
0.000 |
0.000 |
0.659 |
0.322 |
0.008 |
|
| 2 spectra, GPEEQLR |
0.000 |
|
0.122 |
|
0.000 |
0.000 |
0.000 |
0.878 |
0.000 |
|
| | | Plot |
|
Lyso |
|
|
|
|
|
|
|
Other |
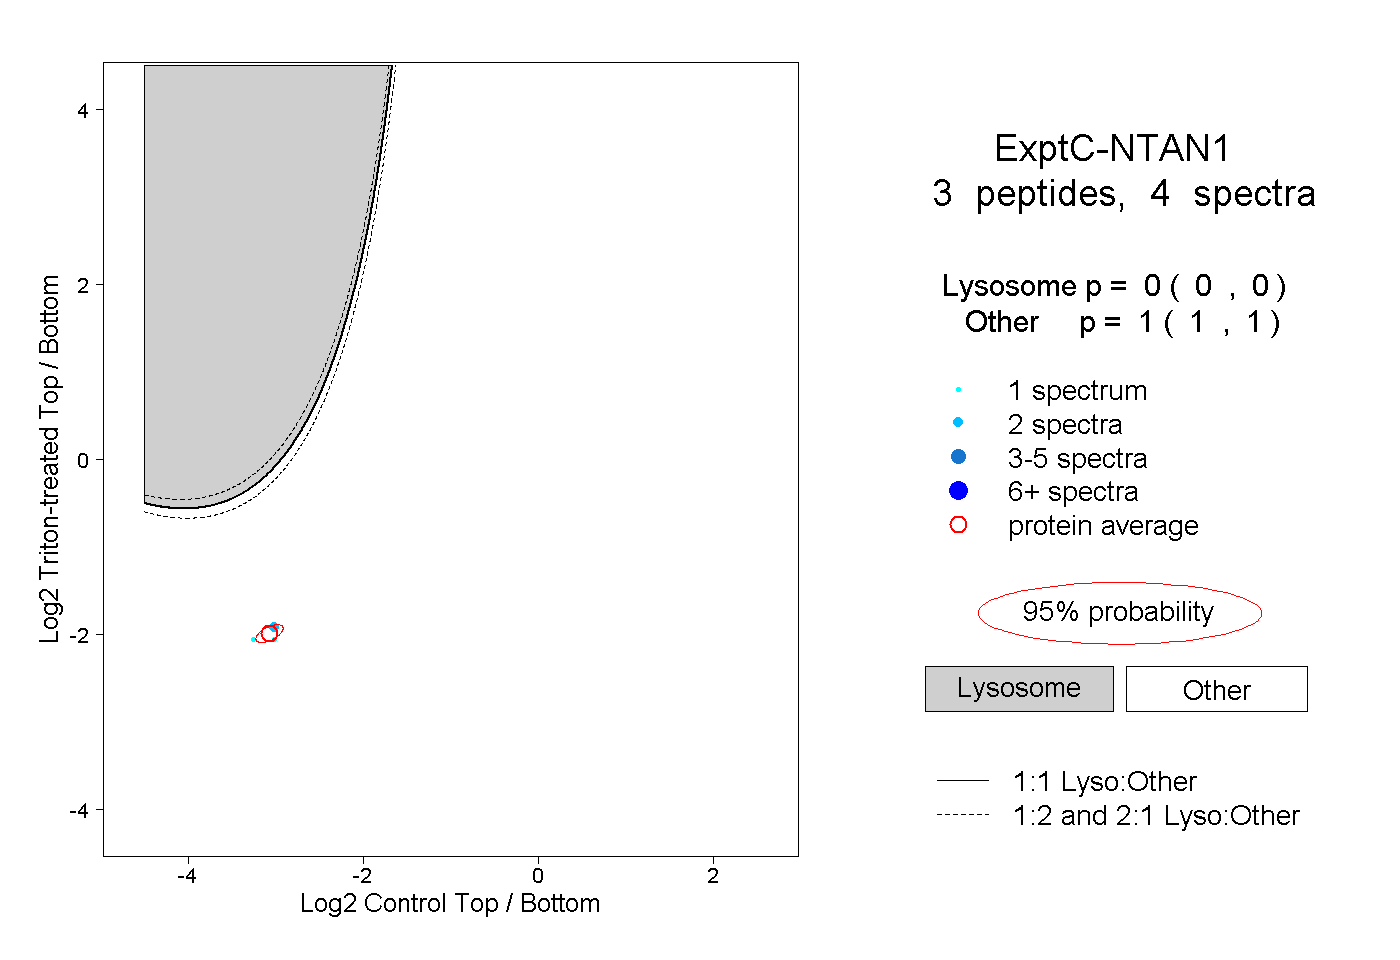
| Expt C |
3
peptides |
4
spectra |
 |
|
0.000
0.000 | 0.000 |
|
|
|
|
|
|
|
1.000
1.000 | 1.000 |
| | | Plot |
|
Lyso |
|
|
|
|
|
|
|
Other |
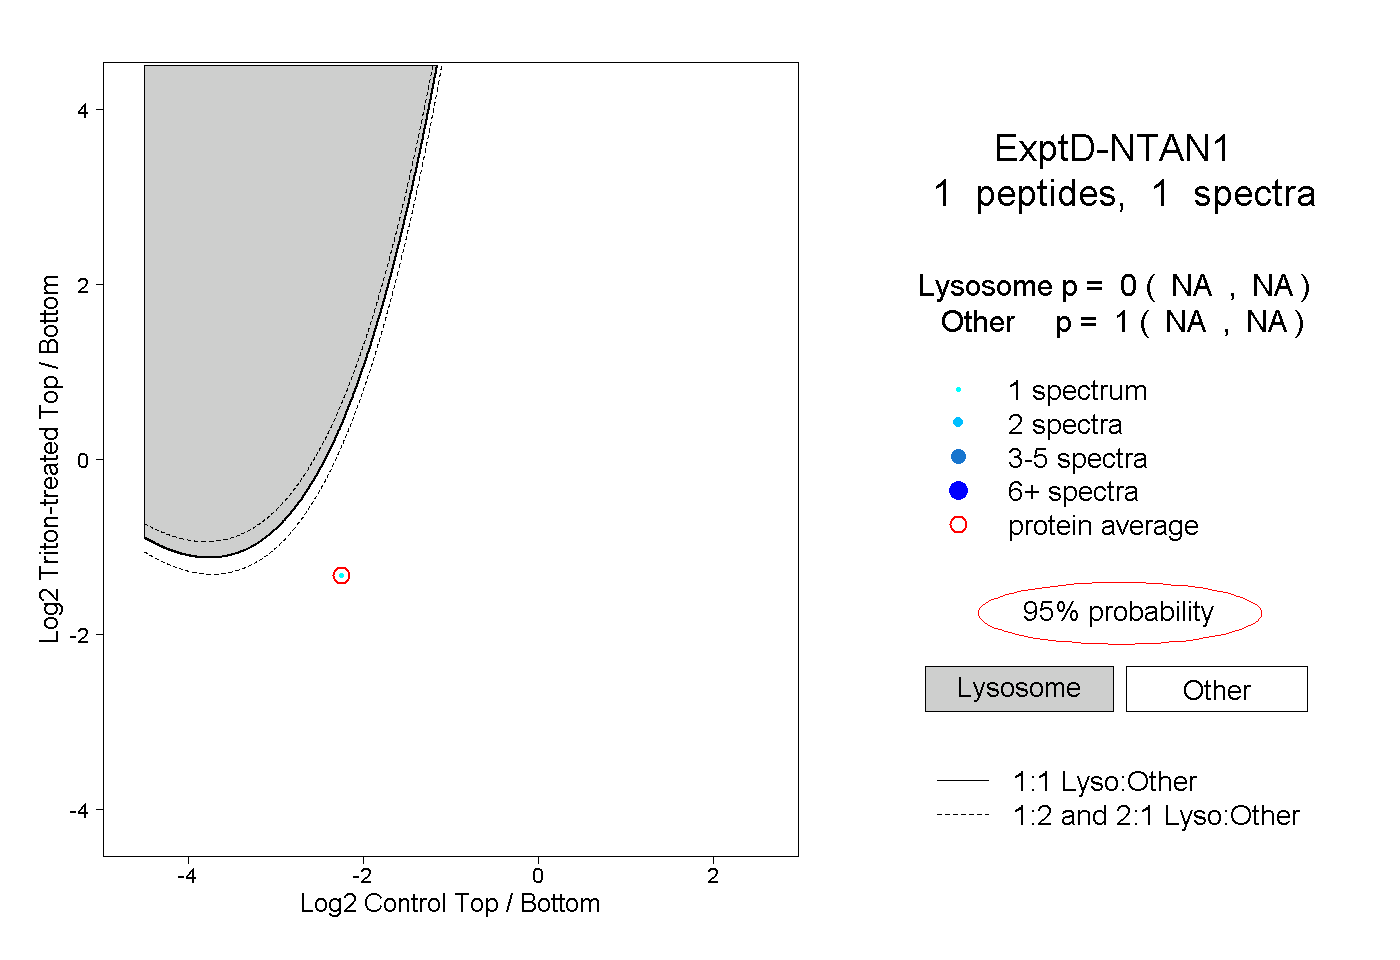
| Expt D |
1
peptide |
1
spectrum |
 |
|
0.000
NA | NA |
|
|
|
|
|
|
|
1.000
NA | NA |