 12
12peptides
spectra
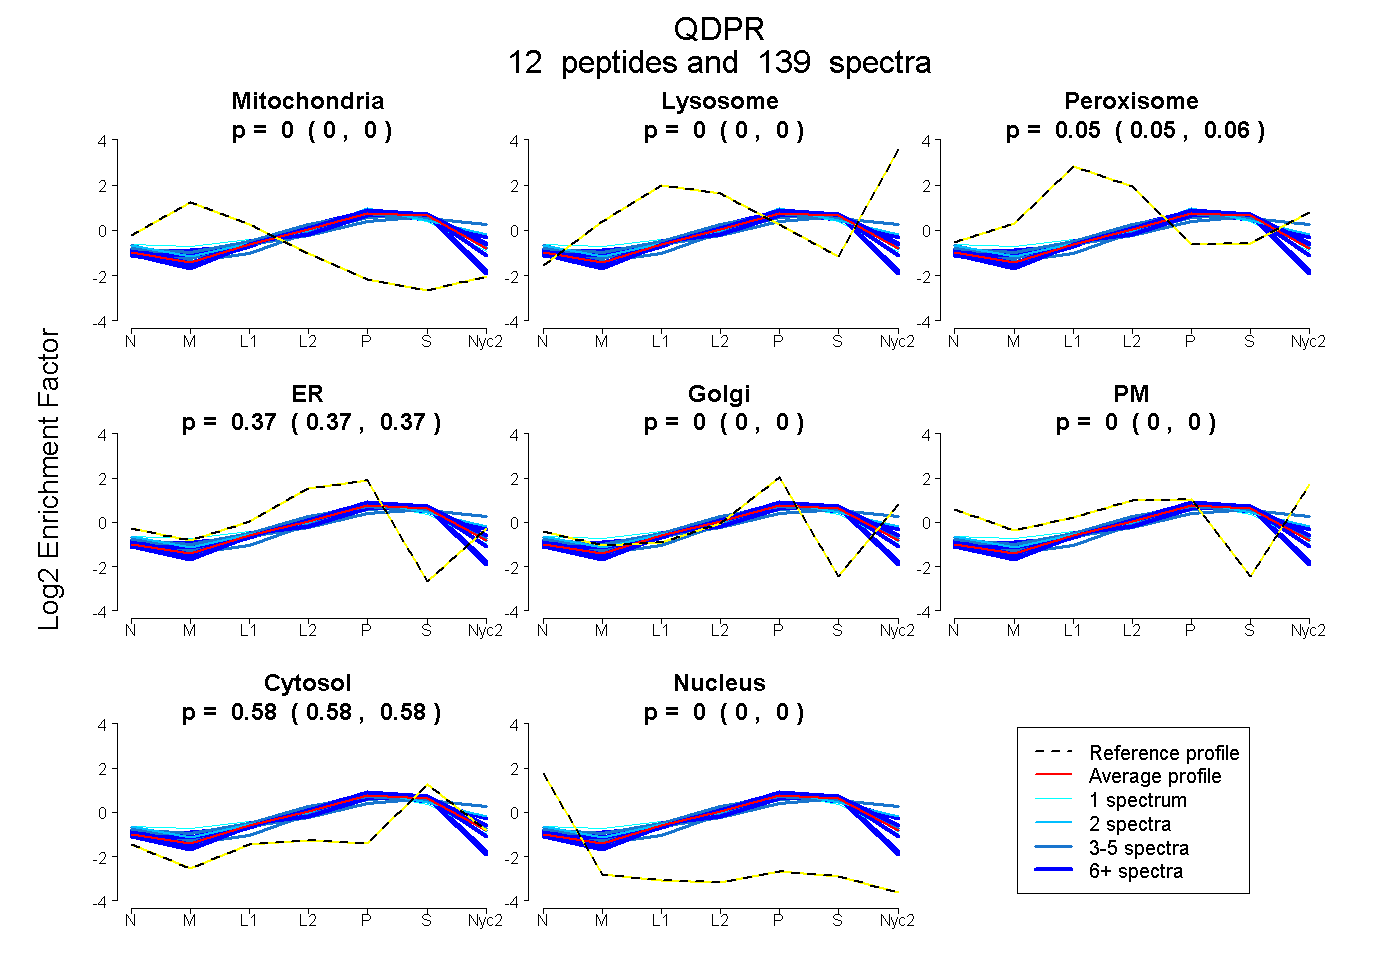
0.000 | 0.000
0.000 | 0.000
0.052 | 0.056
0.366 | 0.370
0.000 | 0.000
0.000 | 0.000
0.576 | 0.579
0.000 | 0.000
9peptides
spectra
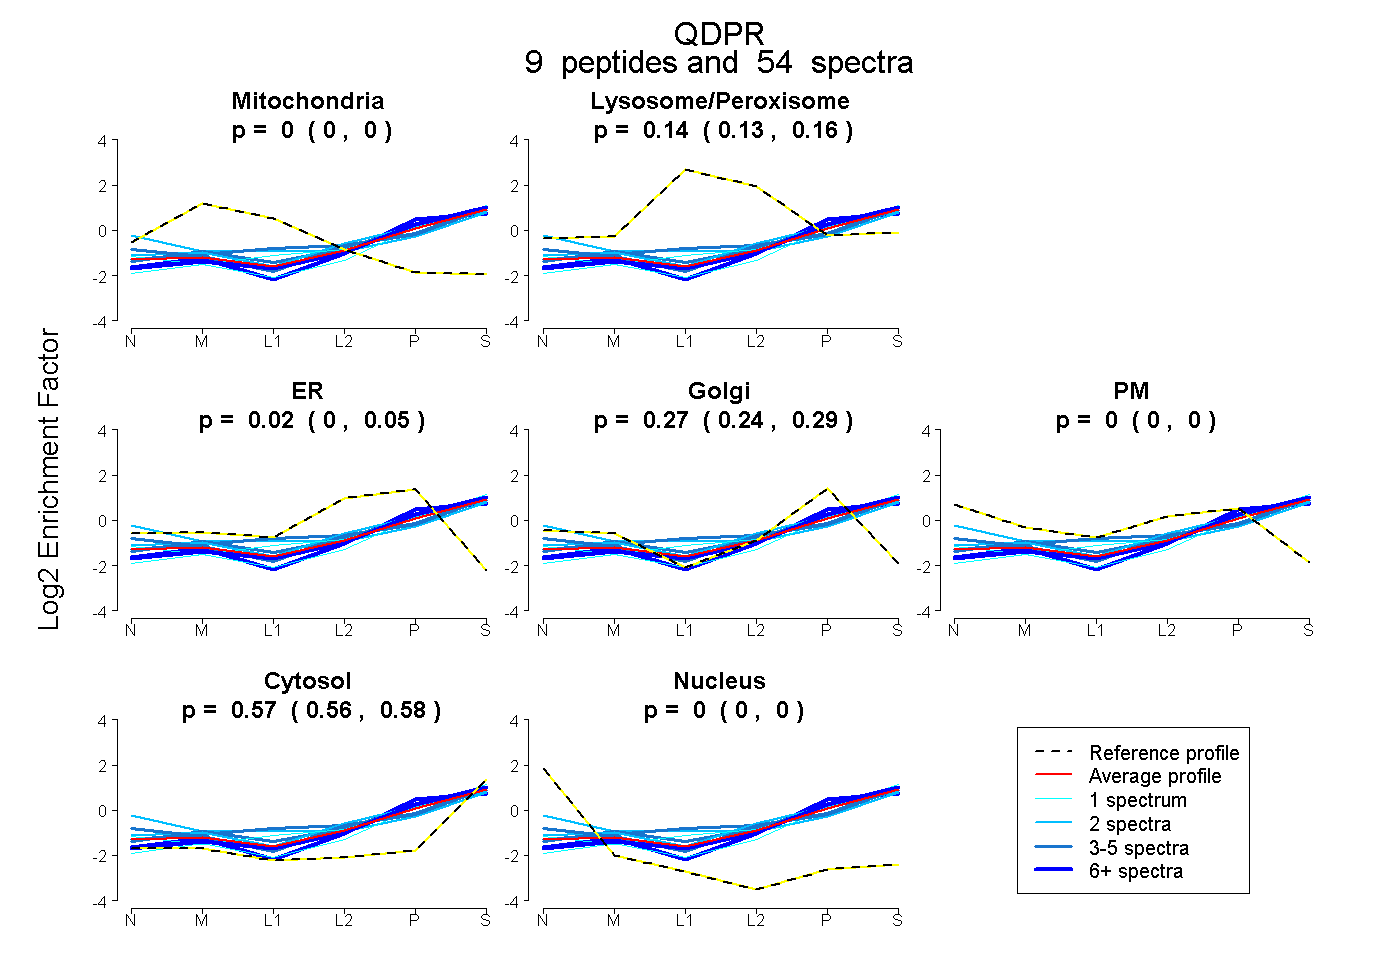
0.000 | 0.000
0.130 | 0.155
0.000 | 0.046
0.239 | 0.286
0.000 | 0.000
0.558 | 0.576
0.000 | 0.000
10peptides
spectra
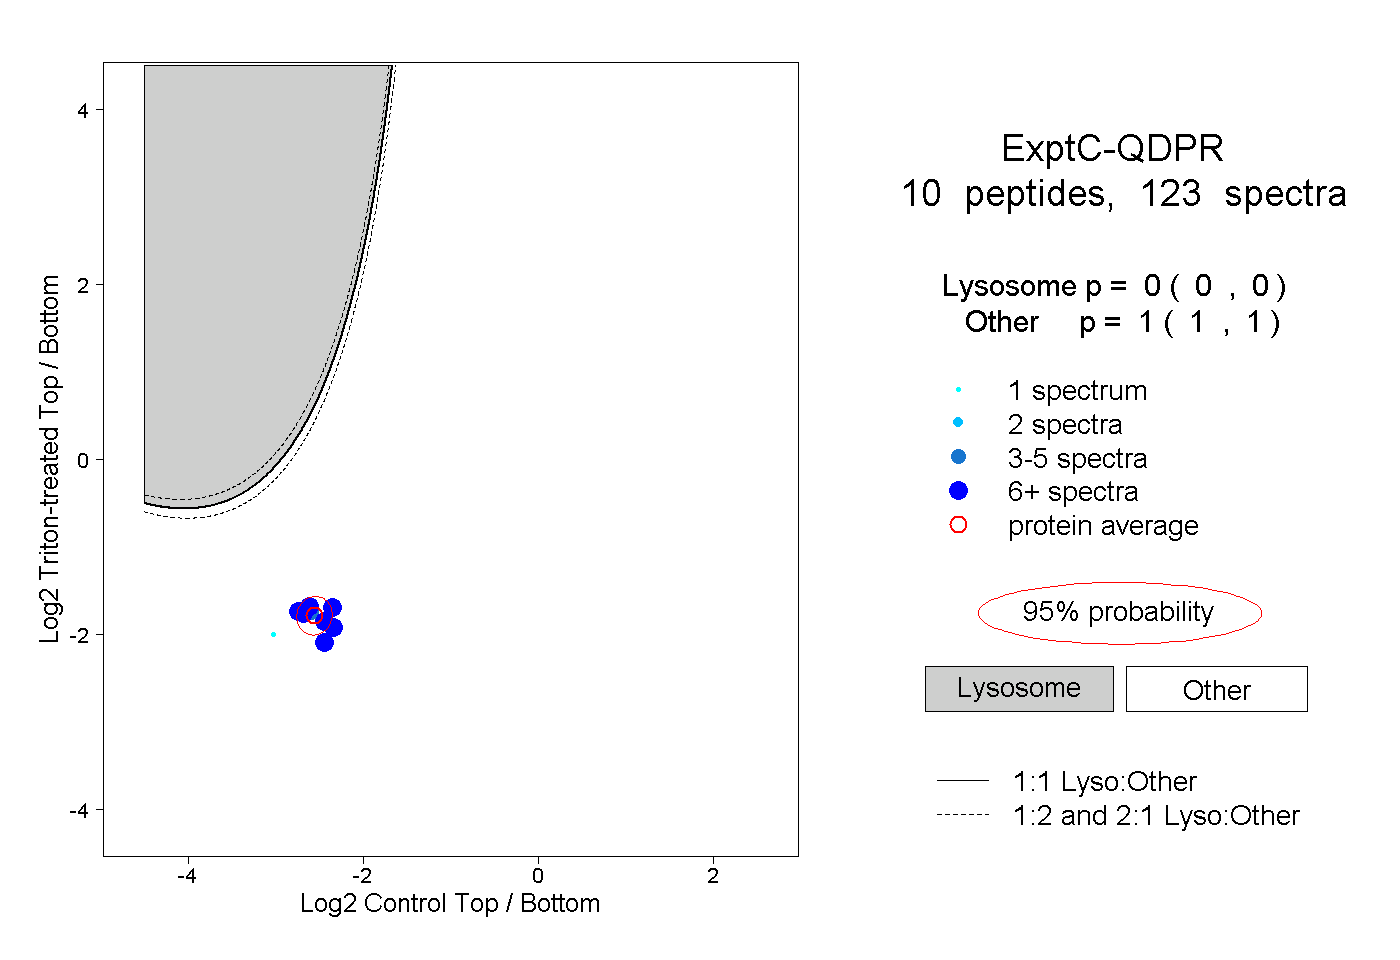
0.000 | 0.000
1.000 | 1.000
4peptides
spectra
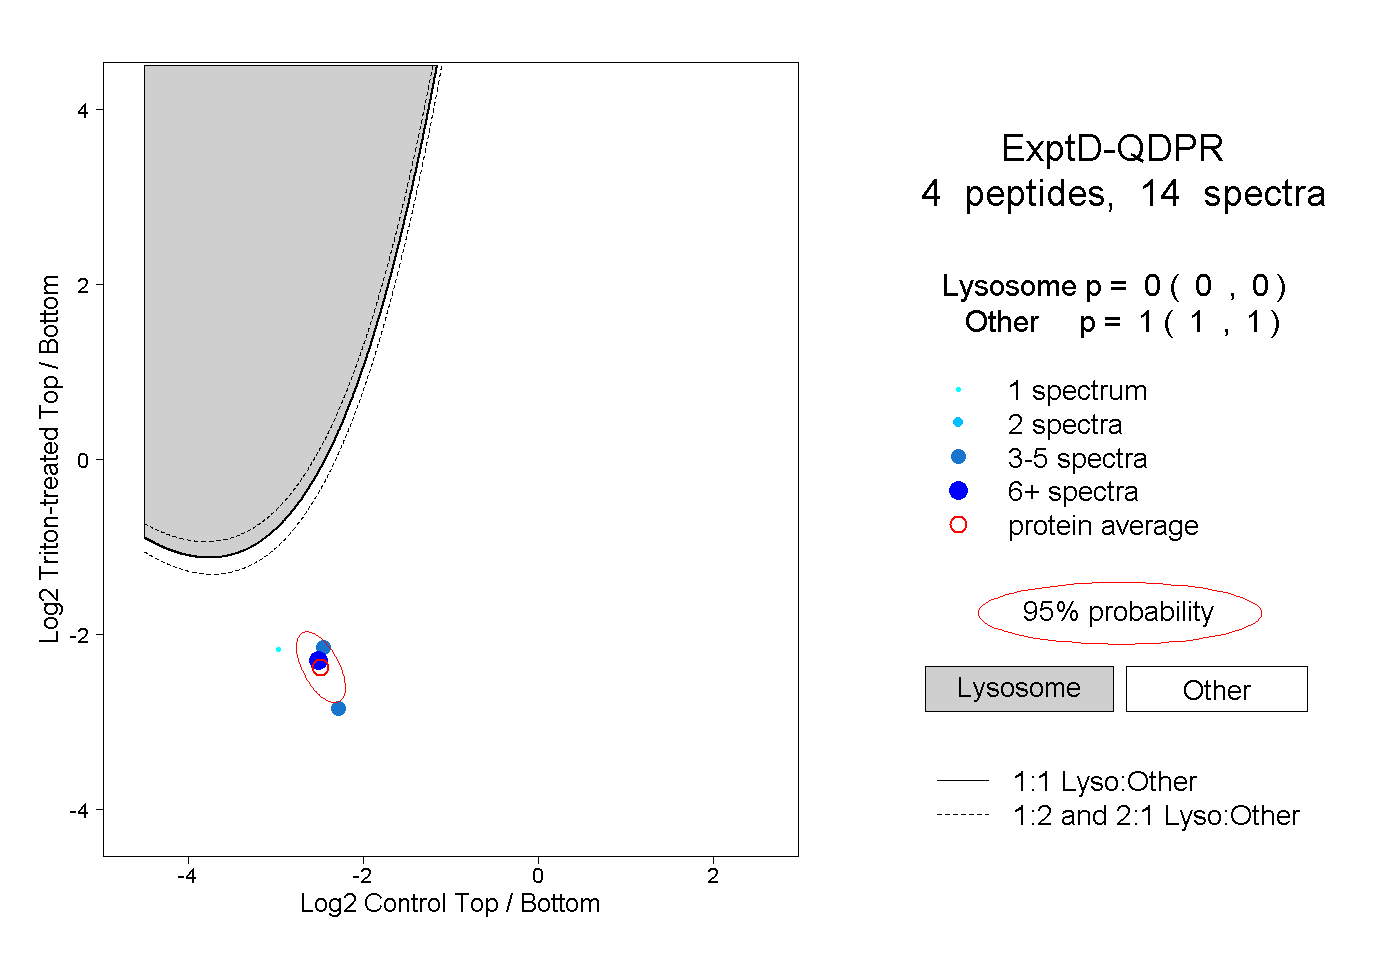
0.000 | 0.000
1.000 | 1.000