 12
12peptides
spectra
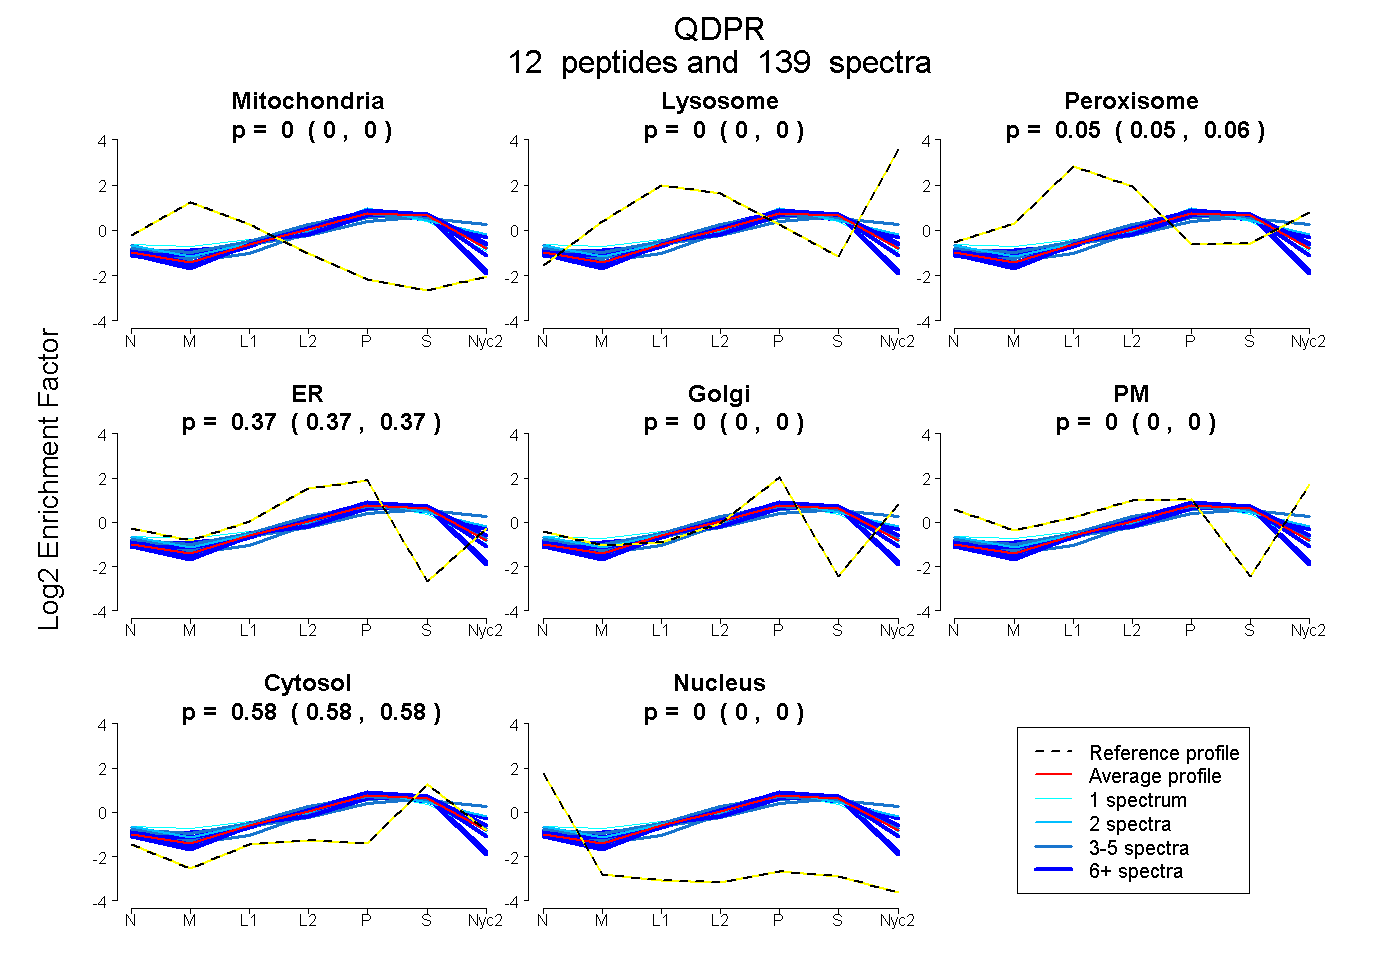
0.000 | 0.000
0.000 | 0.000
0.052 | 0.056
0.366 | 0.370
0.000 | 0.000
0.000 | 0.000
0.576 | 0.579
0.000 | 0.000
| Plot | Mito | Lyso | Perox | ER | Golgi | PM | Cytosol | Nucleus | |||||
| Expt A |
12 peptides |
139 spectra |
|
0.000 0.000 | 0.000 |
0.000 0.000 | 0.000 |
0.054 0.052 | 0.056 |
0.368 0.366 | 0.370 |
0.000 0.000 | 0.000 |
0.000 0.000 | 0.000 |
0.578 0.576 | 0.579 |
0.000 0.000 | 0.000 |
| 16 spectra, GAVHQLCQSLAGK | 0.000 | 0.000 | 0.000 | 0.395 | 0.000 | 0.000 | 0.605 | 0.000 | ||
| 4 spectra, RPNSGSLIQVVTTDGK | 0.000 | 0.147 | 0.077 | 0.154 | 0.162 | 0.000 | 0.459 | 0.000 | ||
| 3 spectra, LLGDQK | 0.000 | 0.000 | 0.000 | 0.373 | 0.000 | 0.000 | 0.627 | 0.000 | ||
| 1 spectrum, GALGSR | 0.009 | 0.000 | 0.098 | 0.367 | 0.028 | 0.000 | 0.499 | 0.000 | ||
| 6 spectra, EGGLLTLAGAK | 0.000 | 0.017 | 0.125 | 0.194 | 0.179 | 0.000 | 0.486 | 0.000 | ||
| 24 spectra, CVQAFR | 0.000 | 0.000 | 0.000 | 0.401 | 0.000 | 0.000 | 0.599 | 0.000 | ||
| 7 spectra, NCDLMWK | 0.000 | 0.000 | 0.065 | 0.364 | 0.000 | 0.000 | 0.570 | 0.000 | ||
| 6 spectra, QSIWTSTISSHLATK | 0.000 | 0.000 | 0.091 | 0.268 | 0.063 | 0.000 | 0.579 | 0.000 | ||
| 41 spectra, VLVYGGR | 0.000 | 0.028 | 0.010 | 0.375 | 0.000 | 0.000 | 0.587 | 0.000 | ||
| 25 spectra, AALDGTPGMIGYGMAK | 0.000 | 0.009 | 0.054 | 0.326 | 0.020 | 0.000 | 0.590 | 0.000 | ||
| 4 spectra, MTDSFTEQADQVTAEVGK | 0.000 | 0.000 | 0.086 | 0.293 | 0.025 | 0.000 | 0.595 | 0.000 | ||
| 2 spectra, VDAILCVAGGWAGGNAK | 0.000 | 0.000 | 0.136 | 0.137 | 0.272 | 0.000 | 0.455 | 0.000 |
| Plot | Mito | Lyso or Perox | ER | Golgi | PM | Cytosol | Nucleus | ||||||
| Expt B |
9 peptides |
54 spectra |
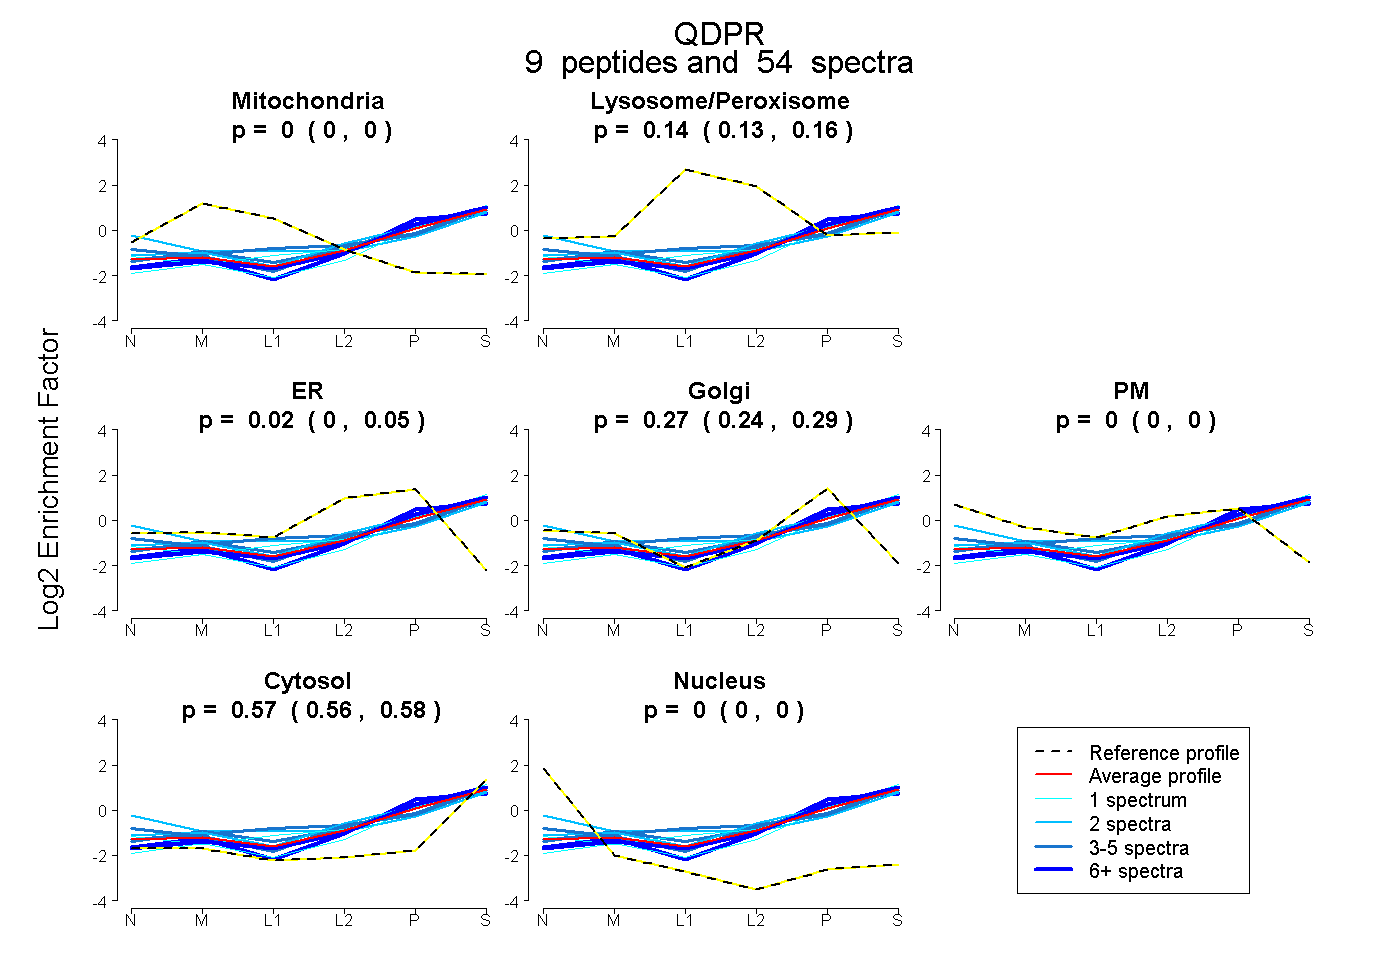 |
0.000 0.000 | 0.000 |
0.145 0.130 | 0.155 |
0.020 0.000 | 0.046 |
0.268 0.239 | 0.286 |
0.000 0.000 | 0.000 |
0.567 0.558 | 0.576 |
0.000 0.000 | 0.000 |
|||
| Plot | Lyso | Other | |||||||||||
| Expt C |
10 peptides |
123 spectra |
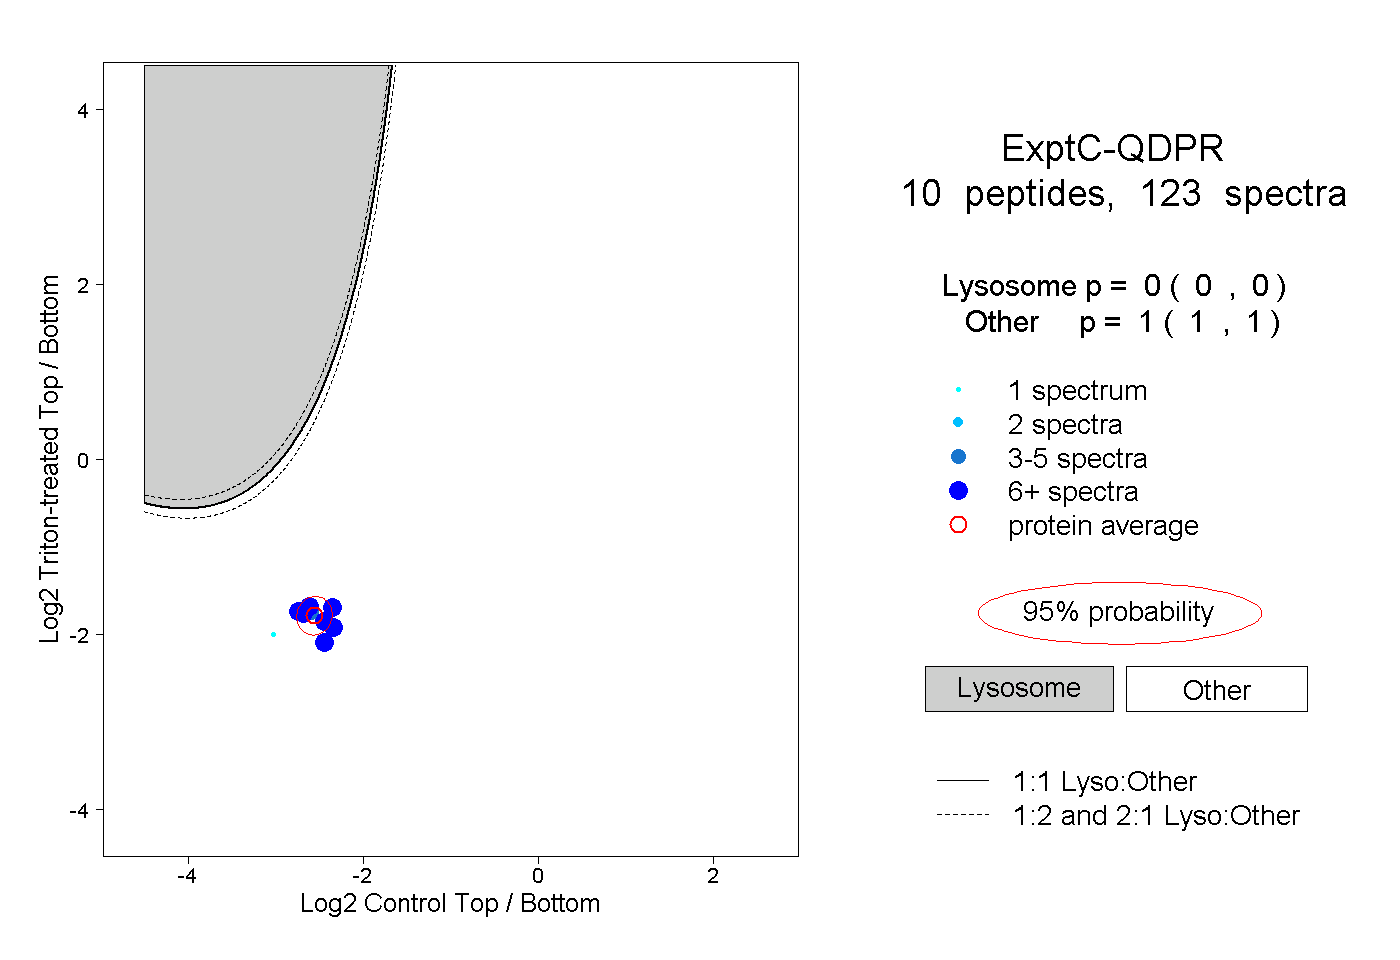 |
0.000 0.000 | 0.000 |
1.000 1.000 | 1.000 |
||||||||
| Plot | Lyso | Other | |||||||||||
| Expt D |
4 peptides |
14 spectra |
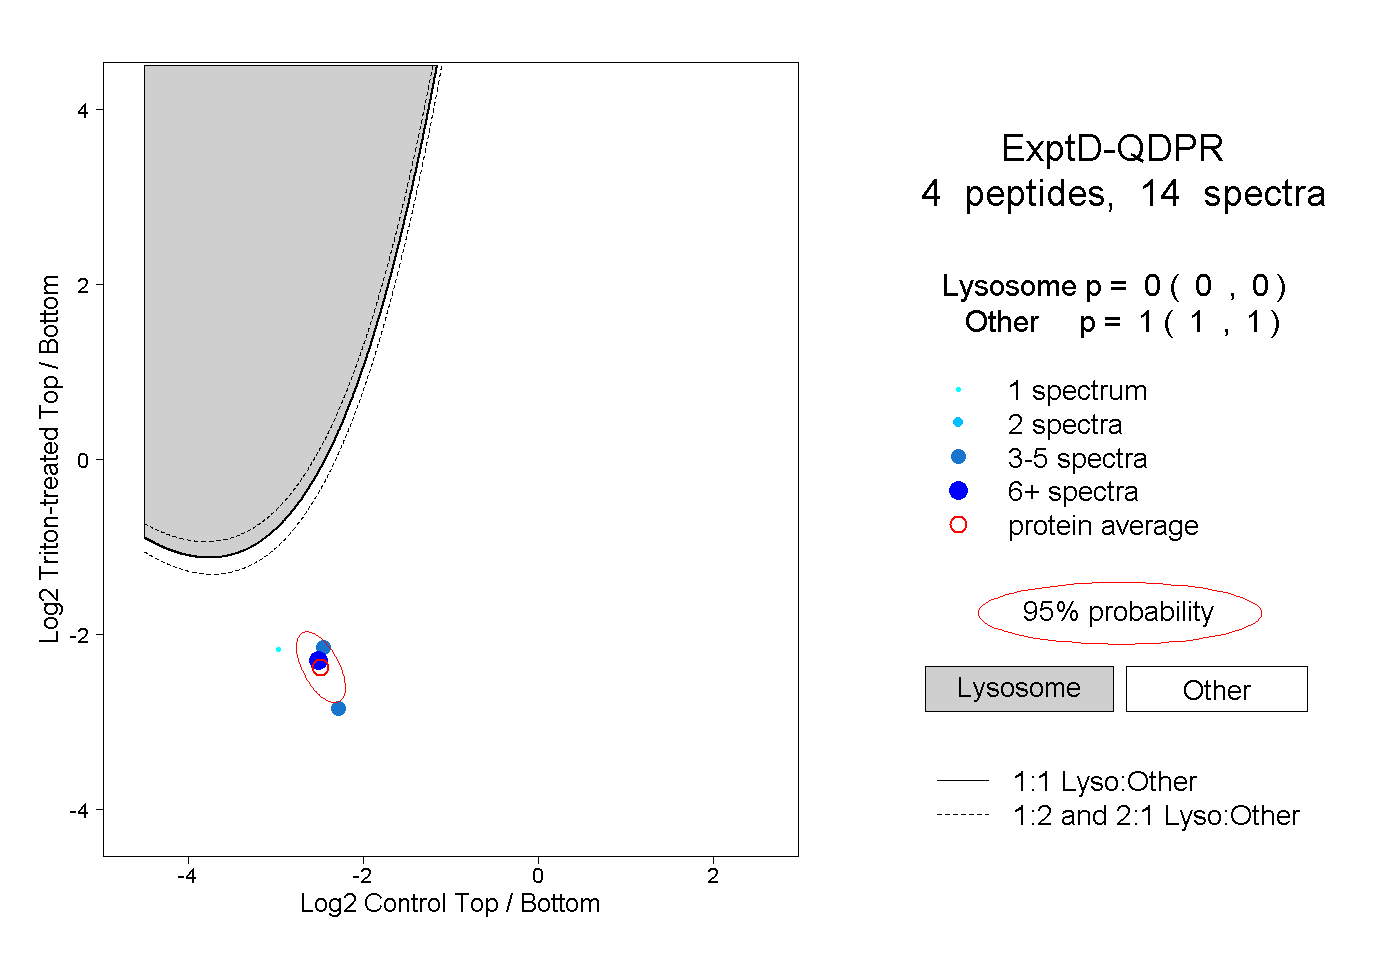 |
0.000 0.000 | 0.000 |
1.000 1.000 | 1.000 |