 13
13peptides
spectra
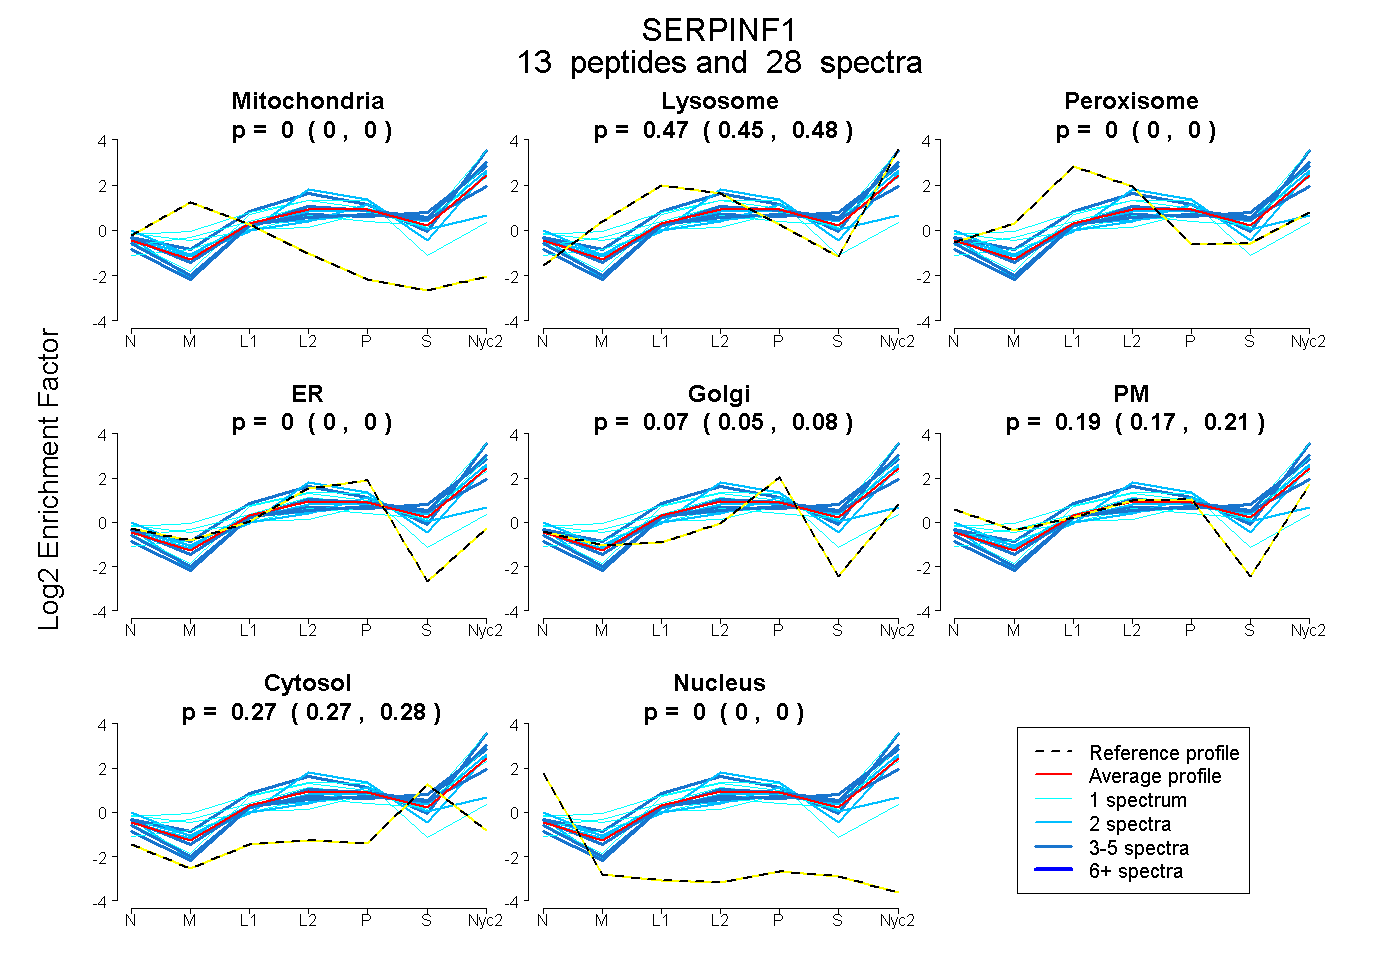
0.000 | 0.000
0.451 | 0.481
0.000 | 0.000
0.000 | 0.000
0.048 | 0.081
0.171 | 0.211
0.266 | 0.282
0.000 | 0.000
8peptides
spectra
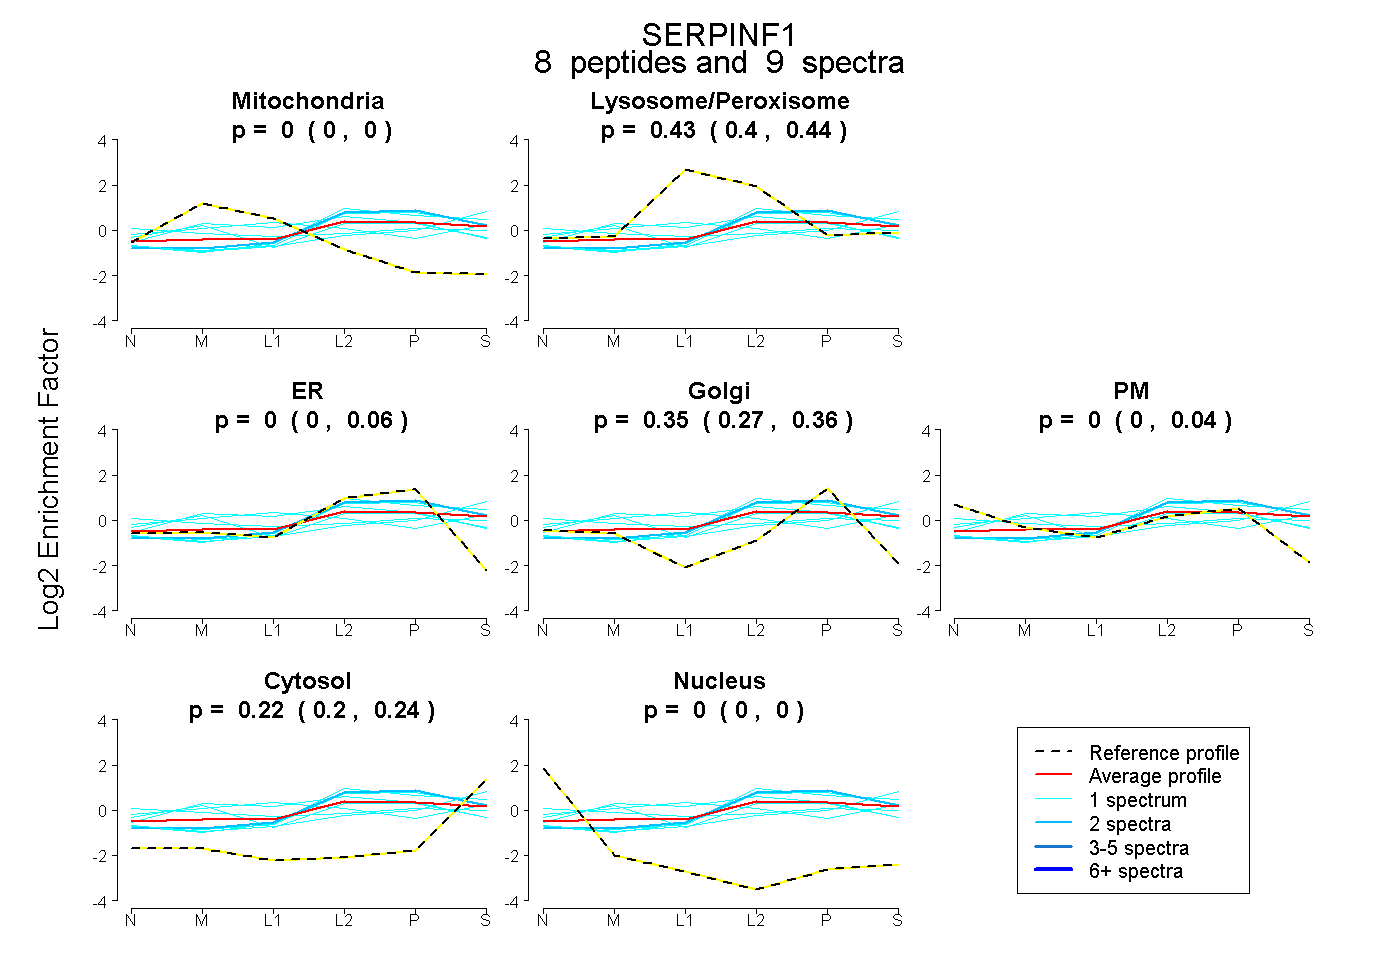
0.000 | 0.000
0.400 | 0.442
0.000 | 0.056
0.274 | 0.365
0.000 | 0.035
0.204 | 0.241
0.000 | 0.000
15peptides
spectra
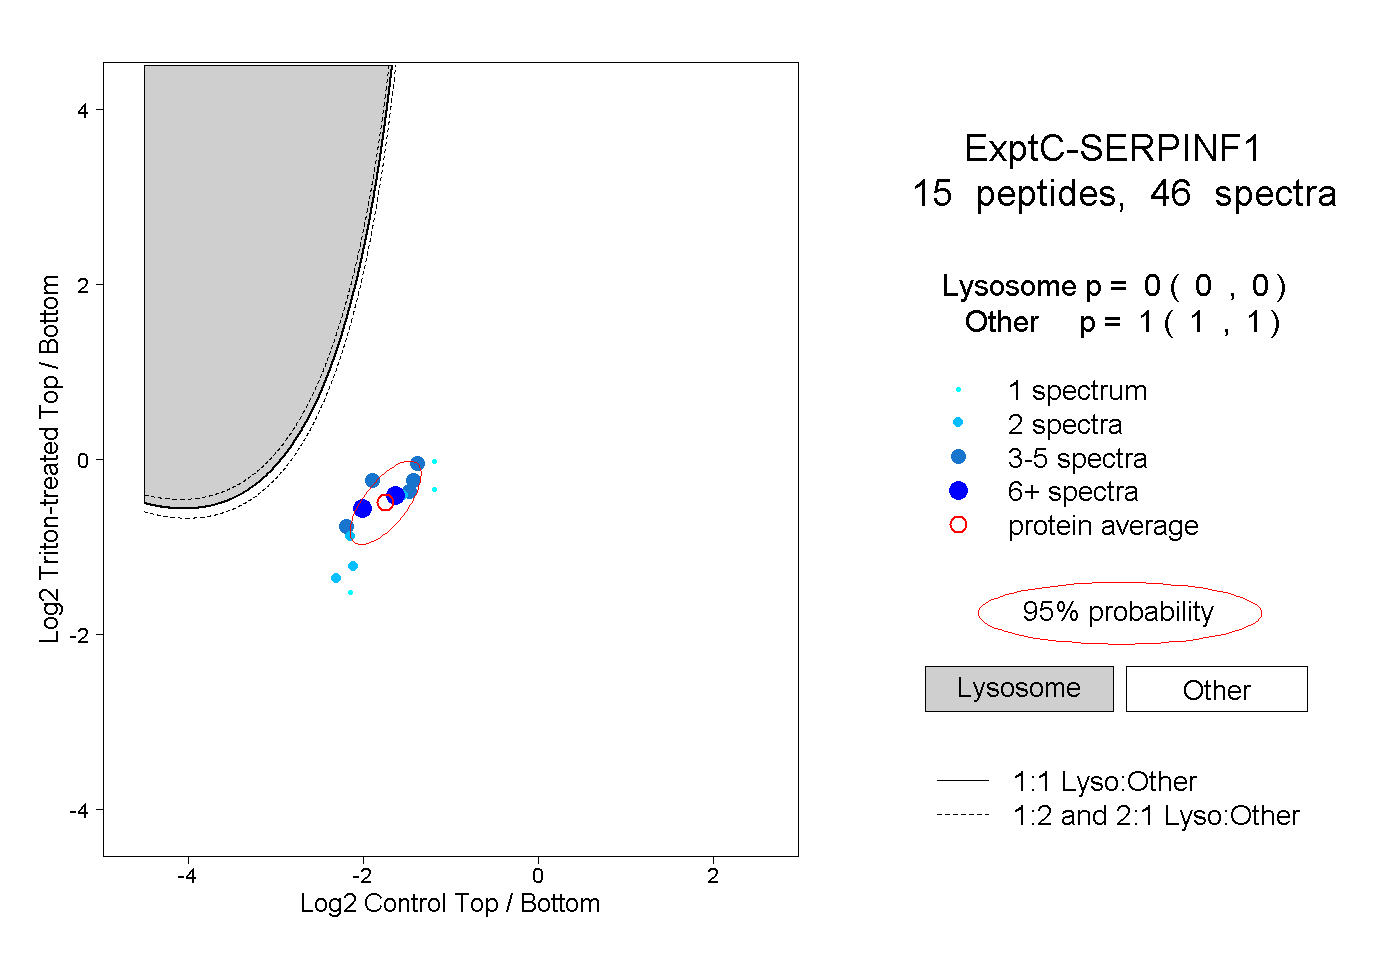
0.000 | 0.000
1.000 | 1.000
4peptides
spectra
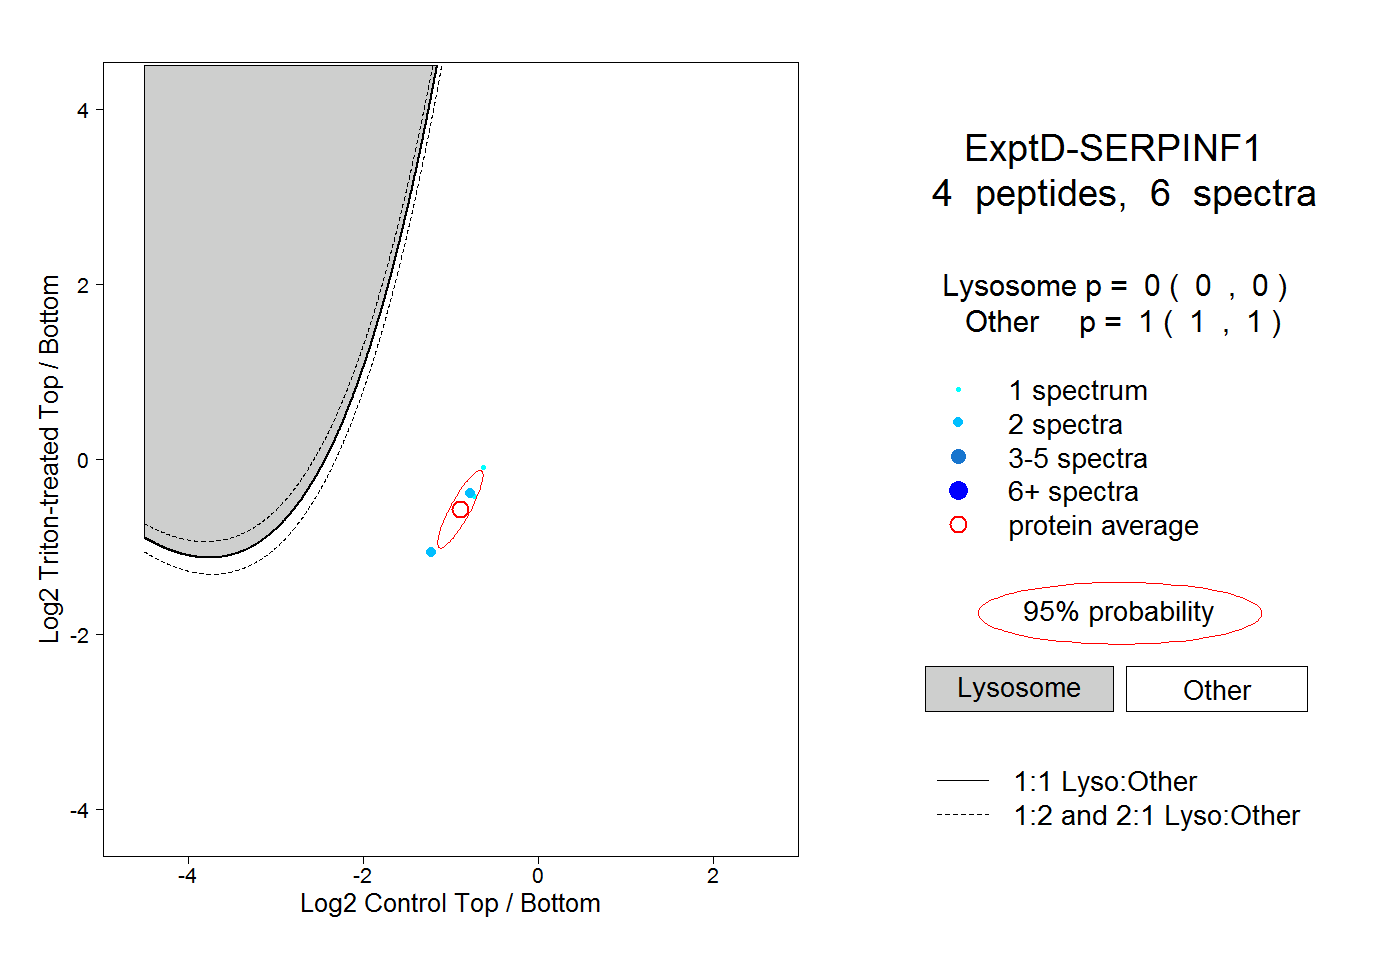
0.000 | 0.000
1.000 | 1.000