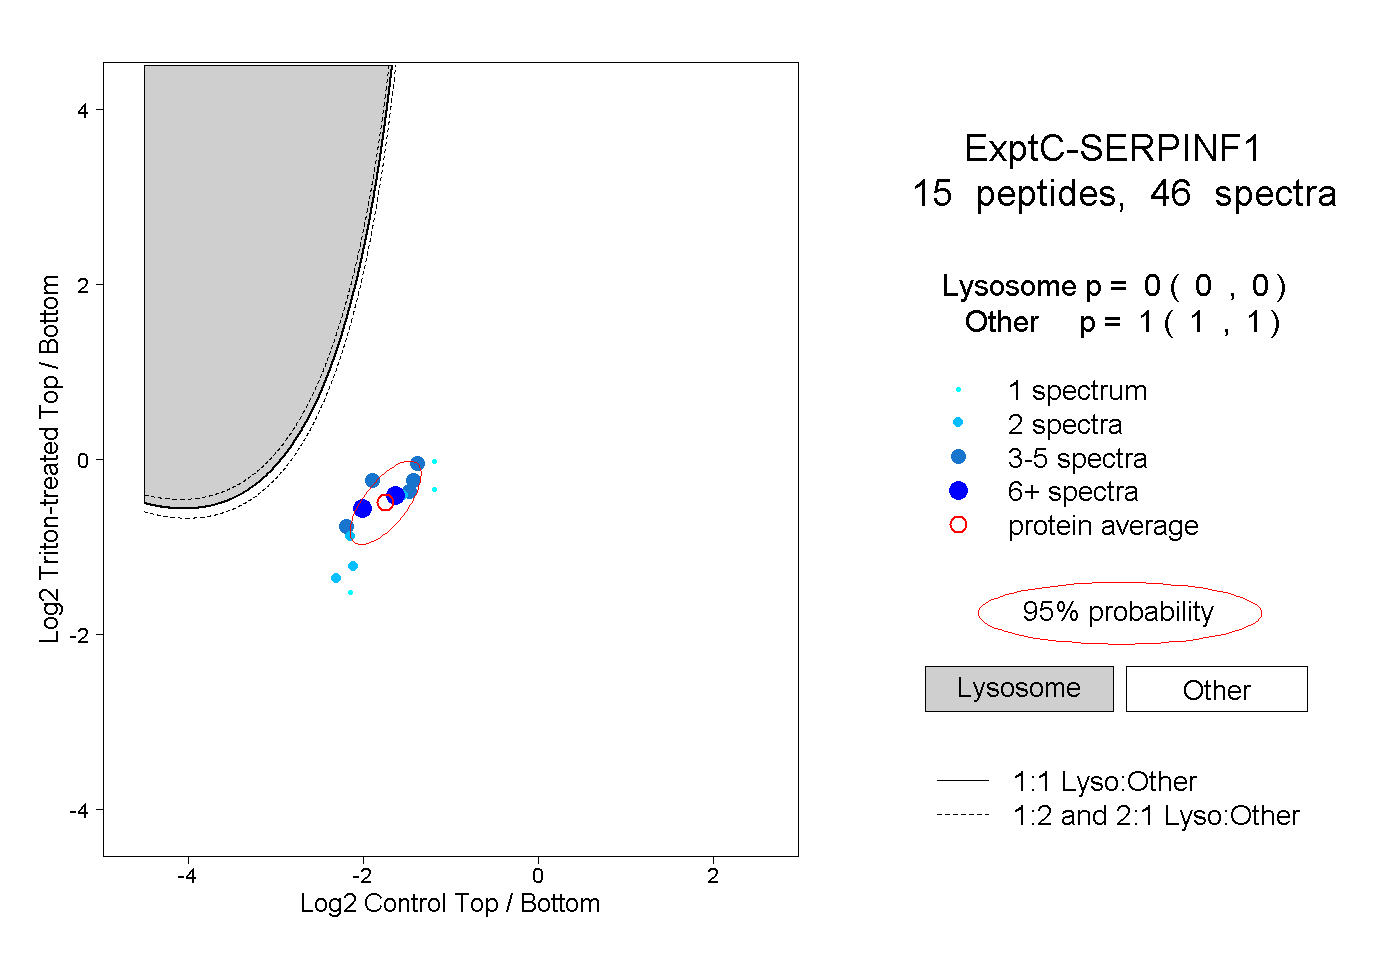
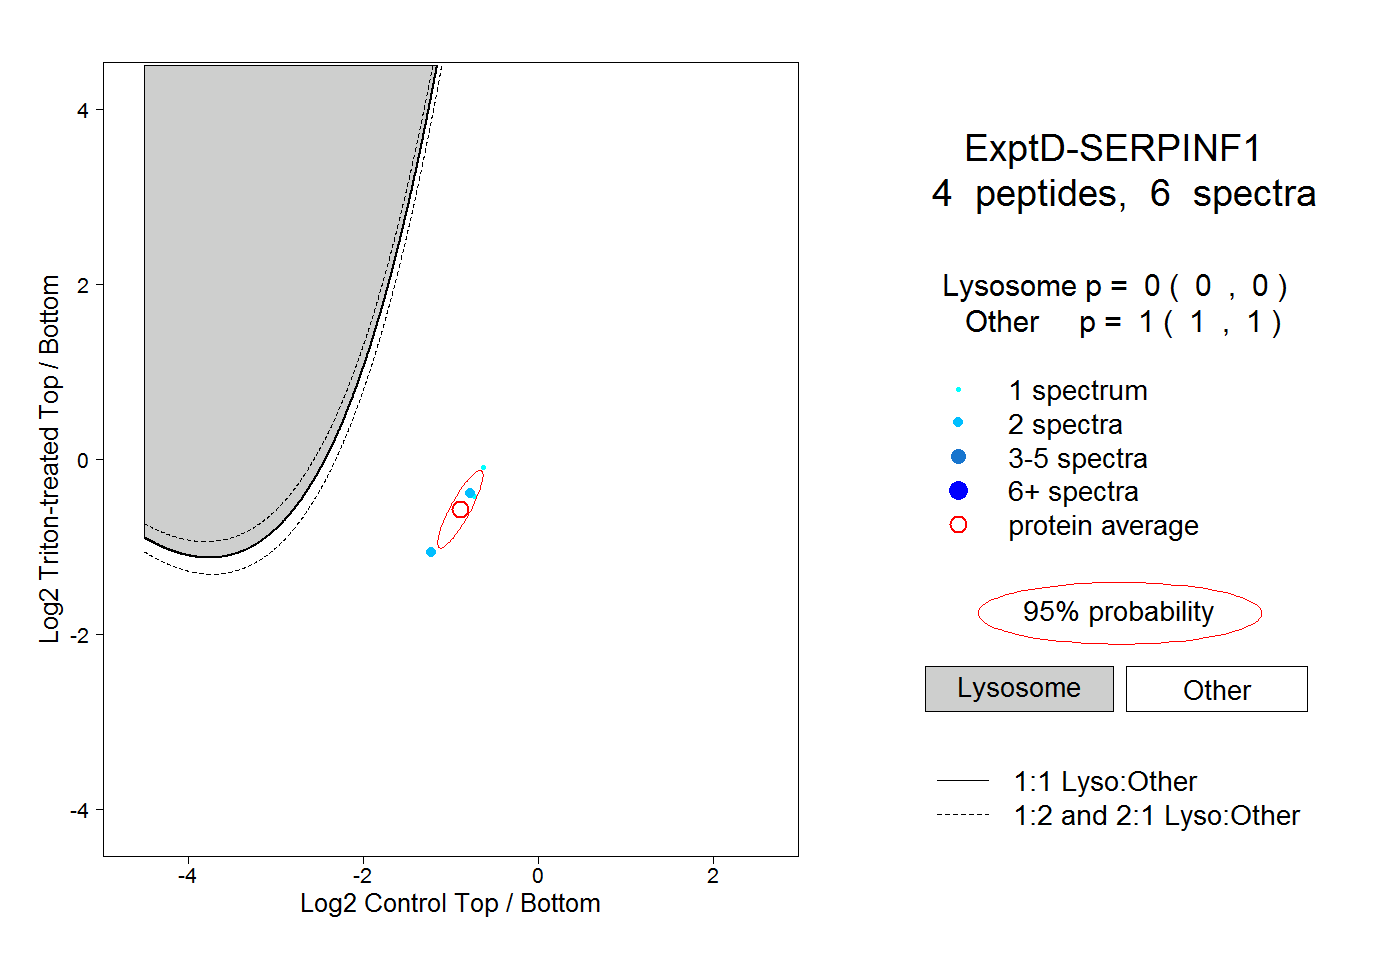
SERPINF1
[ENSRNOP00000004313]
Main page
| | | Plot |
Mito |
Lyso |
|
Perox |
ER |
Golgi |
PM |
Cytosol |
Nucleus |
|
| Expt A |
 13
13
peptides |
28
spectra |
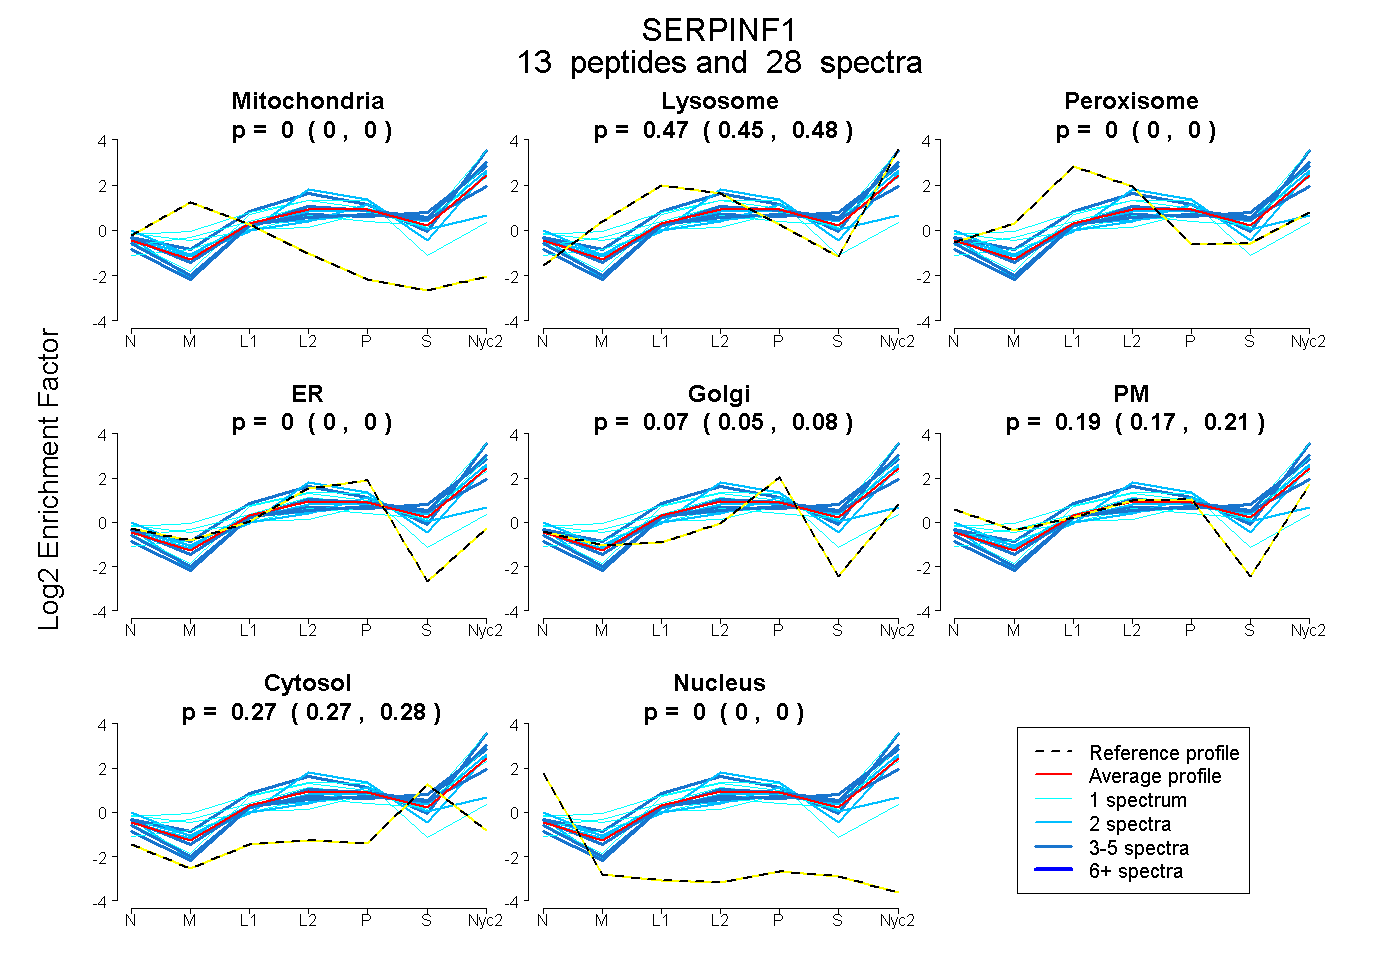 |
0.000
0.000 | 0.000 |
0.467
0.451 | 0.481 |
|
0.000
0.000 | 0.000 |
0.000
0.000 | 0.000 |
0.066
0.048 | 0.081 |
0.192
0.171 | 0.211 |
0.274
0.266 | 0.282 |
0.000
0.000 | 0.000 |
|
| | | Plot |
Mito |
|
Lyso or Perox |
|
ER |
Golgi |
PM |
Cytosol |
Nucleus |
|
| Expt B |
8
peptides |
9
spectra |
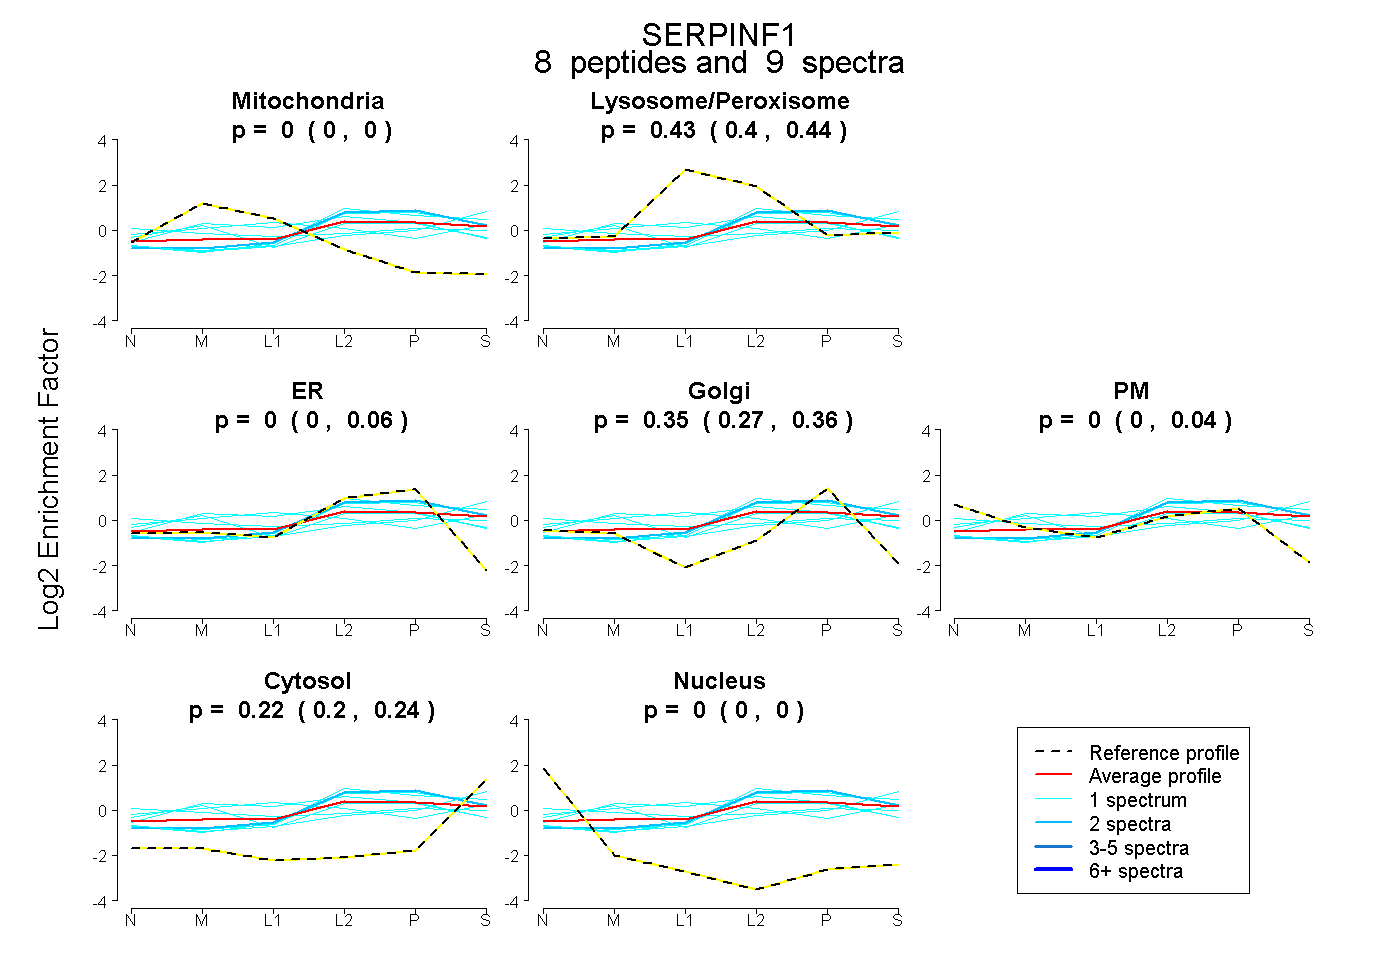 |
0.000
0.000 | 0.000 |
|
0.430
0.400 | 0.442 |
|
0.000
0.000 | 0.056 |
0.349
0.274 | 0.365 |
0.000
0.000 | 0.035 |
0.221
0.204 | 0.241 |
0.000
0.000 | 0.000 |
|
| 1 spectrum, SSFVAPLEK |
0.002 |
|
0.297 |
|
0.000 |
0.293 |
0.240 |
0.168 |
0.000 |
|
| 2 spectra, TTLQDFHLDEDR |
0.000 |
|
0.264 |
|
0.462 |
0.000 |
0.000 |
0.274 |
0.000 |
|
| 1 spectrum, DTDTGALLFIGR |
0.000 |
|
0.263 |
|
0.000 |
0.005 |
0.469 |
0.264 |
0.000 |
|
| 1 spectrum, ELLASVTAPEK |
0.087 |
|
0.421 |
|
0.000 |
0.000 |
0.222 |
0.270 |
0.000 |
|
| 1 spectrum, ILTGNPR |
0.000 |
|
0.305 |
|
0.392 |
0.000 |
0.000 |
0.304 |
0.000 |
|
| 1 spectrum, LQSLFESPDFSK |
0.000 |
|
0.251 |
|
0.454 |
0.000 |
0.000 |
0.295 |
0.000 |
|
| 1 spectrum, LTQVEHR |
0.063 |
|
0.489 |
|
0.000 |
0.373 |
0.000 |
0.075 |
0.000 |
|
| 1 spectrum, YGLDSDLNCK |
0.000 |
|
0.342 |
|
0.000 |
0.219 |
0.000 |
0.439 |
0.000 |
|
| | | Plot |
|
Lyso |
|
|
|
|
|
|
|
Other |
| Expt C |
15
peptides |
46
spectra |
 |
|
0.000
0.000 | 0.000 |
|
|
|
|
|
|
|
1.000
1.000 | 1.000 |
| | | Plot |
|
Lyso |
|
|
|
|
|
|
|
Other |
| Expt D |
4
peptides |
6
spectra |
 |
|
0.000
0.000 | 0.000 |
|
|
|
|
|
|
|
1.000
1.000 | 1.000 |