 13
13peptides
spectra
0.000 | 0.000
0.451 | 0.481
0.000 | 0.000
0.000 | 0.000
0.048 | 0.081
0.171 | 0.211
0.266 | 0.282
0.000 | 0.000
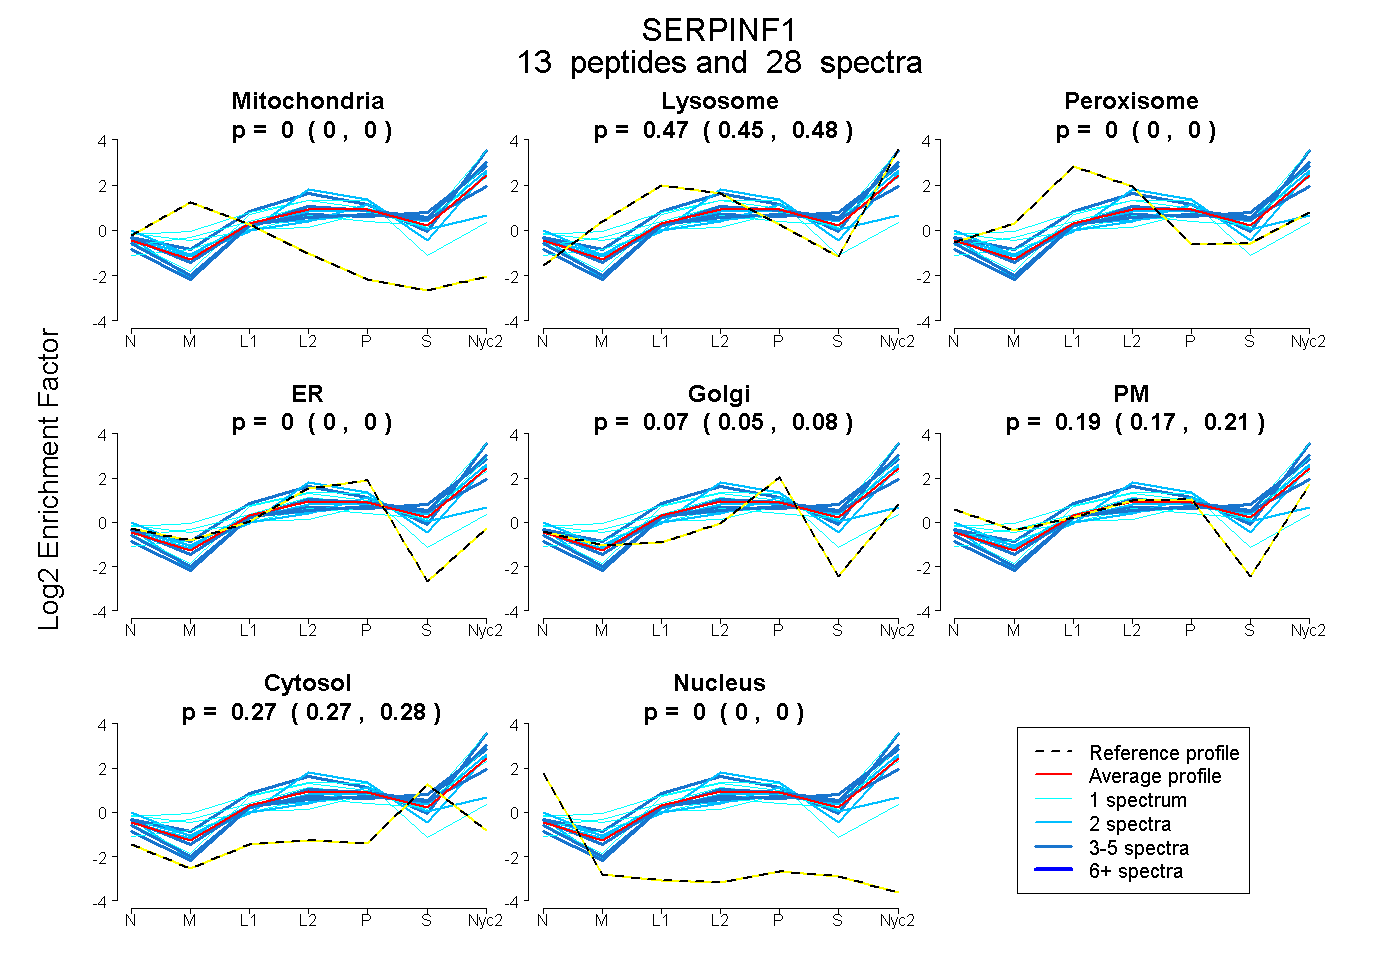
| Plot | Mito | Lyso | Perox | ER | Golgi | PM | Cytosol | Nucleus | |||||
| Expt A |
13 peptides |
28 spectra |
|
0.000 0.000 | 0.000 |
0.467 0.451 | 0.481 |
0.000 0.000 | 0.000 |
0.000 0.000 | 0.000 |
0.066 0.048 | 0.081 |
0.192 0.171 | 0.211 |
0.274 0.266 | 0.282 |
0.000 0.000 | 0.000 |
| 2 spectra, SYGTRPR | 0.000 | 0.331 | 0.000 | 0.000 | 0.047 | 0.496 | 0.126 | 0.000 | ||
| 2 spectra, TESVIHR | 0.000 | 0.093 | 0.196 | 0.026 | 0.393 | 0.000 | 0.292 | 0.000 | ||
| 4 spectra, TTLQDFHLDEDR | 0.000 | 0.560 | 0.000 | 0.000 | 0.091 | 0.042 | 0.308 | 0.000 | ||
| 1 spectrum, LSYEGDVTNSLQDMK | 0.000 | 0.515 | 0.000 | 0.000 | 0.133 | 0.000 | 0.352 | 0.000 | ||
| 2 spectra, DTDTGALLFIGR | 0.000 | 0.467 | 0.000 | 0.000 | 0.002 | 0.196 | 0.336 | 0.000 | ||
| 2 spectra, ELLASVTAPEK | 0.000 | 0.480 | 0.000 | 0.000 | 0.025 | 0.193 | 0.303 | 0.000 | ||
| 4 spectra, ILTGNPR | 0.000 | 0.660 | 0.000 | 0.000 | 0.000 | 0.244 | 0.096 | 0.000 | ||
| 1 spectrum, LQSLFESPDFSK | 0.000 | 0.000 | 0.408 | 0.329 | 0.253 | 0.000 | 0.010 | 0.000 | ||
| 1 spectrum, IVFER | 0.000 | 0.673 | 0.000 | 0.000 | 0.016 | 0.077 | 0.234 | 0.000 | ||
| 1 spectrum, TIQAVLTVPK | 0.000 | 0.630 | 0.000 | 0.000 | 0.063 | 0.118 | 0.190 | 0.000 | ||
| 3 spectra, LAAAVSNFGYDLYR | 0.000 | 0.556 | 0.000 | 0.000 | 0.046 | 0.000 | 0.398 | 0.000 | ||
| 4 spectra, YGLDSDLNCK | 0.000 | 0.374 | 0.000 | 0.000 | 0.000 | 0.248 | 0.378 | 0.000 | ||
| 1 spectrum, LTQVEHR | 0.000 | 0.427 | 0.000 | 0.000 | 0.000 | 0.288 | 0.285 | 0.000 |
| Plot | Mito | Lyso or Perox | ER | Golgi | PM | Cytosol | Nucleus | ||||||
| Expt B |
8 peptides |
9 spectra |
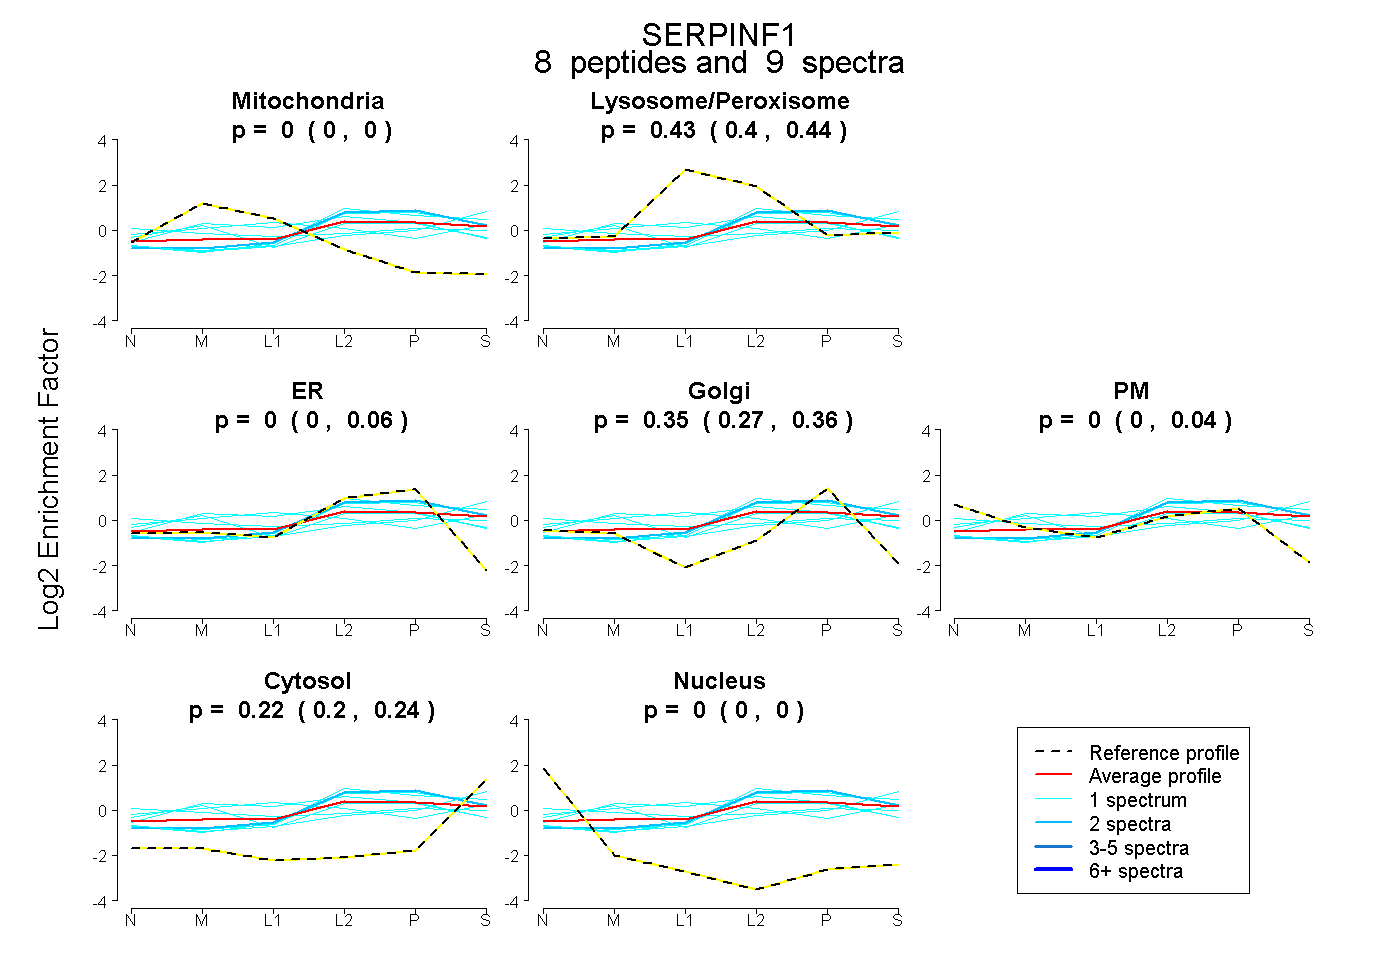 |
0.000 0.000 | 0.000 |
0.430 0.400 | 0.442 |
0.000 0.000 | 0.056 |
0.349 0.274 | 0.365 |
0.000 0.000 | 0.035 |
0.221 0.204 | 0.241 |
0.000 0.000 | 0.000 |
|||
| Plot | Lyso | Other | |||||||||||
| Expt C |
15 peptides |
46 spectra |
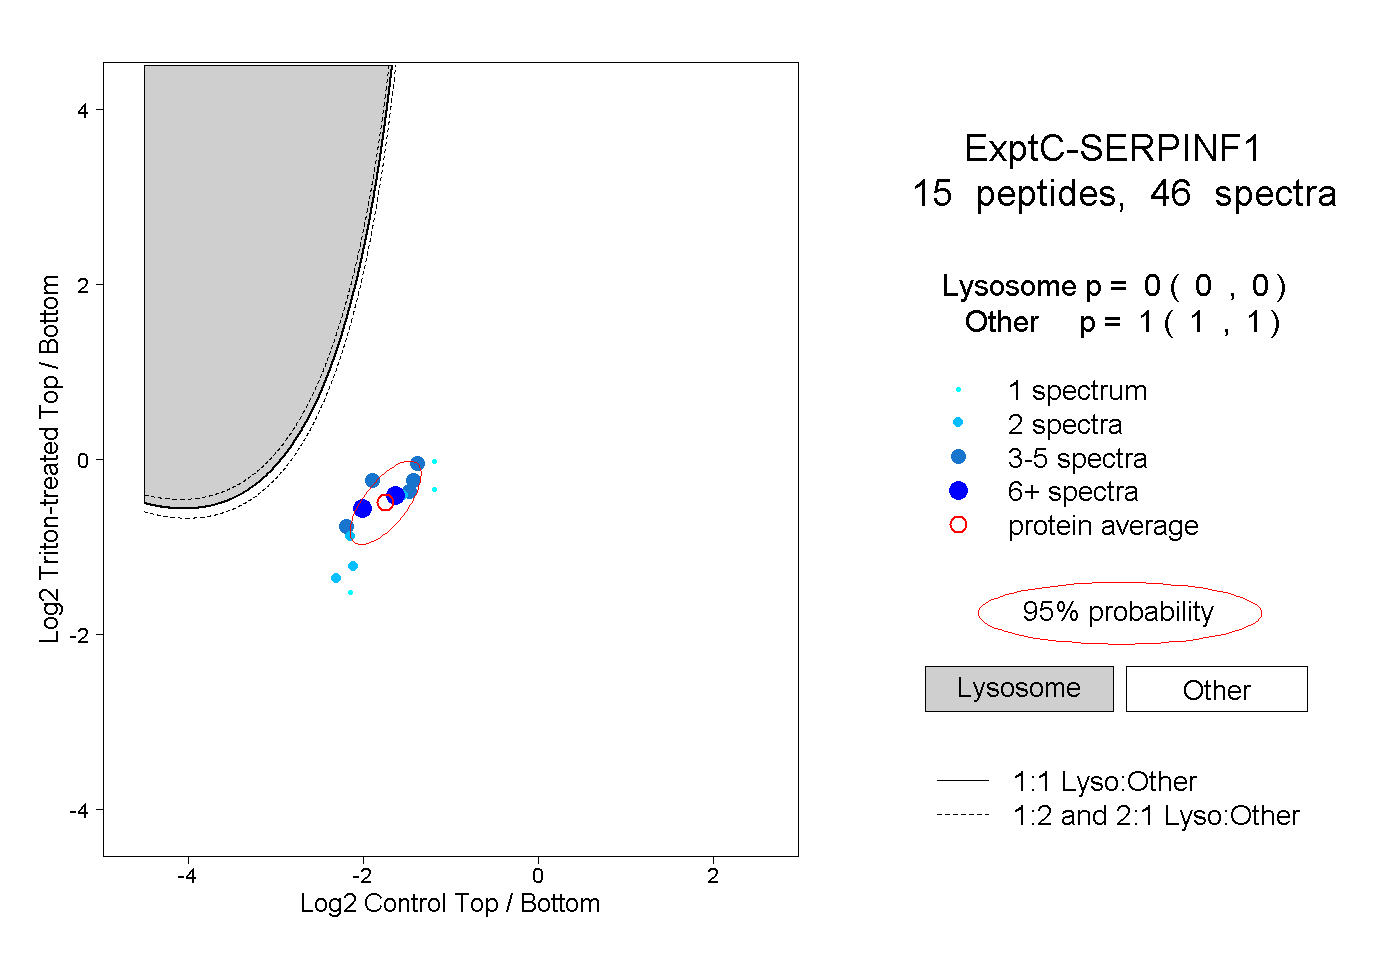 |
0.000 0.000 | 0.000 |
1.000 1.000 | 1.000 |
||||||||
| Plot | Lyso | Other | |||||||||||
| Expt D |
4 peptides |
6 spectra |
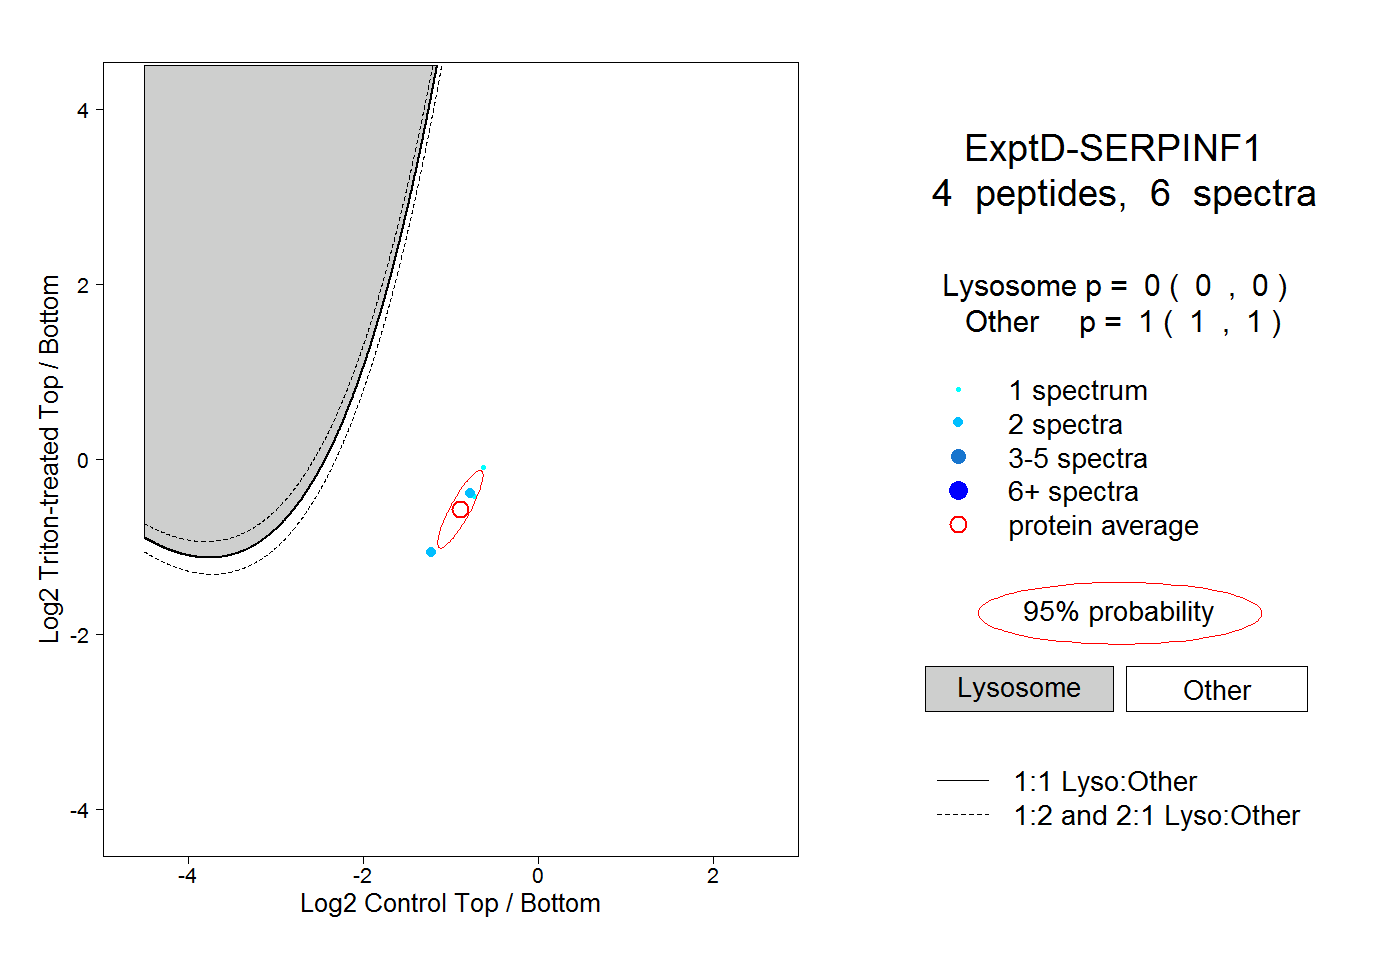 |
0.000 0.000 | 0.000 |
1.000 1.000 | 1.000 |