 4
4peptides
spectra
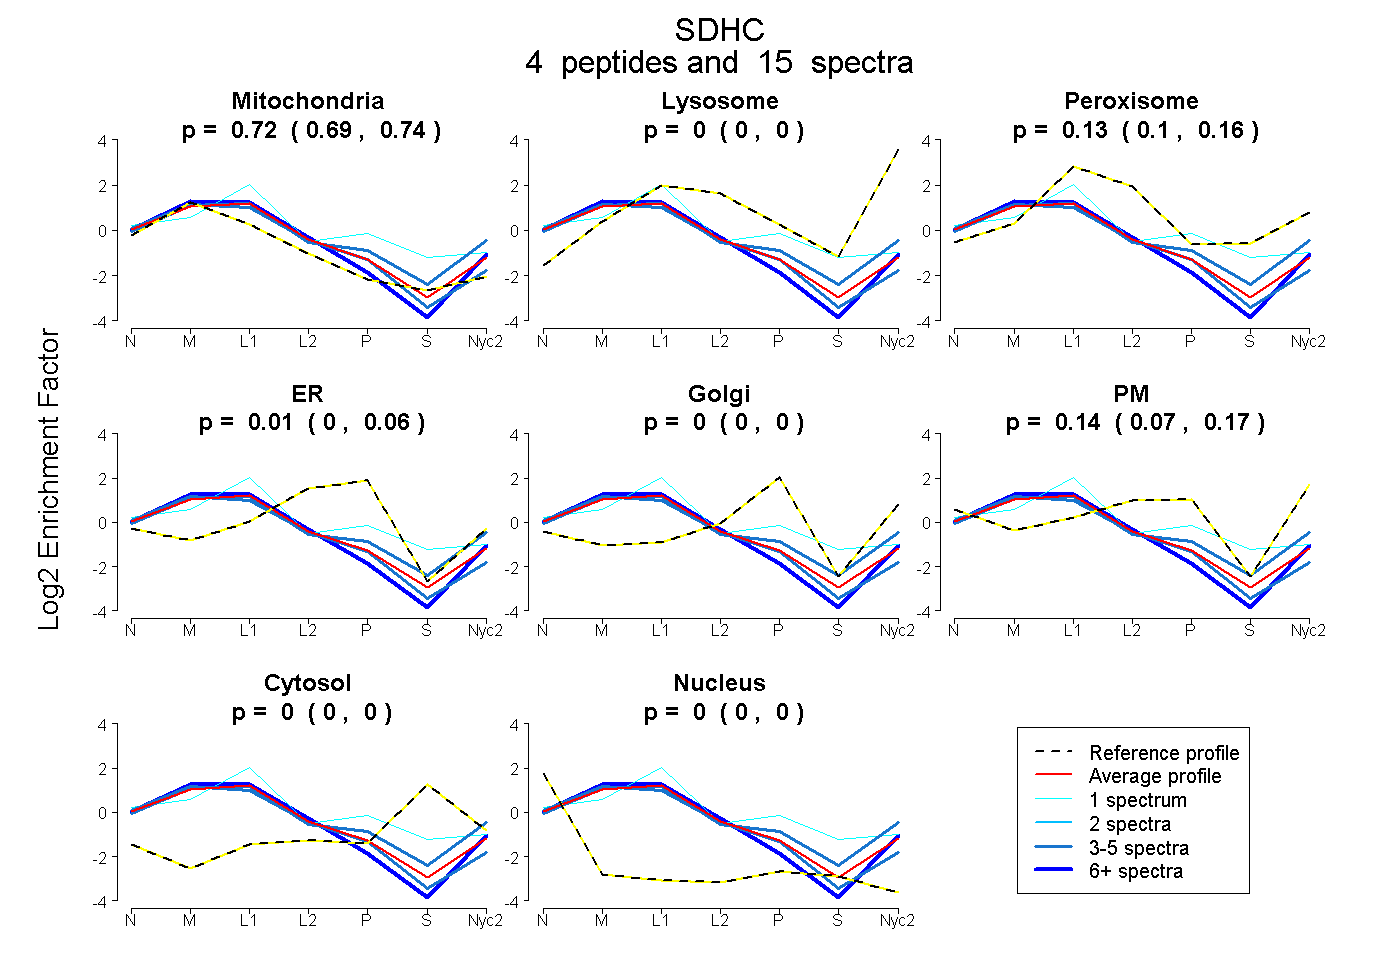
0.692 | 0.737
0.000 | 0.000
0.098 | 0.164
0.000 | 0.061
0.000 | 0.000
0.074 | 0.170
0.000 | 0.000
0.000 | 0.000
2peptides
spectra
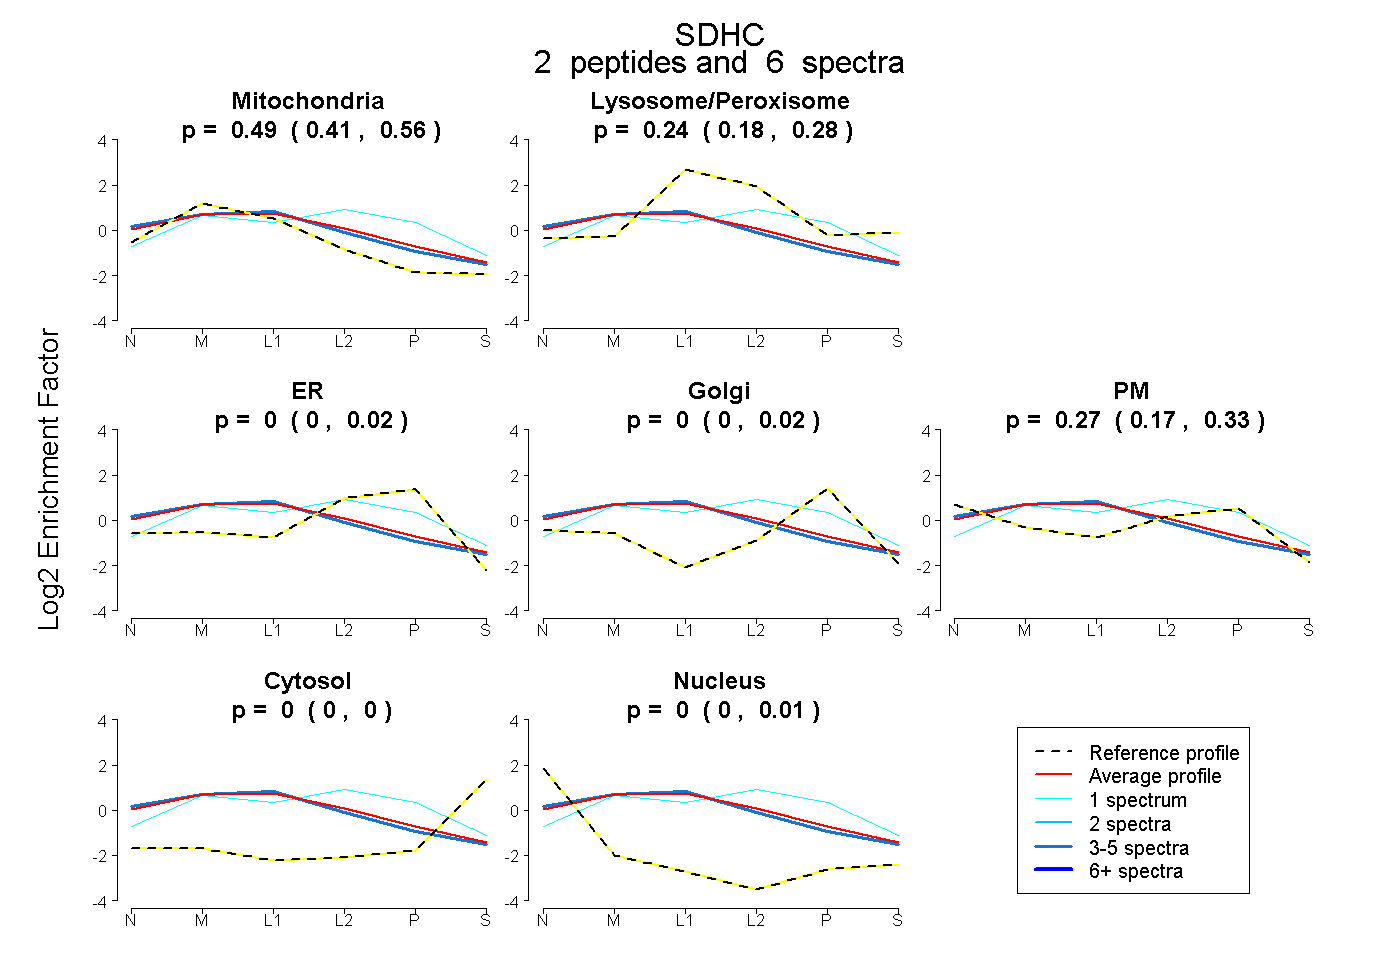
0.408 | 0.563
0.180 | 0.283
0.000 | 0.015
0.000 | 0.018
0.166 | 0.335
0.000 | 0.000
0.000 | 0.007
4peptides
spectra
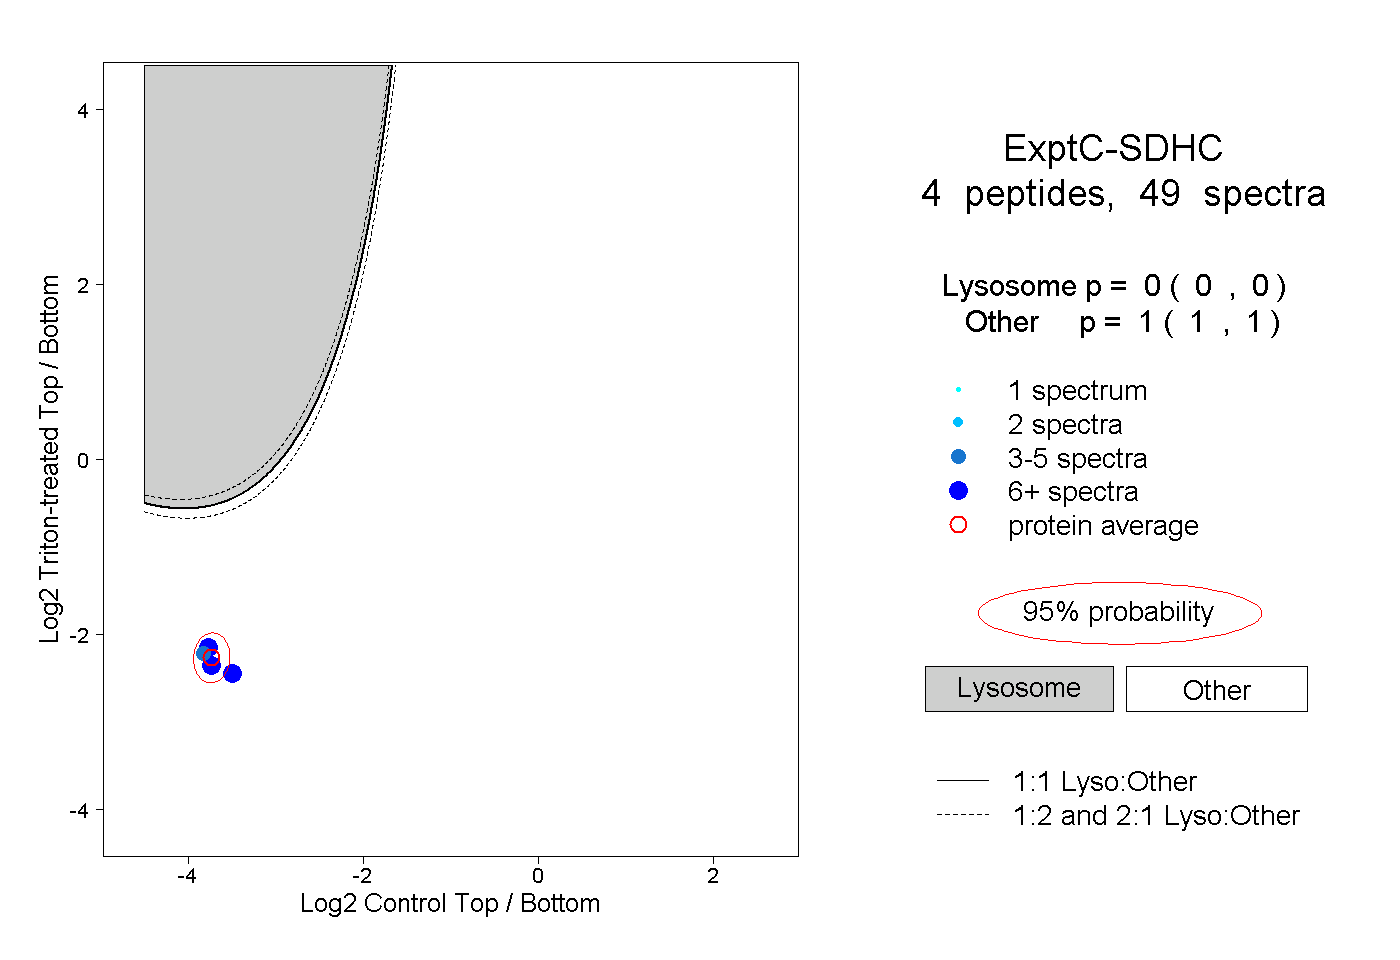
0.000 | 0.000
1.000 | 1.000
1peptide
spectra
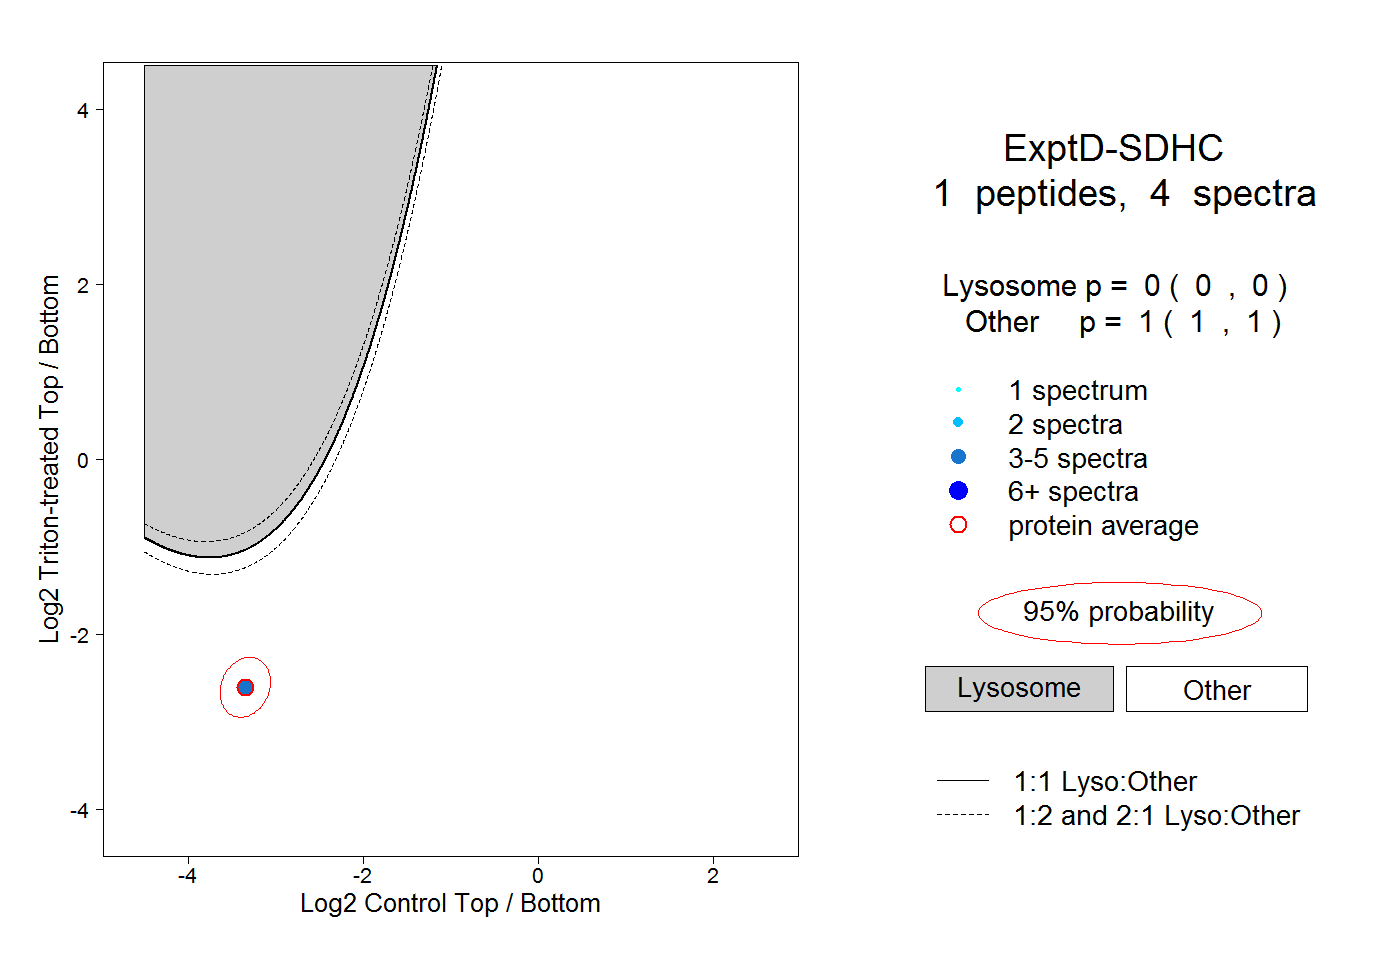
0.000 | 0.000
1.000 | 1.000