 4
4peptides
spectra
0.692 | 0.737
0.000 | 0.000
0.098 | 0.164
0.000 | 0.061
0.000 | 0.000
0.074 | 0.170
0.000 | 0.000
0.000 | 0.000
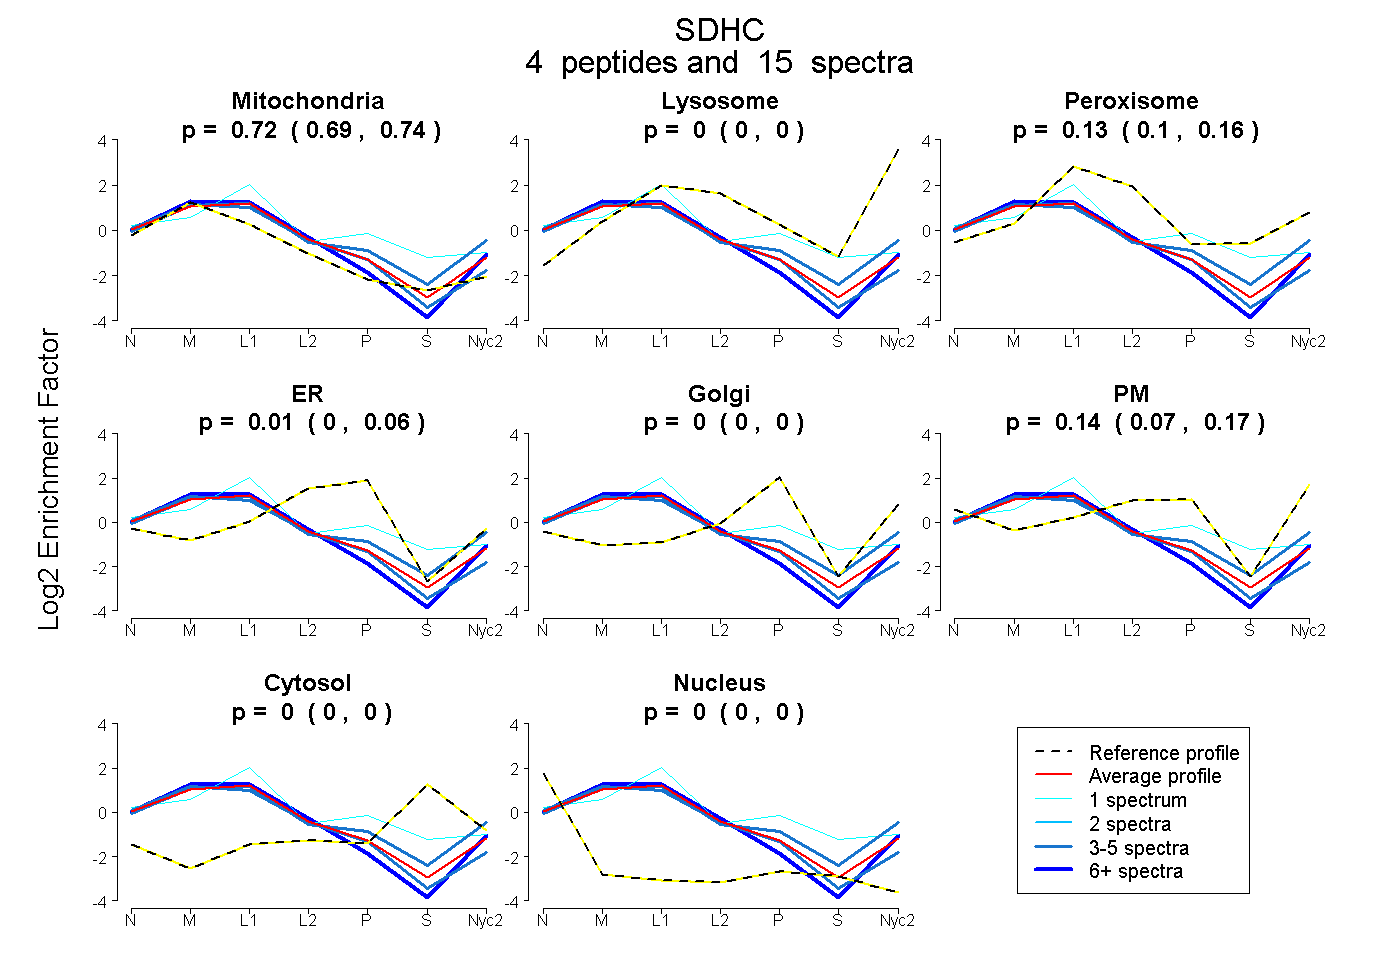
| Plot | Mito | Lyso | Perox | ER | Golgi | PM | Cytosol | Nucleus | |||||
| Expt A |
4 peptides |
15 spectra |
|
0.717 0.692 | 0.737 |
0.000 0.000 | 0.000 |
0.133 0.098 | 0.164 |
0.013 0.000 | 0.061 |
0.000 0.000 | 0.000 |
0.138 0.074 | 0.170 |
0.000 0.000 | 0.000 |
0.000 0.000 | 0.000 |
| 1 spectrum, NTSSNRPVSPHLTIYR | 0.402 | 0.000 | 0.460 | 0.000 | 0.112 | 0.000 | 0.000 | 0.027 | ||
| 3 spectra, WSLPMAMSVCHR | 0.622 | 0.105 | 0.095 | 0.000 | 0.000 | 0.177 | 0.000 | 0.000 | ||
| 6 spectra, HLMWDLGK | 0.806 | 0.055 | 0.025 | 0.000 | 0.000 | 0.114 | 0.000 | 0.000 | ||
| 5 spectra, SLCLGPALIHAAK | 0.813 | 0.000 | 0.022 | 0.165 | 0.000 | 0.000 | 0.000 | 0.000 |
| Plot | Mito | Lyso or Perox | ER | Golgi | PM | Cytosol | Nucleus | ||||||
| Expt B |
2 peptides |
6 spectra |
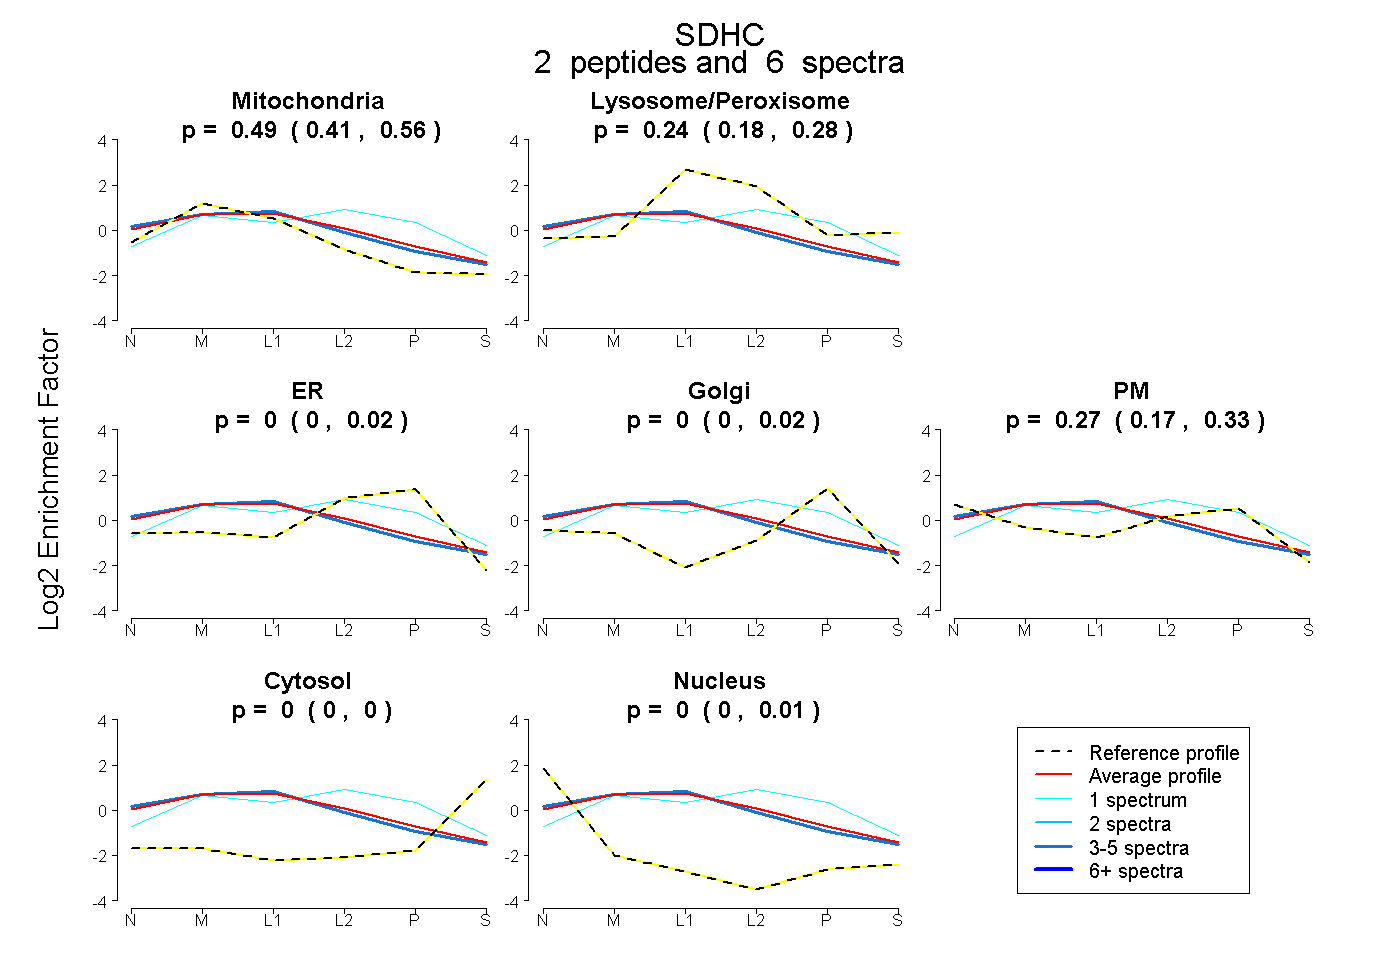 |
0.495 0.408 | 0.563 |
0.235 0.180 | 0.283 |
0.000 0.000 | 0.015 |
0.000 0.000 | 0.018 |
0.270 0.166 | 0.335 |
0.000 0.000 | 0.000 |
0.000 0.000 | 0.007 |
|||
| Plot | Lyso | Other | |||||||||||
| Expt C |
4 peptides |
49 spectra |
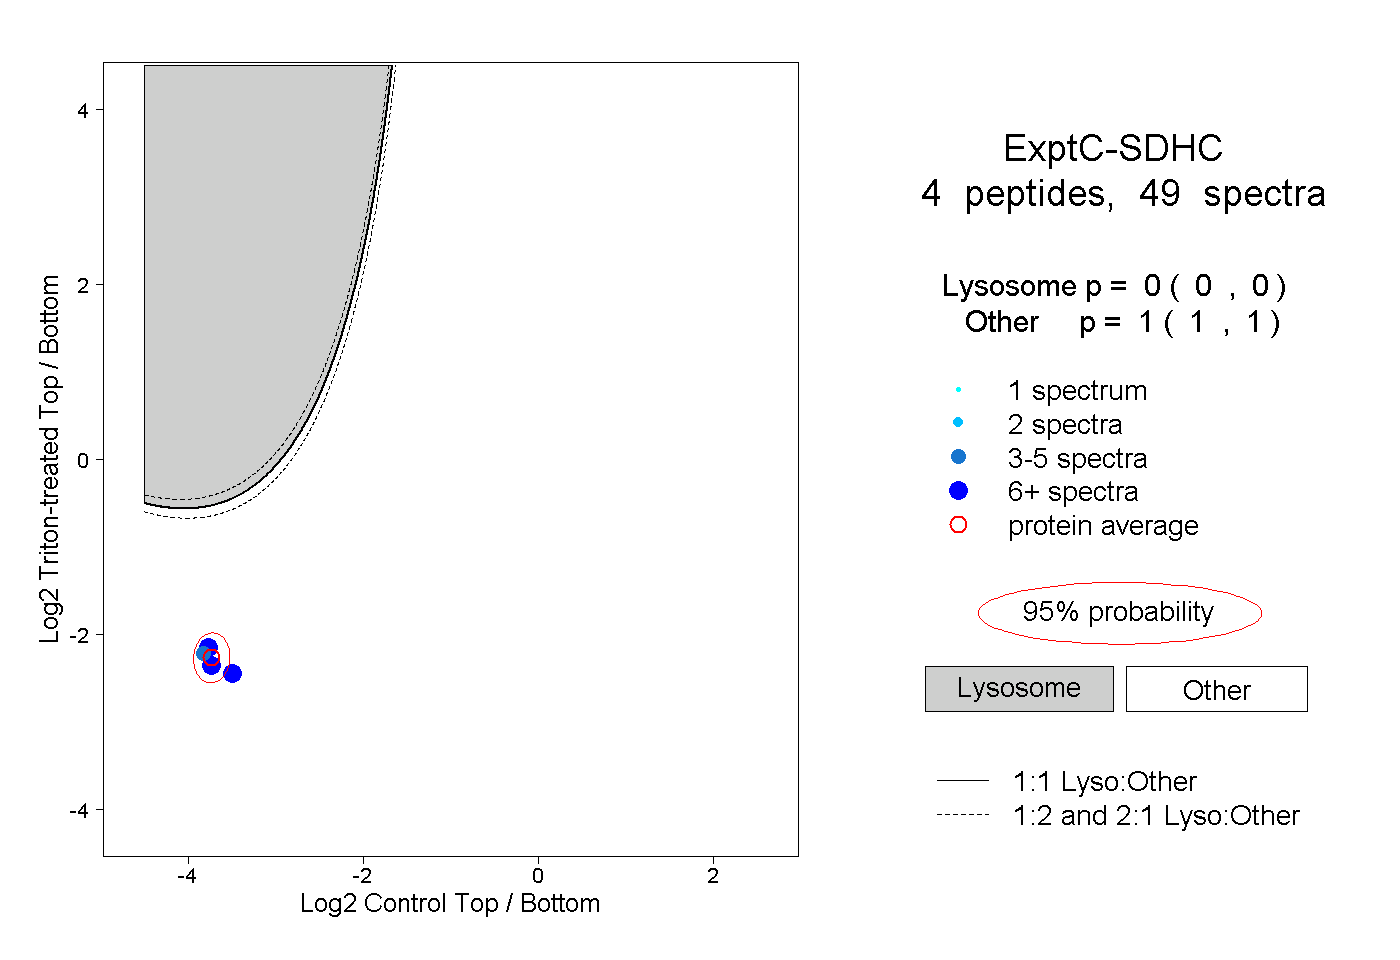 |
0.000 0.000 | 0.000 |
1.000 1.000 | 1.000 |
||||||||
| Plot | Lyso | Other | |||||||||||
| Expt D |
1 peptide |
4 spectra |
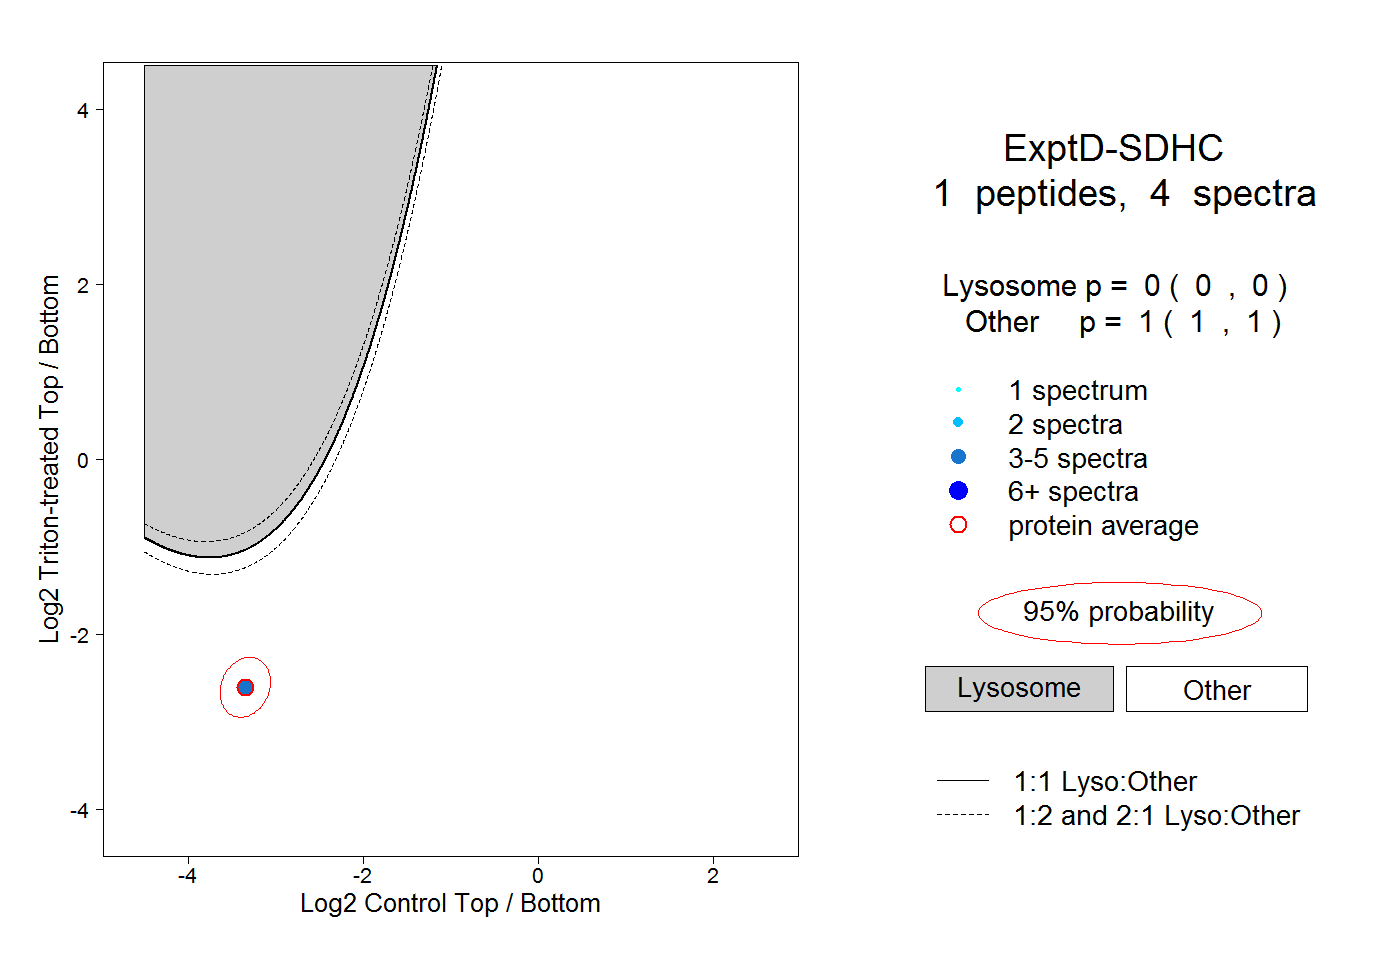 |
0.000 0.000 | 0.000 |
1.000 1.000 | 1.000 |