SDHC
[ENSRNOP00000004228]
Main page
| | | Plot |
Mito |
Lyso |
|
Perox |
ER |
Golgi |
PM |
Cytosol |
Nucleus |
|
| Expt A |
 4
4
peptides |
15
spectra |
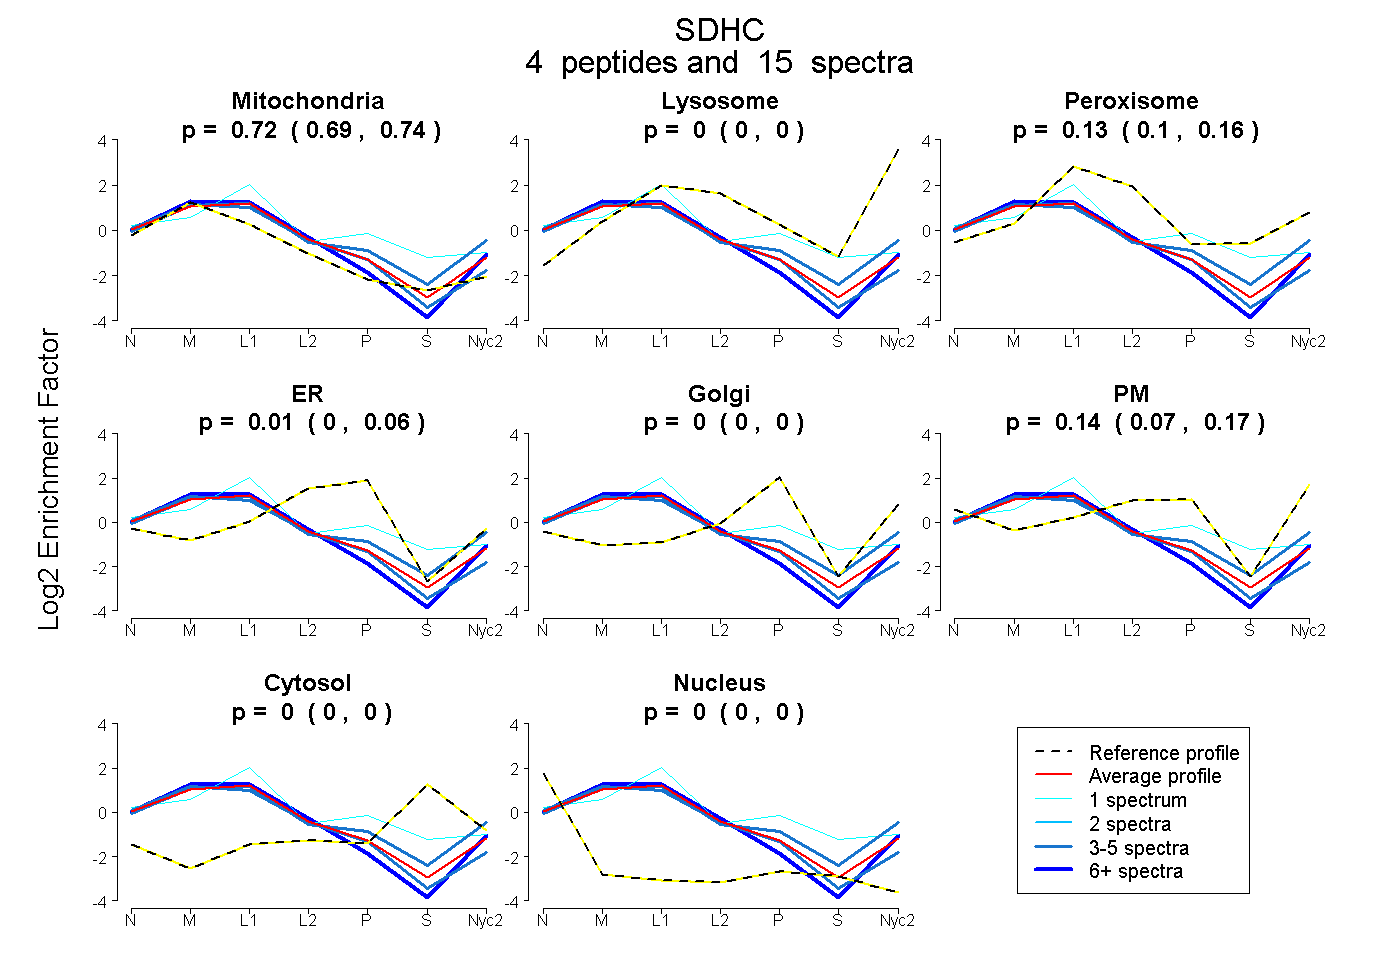 |
0.717
0.692 | 0.737 |
0.000
0.000 | 0.000 |
|
0.133
0.098 | 0.164 |
0.013
0.000 | 0.061 |
0.000
0.000 | 0.000 |
0.138
0.074 | 0.170 |
0.000
0.000 | 0.000 |
0.000
0.000 | 0.000 |
|
| | | Plot |
Mito |
|
Lyso or Perox |
|
ER |
Golgi |
PM |
Cytosol |
Nucleus |
|
| Expt B |
2
peptides |
6
spectra |
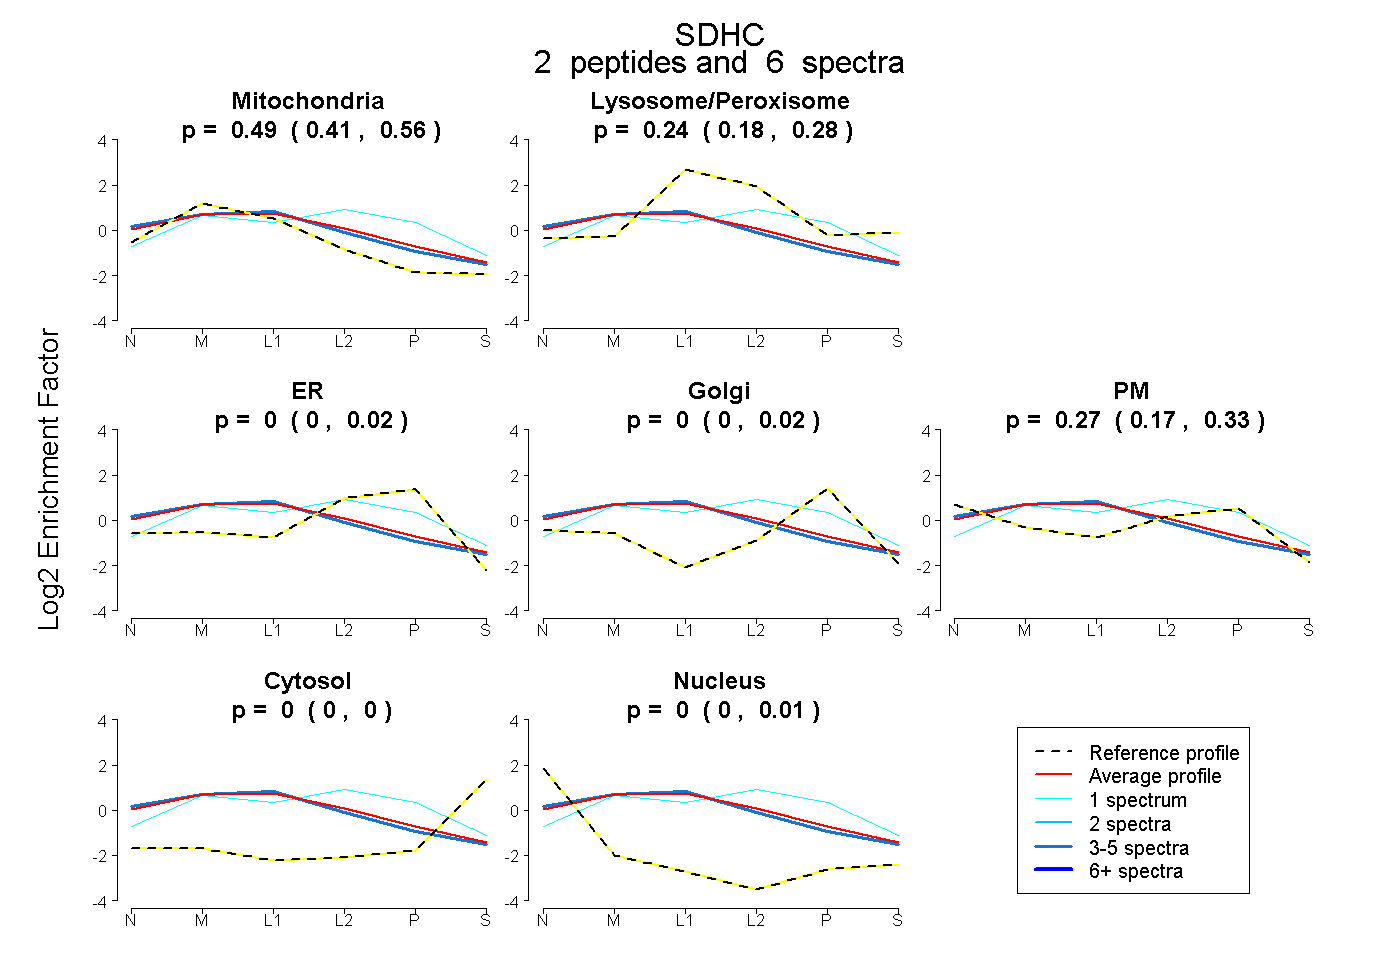 |
0.495
0.408 | 0.563 |
|
0.235
0.180 | 0.283 |
|
0.000
0.000 | 0.015 |
0.000
0.000 | 0.018 |
0.270
0.166 | 0.335 |
0.000
0.000 | 0.000 |
0.000
0.000 | 0.007 |
|
| 1 spectrum, HLMWDLGK |
0.234 |
|
0.314 |
|
0.395 |
0.058 |
0.000 |
0.000 |
0.000 |
|
| 5 spectra, SLCLGPALIHAAK |
0.553 |
|
0.215 |
|
0.000 |
0.000 |
0.226 |
0.000 |
0.006 |
|
| | | Plot |
|
Lyso |
|
|
|
|
|
|
|
Other |
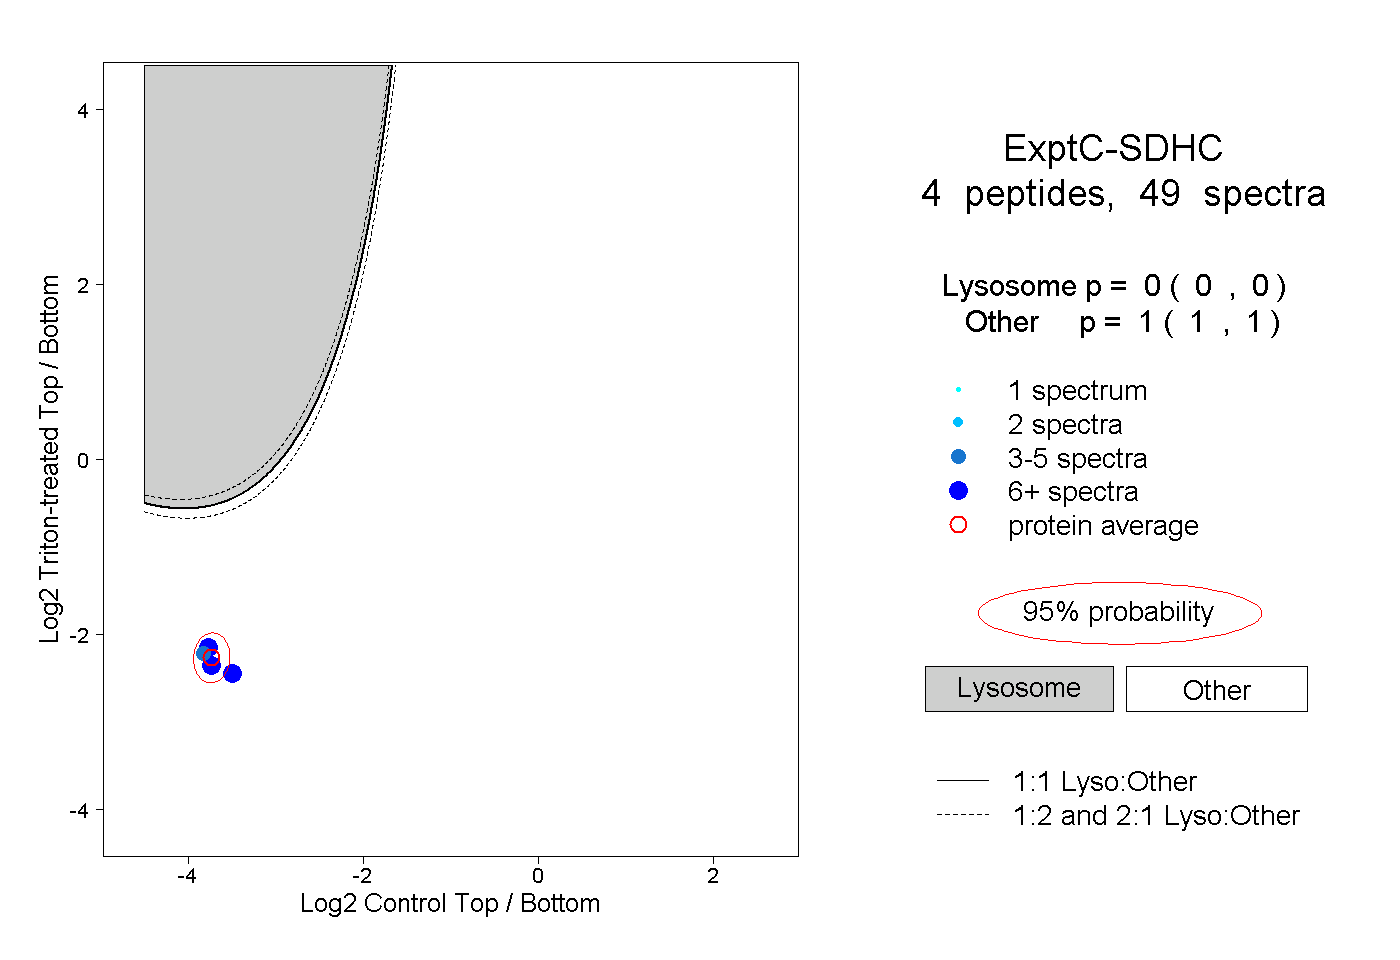
| Expt C |
4
peptides |
49
spectra |
 |
|
0.000
0.000 | 0.000 |
|
|
|
|
|
|
|
1.000
1.000 | 1.000 |
| | | Plot |
|
Lyso |
|
|
|
|
|
|
|
Other |
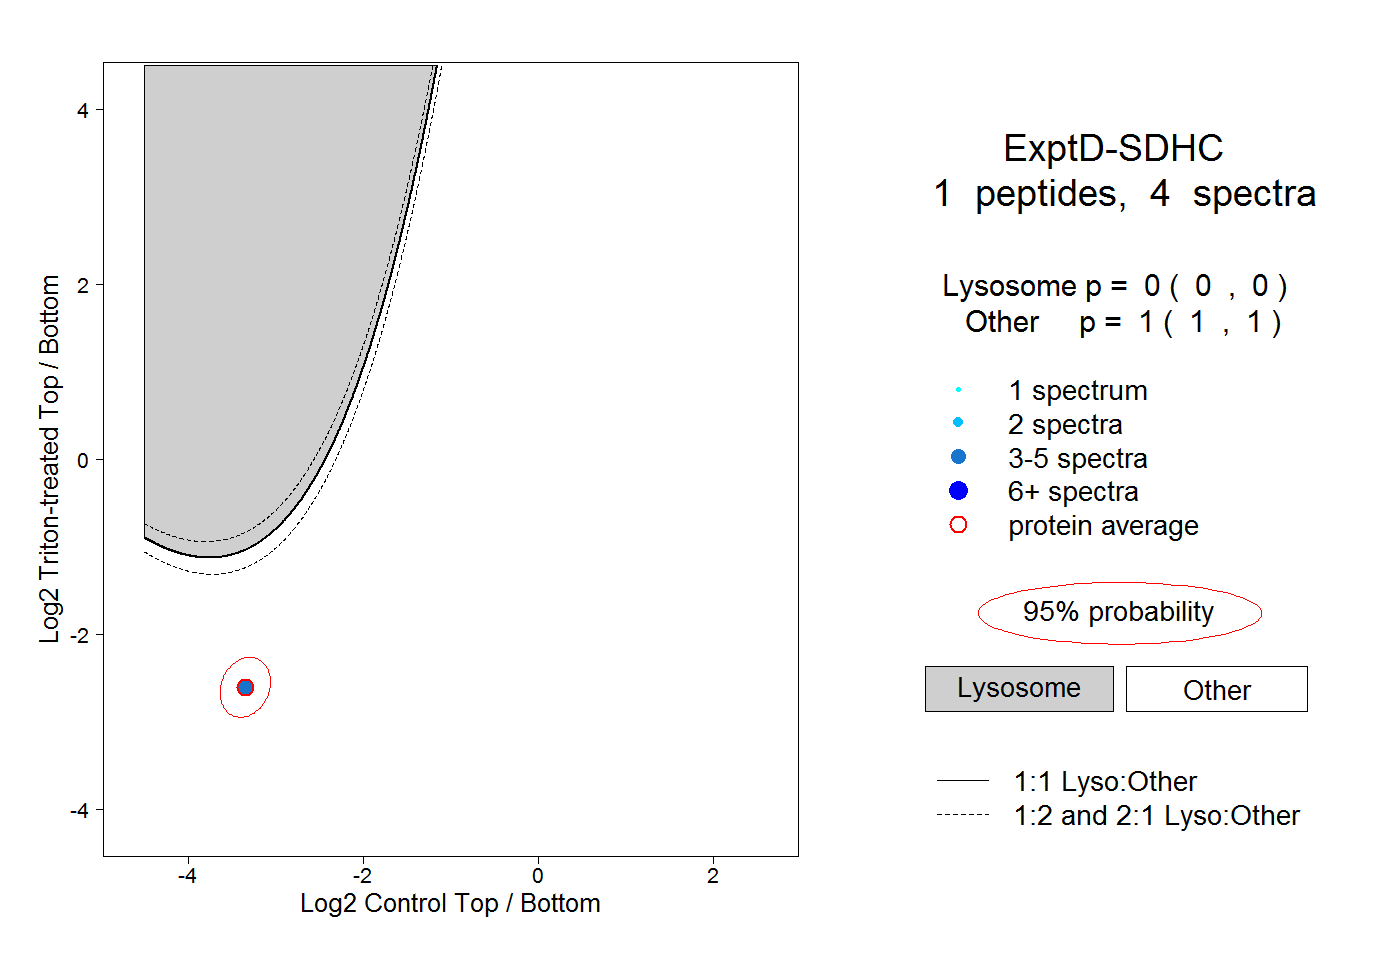
| Expt D |
1
peptide |
4
spectra |
 |
|
0.000
0.000 | 0.000 |
|
|
|
|
|
|
|
1.000
1.000 | 1.000 |