 7
7peptides
spectra
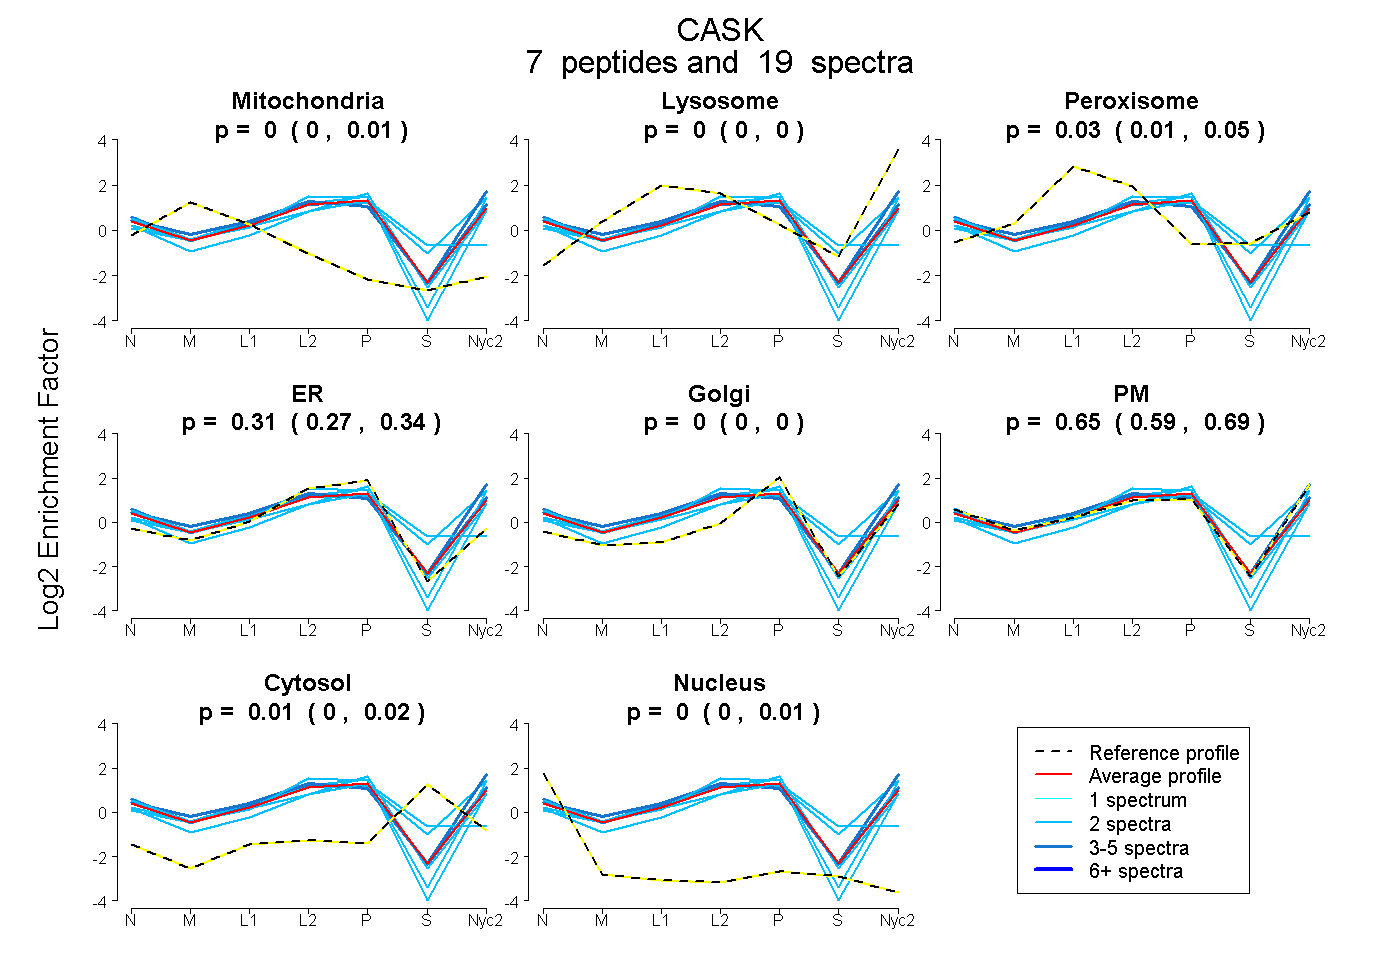
0.000 | 0.008
0.000 | 0.000
0.009 | 0.046
0.266 | 0.341
0.000 | 0.004
0.595 | 0.689
0.000 | 0.023
0.000 | 0.011
4peptides
spectra
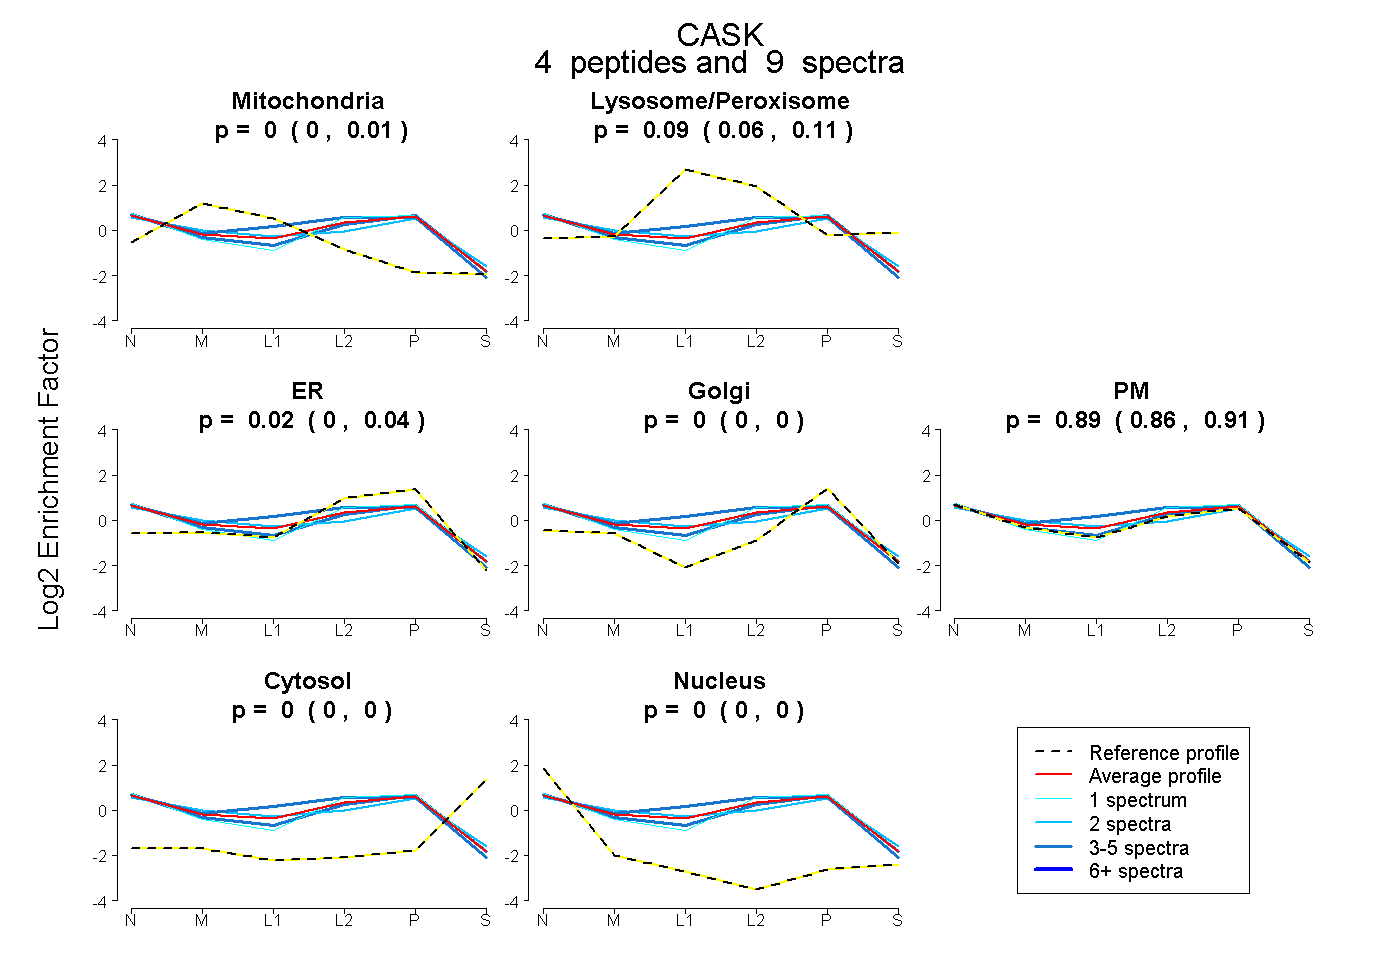
0.000 | 0.005
0.059 | 0.114
0.000 | 0.044
0.000 | 0.000
0.857 | 0.915
0.000 | 0.000
0.000 | 0.000
8peptides
spectra
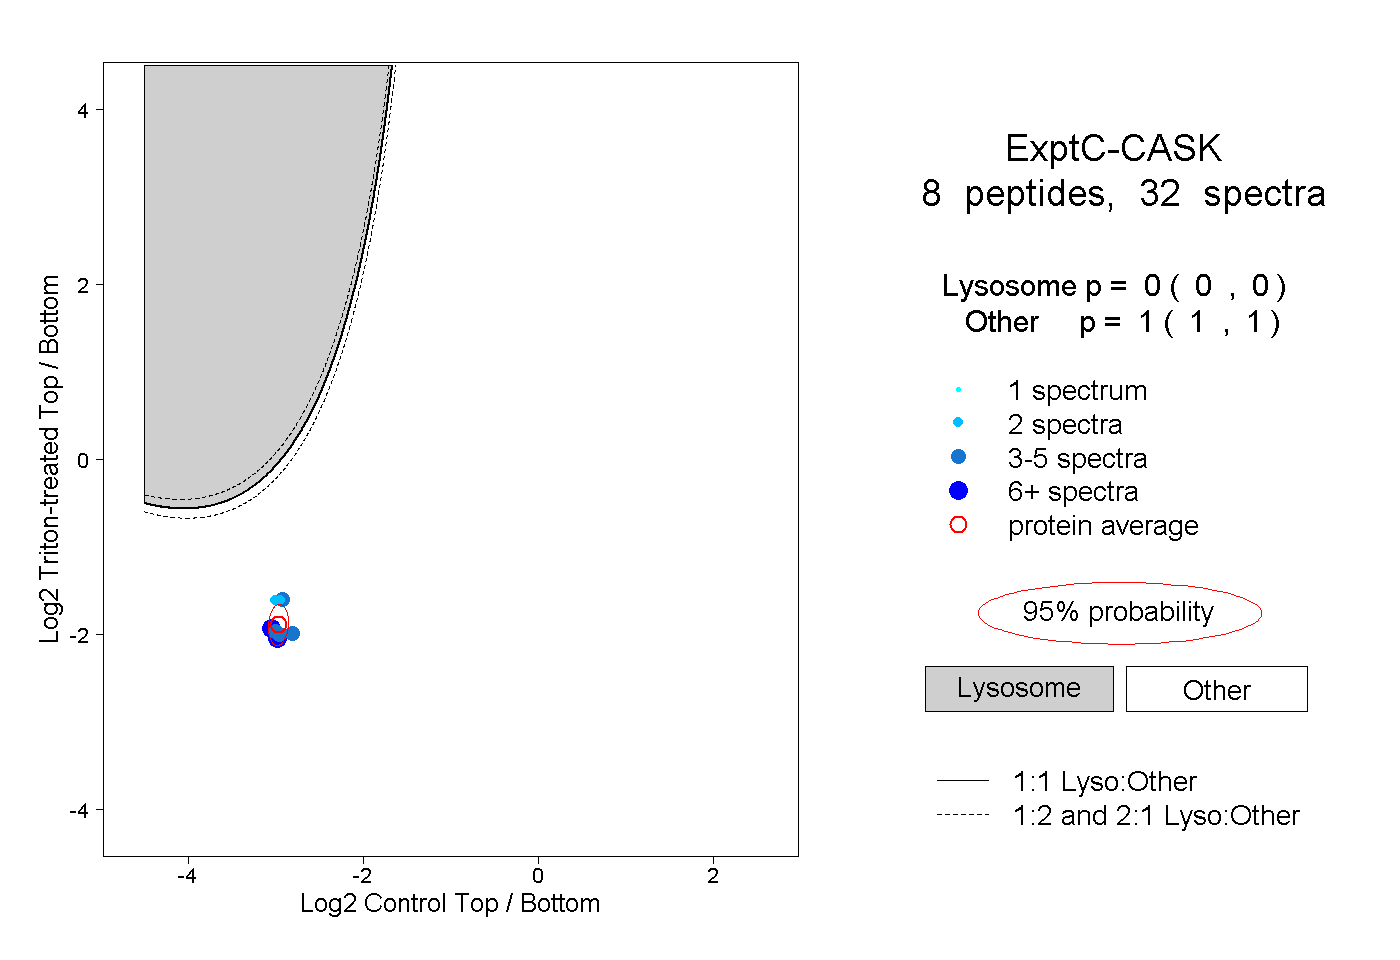
0.000 | 0.000
1.000 | 1.000