 7
7peptides
spectra
0.000 | 0.008
0.000 | 0.000
0.009 | 0.046
0.266 | 0.341
0.000 | 0.004
0.595 | 0.689
0.000 | 0.023
0.000 | 0.011
| Plot | Mito | Lyso | Perox | ER | Golgi | PM | Cytosol | Nucleus | |||||
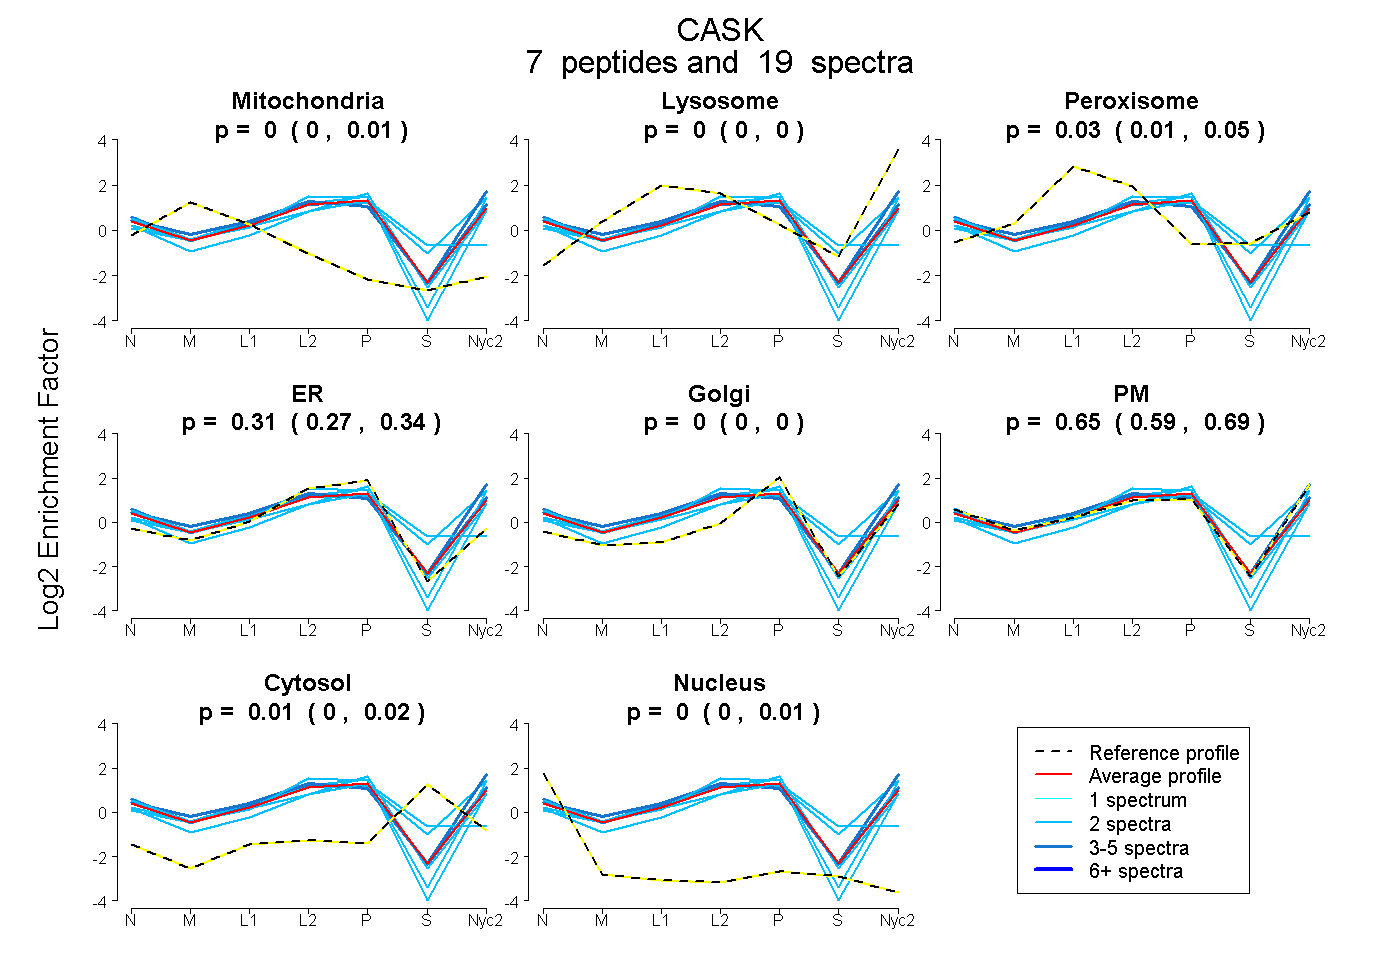
| Expt A |
7 peptides |
19 spectra |
|
0.000 0.000 | 0.008 |
0.000 0.000 | 0.000 |
0.030 0.009 | 0.046 |
0.310 0.266 | 0.341 |
0.000 0.000 | 0.004 |
0.649 0.595 | 0.689 |
0.007 0.000 | 0.023 |
0.003 0.000 | 0.011 |
| 2 spectra, VACIAMEK | 0.000 | 0.000 | 0.067 | 0.649 | 0.000 | 0.000 | 0.283 | 0.000 | ||
| 4 spectra, ESDVLQR | 0.000 | 0.000 | 0.032 | 0.229 | 0.000 | 0.738 | 0.000 | 0.002 | ||
| 2 spectra, IVPSYR | 0.014 | 0.008 | 0.020 | 0.313 | 0.213 | 0.432 | 0.000 | 0.000 | ||
| 2 spectra, VGDIIQIISK | 0.000 | 0.000 | 0.000 | 0.246 | 0.000 | 0.754 | 0.000 | 0.000 | ||
| 5 spectra, TLVLLGAHGVGR | 0.000 | 0.063 | 0.039 | 0.054 | 0.000 | 0.844 | 0.000 | 0.000 | ||
| 2 spectra, GSITFK | 0.000 | 0.110 | 0.124 | 0.055 | 0.077 | 0.538 | 0.094 | 0.000 | ||
| 2 spectra, DDHNWWQGK | 0.000 | 0.000 | 0.000 | 0.407 | 0.000 | 0.590 | 0.000 | 0.003 |
| Plot | Mito | Lyso or Perox | ER | Golgi | PM | Cytosol | Nucleus | ||||||
| Expt B |
4 peptides |
9 spectra |
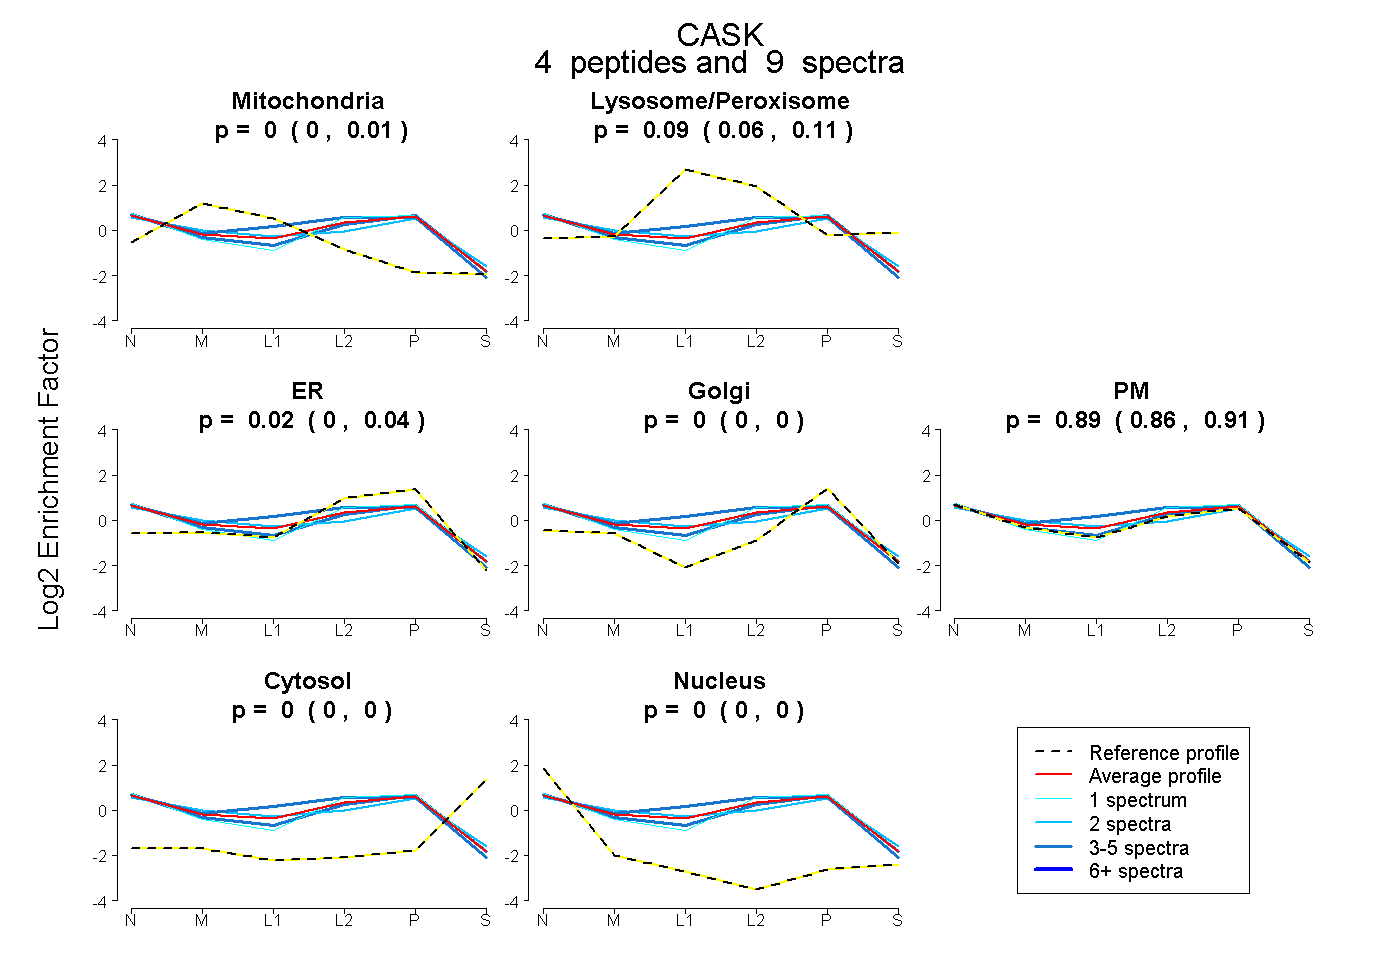 |
0.000 0.000 | 0.005 |
0.090 0.059 | 0.114 |
0.018 0.000 | 0.044 |
0.000 0.000 | 0.000 |
0.892 0.857 | 0.915 |
0.000 0.000 | 0.000 |
0.000 0.000 | 0.000 |
|||
| Plot | Lyso | Other | |||||||||||
| Expt C |
8 peptides |
32 spectra |
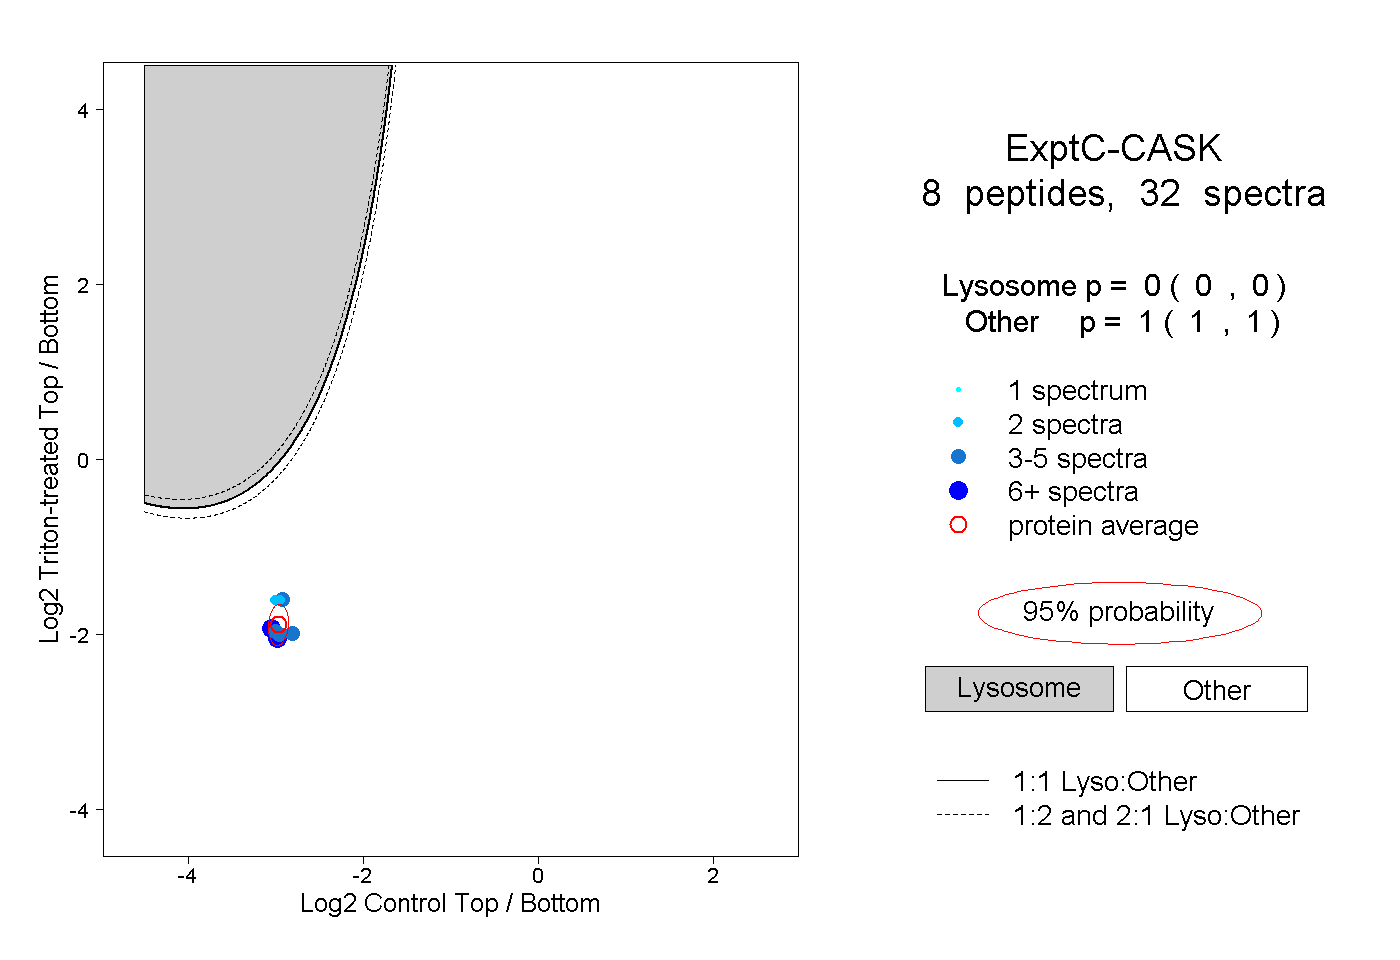 |
0.000 0.000 | 0.000 |
1.000 1.000 | 1.000 |