CASK
[ENSRNOP00000004187]
Main page
| | | Plot |
Mito |
Lyso |
|
Perox |
ER |
Golgi |
PM |
Cytosol |
Nucleus |
|
| Expt A |
 7
7
peptides |
19
spectra |
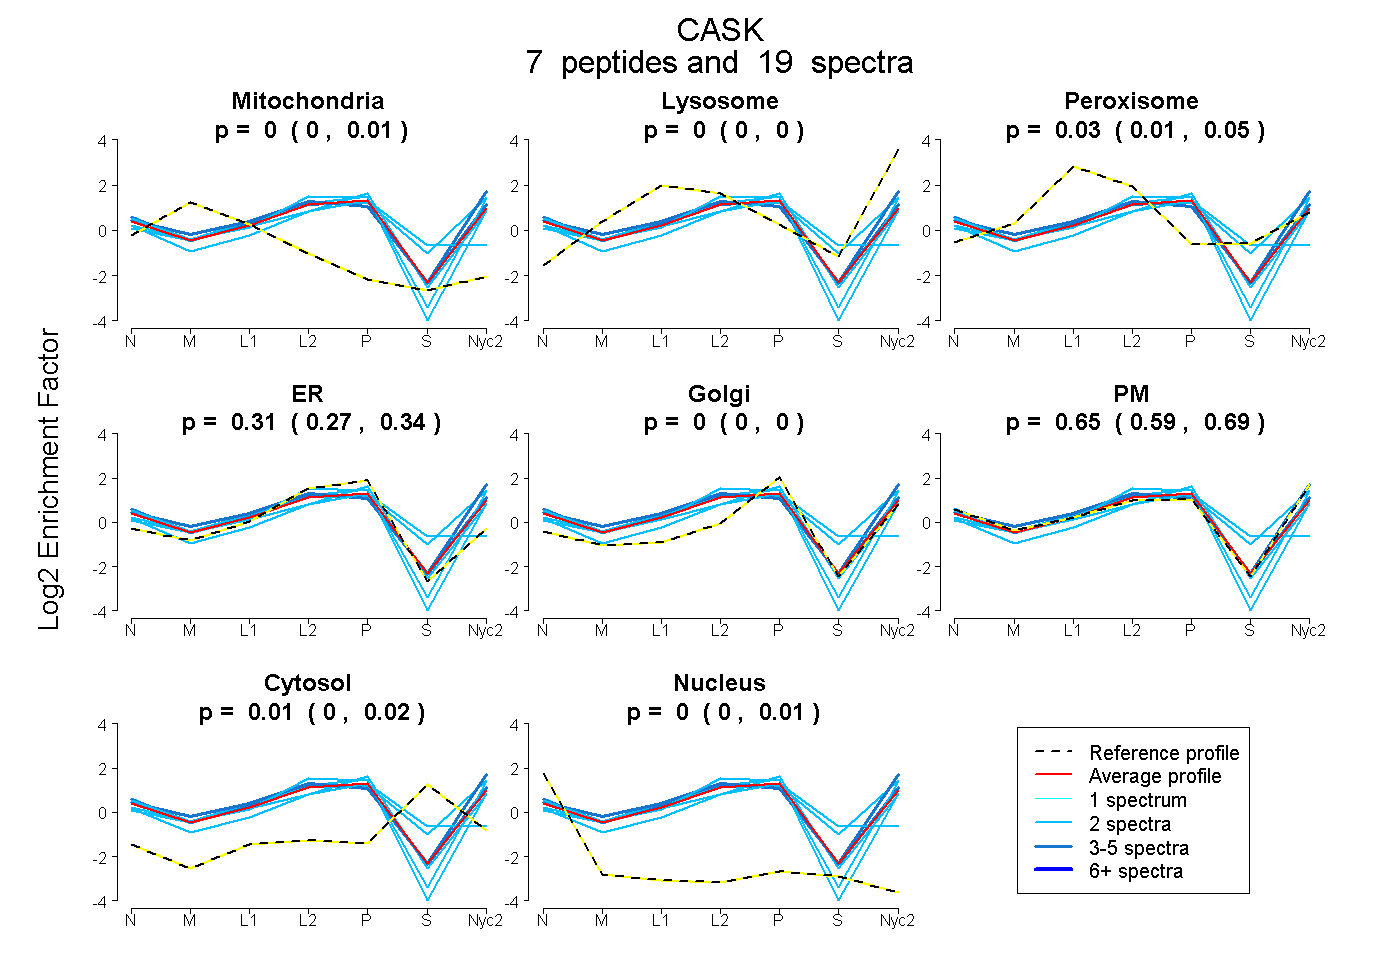 |
0.000
0.000 | 0.008 |
0.000
0.000 | 0.000 |
|
0.030
0.009 | 0.046 |
0.310
0.266 | 0.341 |
0.000
0.000 | 0.004 |
0.649
0.595 | 0.689 |
0.007
0.000 | 0.023 |
0.003
0.000 | 0.011 |
|
| | | Plot |
Mito |
|
Lyso or Perox |
|
ER |
Golgi |
PM |
Cytosol |
Nucleus |
|
| Expt B |
4
peptides |
9
spectra |
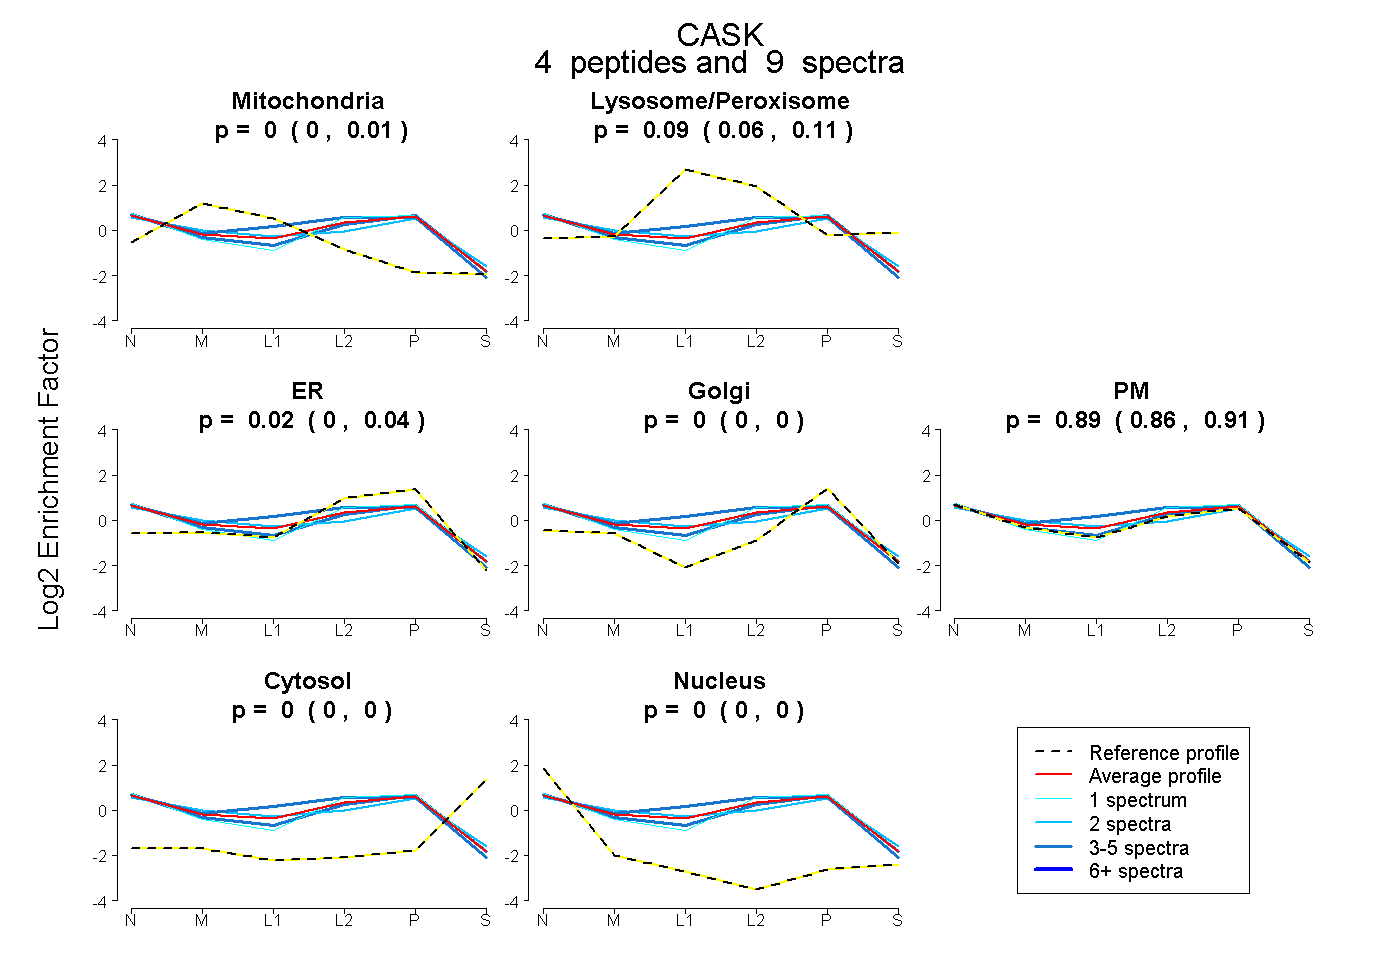 |
0.000
0.000 | 0.005 |
|
0.090
0.059 | 0.114 |
|
0.018
0.000 | 0.044 |
0.000
0.000 | 0.000 |
0.892
0.857 | 0.915 |
0.000
0.000 | 0.000 |
0.000
0.000 | 0.000 |
|
| 3 spectra, ESDVLQR |
0.000 |
|
0.026 |
|
0.035 |
0.000 |
0.939 |
0.000 |
0.000 |
|
| 2 spectra, IVPSYR |
0.086 |
|
0.095 |
|
0.000 |
0.061 |
0.758 |
0.000 |
0.000 |
|
| 1 spectrum, VGDIIQIISK |
0.000 |
|
0.007 |
|
0.114 |
0.000 |
0.879 |
0.000 |
0.000 |
|
| 3 spectra, TLVLLGAHGVGR |
0.014 |
|
0.174 |
|
0.055 |
0.000 |
0.757 |
0.000 |
0.000 |
|
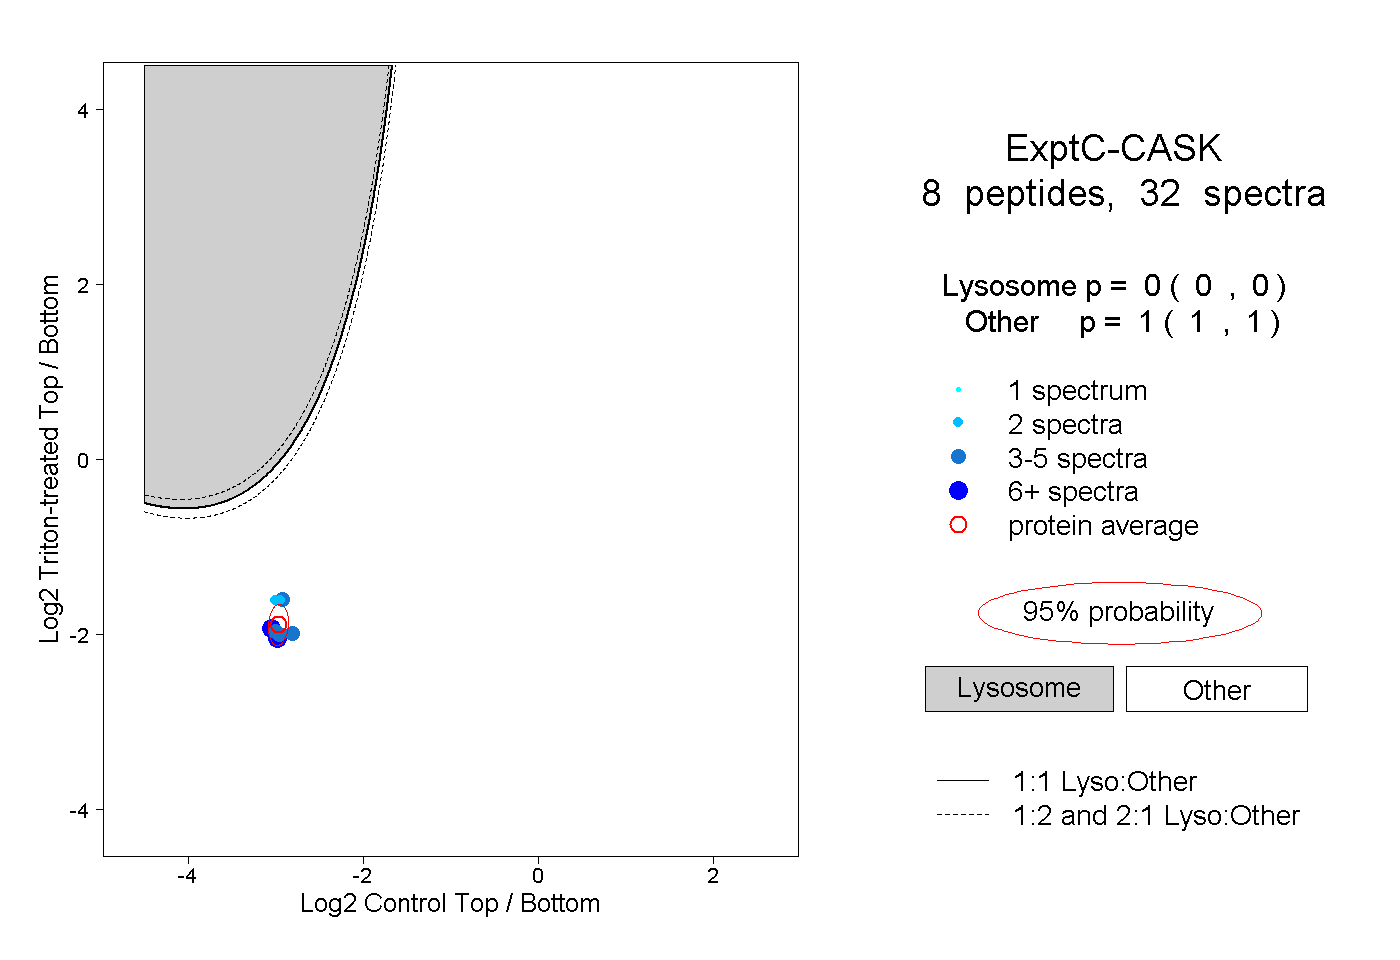
| | | Plot |
|
Lyso |
|
|
|
|
|
|
|
Other |
| Expt C |
8
peptides |
32
spectra |
 |
|
0.000
0.000 | 0.000 |
|
|
|
|
|
|
|
1.000
1.000 | 1.000 |