 7
7peptides
spectra
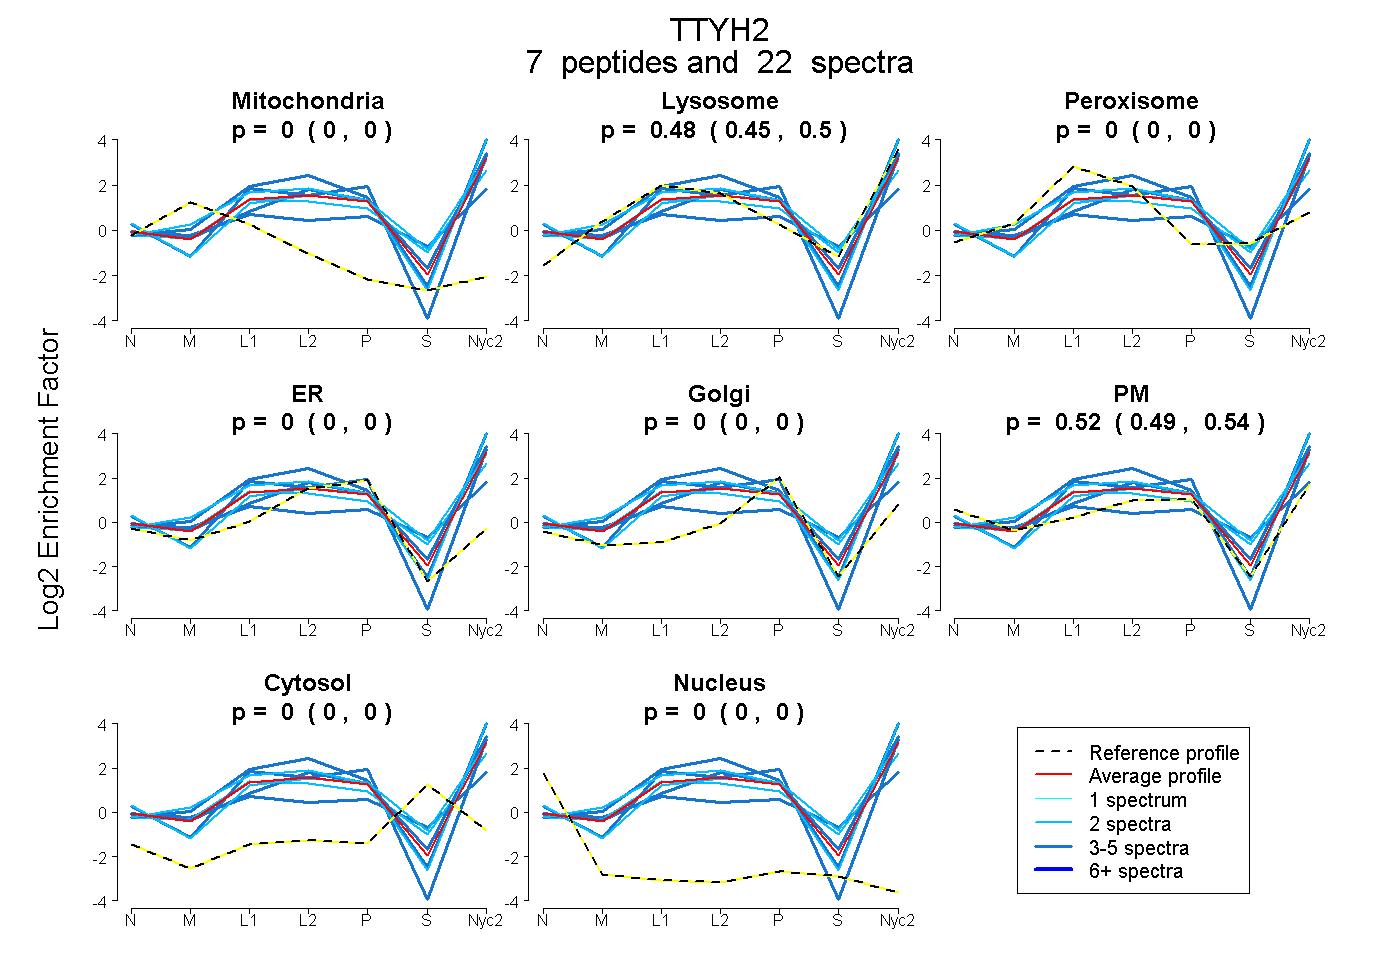
0.000 | 0.000
0.453 | 0.504
0.000 | 0.000
0.000 | 0.000
0.000 | 0.000
0.491 | 0.542
0.000 | 0.000
0.000 | 0.000
2peptides
spectra
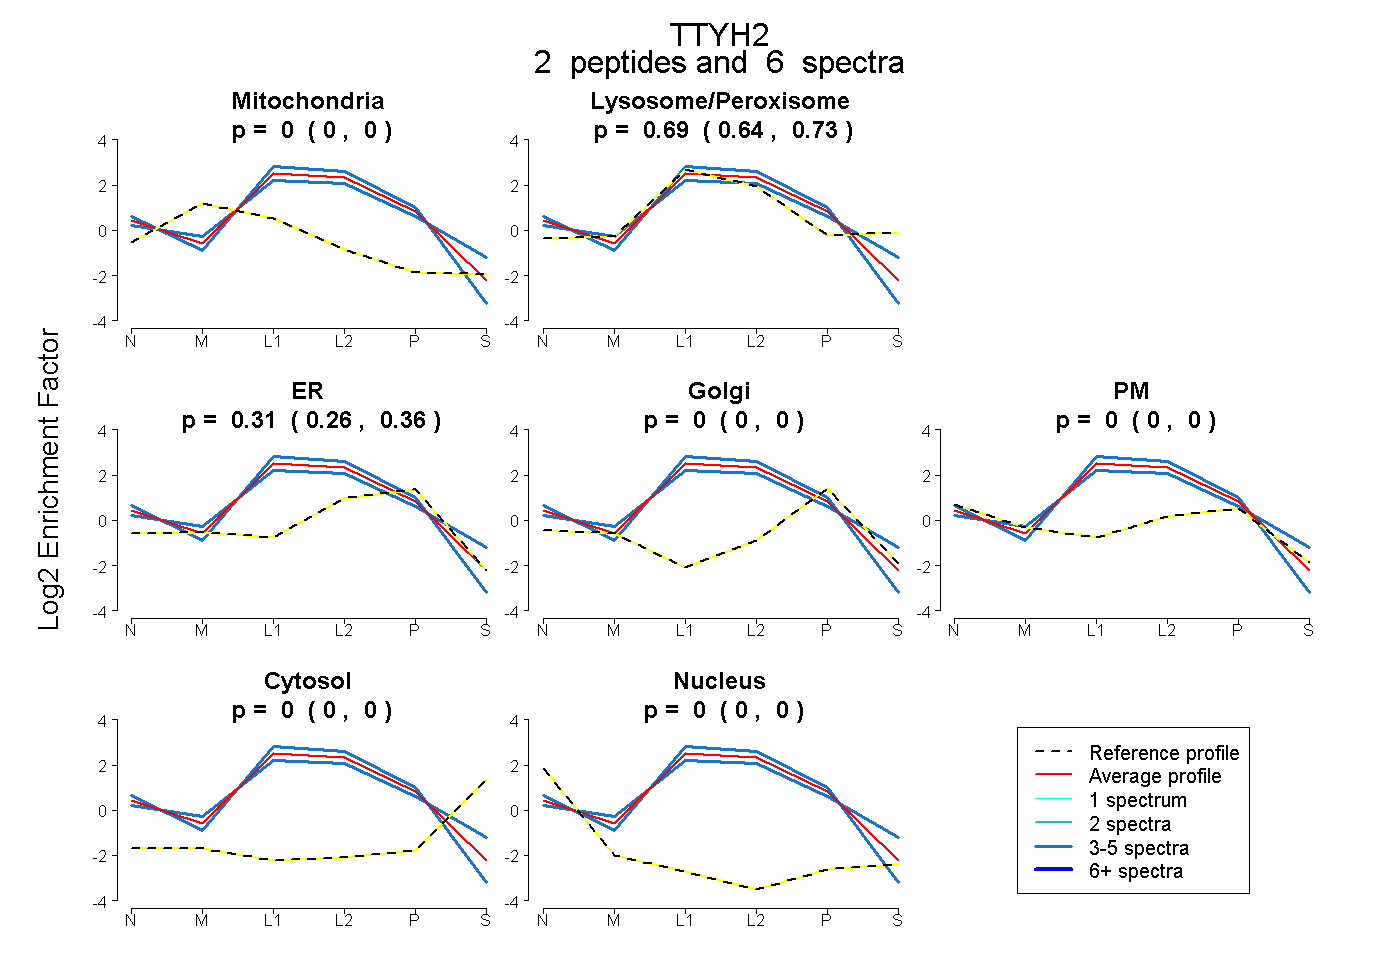
0.000 | 0.000
0.638 | 0.731
0.262 | 0.356
0.000 | 0.000
0.000 | 0.000
0.000 | 0.000
0.000 | 0.000
9peptides
spectra
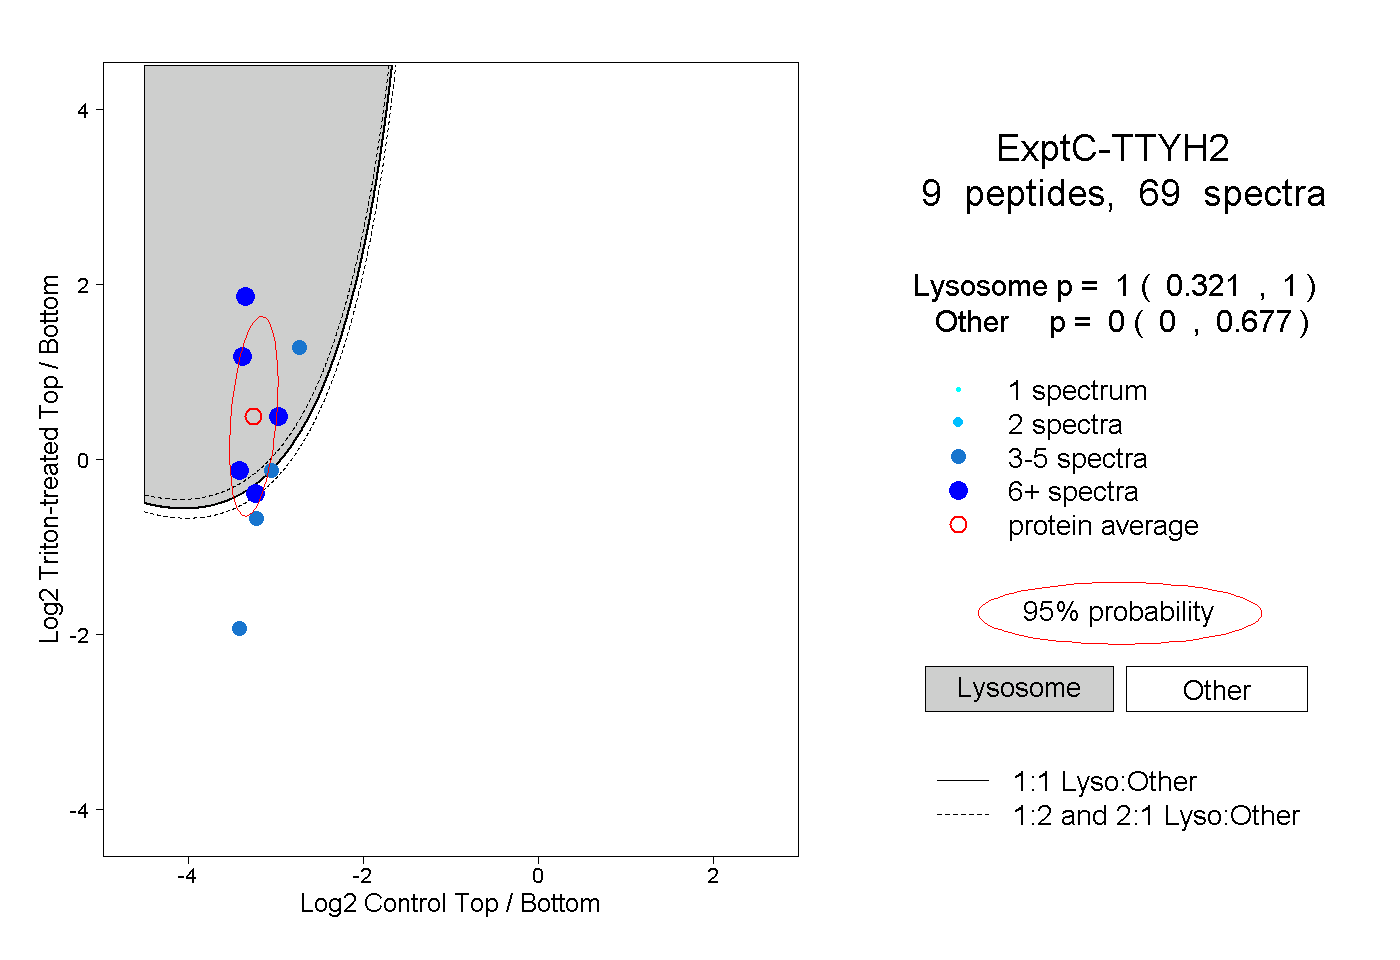
0.321 | 1.000
0.000 | 0.677
2peptides
spectra
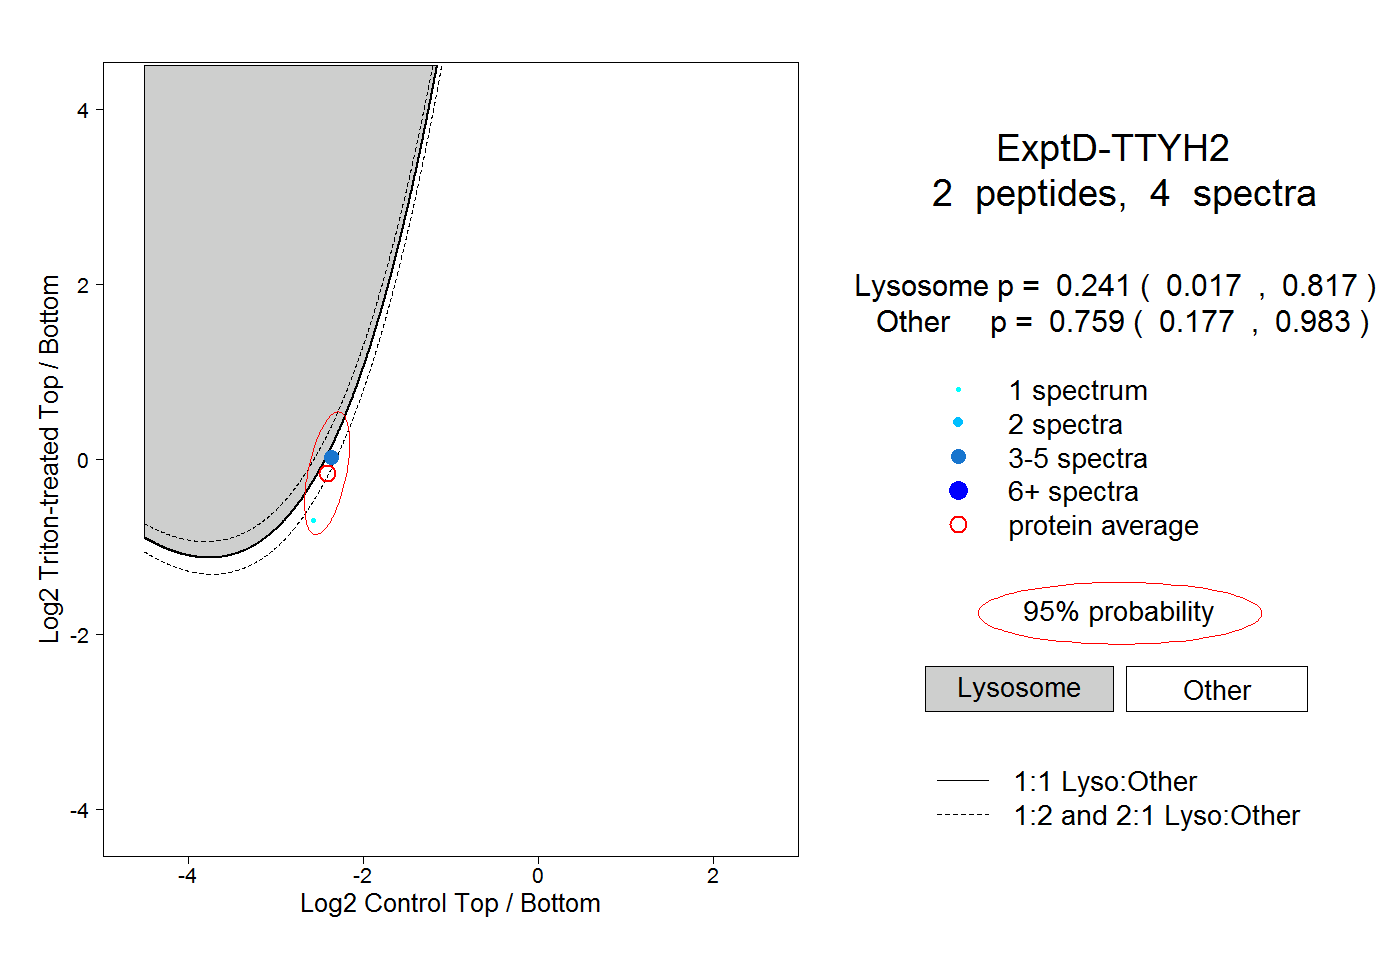
0.017 | 0.817
0.177 | 0.983