TTYH2
[ENSRNOP00000004081]
Main page
| | | Plot |
Mito |
Lyso |
|
Perox |
ER |
Golgi |
PM |
Cytosol |
Nucleus |
|
| Expt A |
 7
7
peptides |
22
spectra |
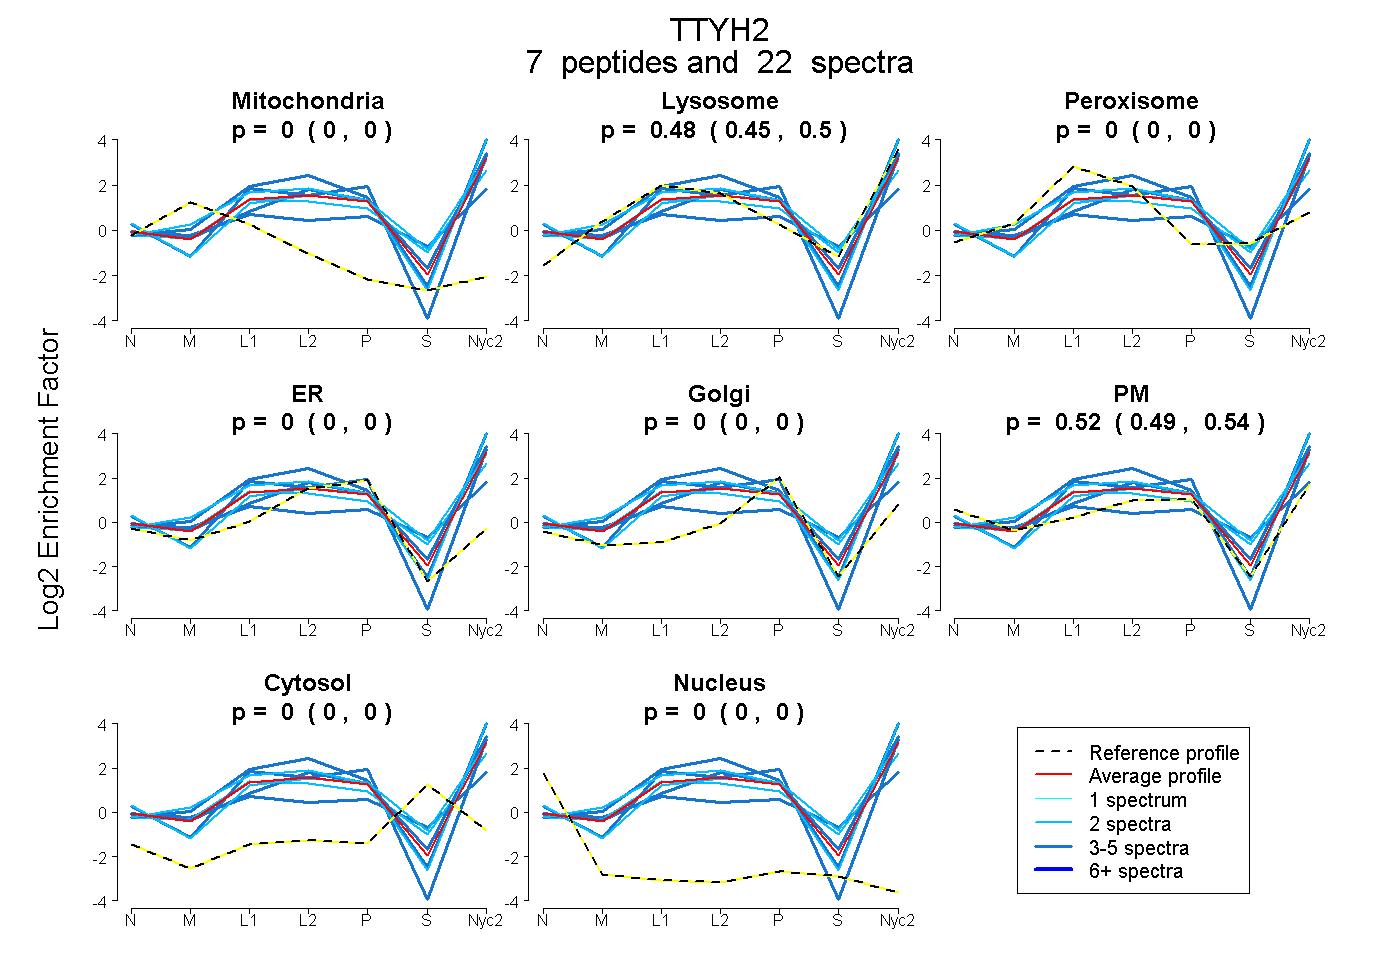 |
0.000
0.000 | 0.000 |
0.481
0.453 | 0.504 |
|
0.000
0.000 | 0.000 |
0.000
0.000 | 0.000 |
0.000
0.000 | 0.000 |
0.519
0.491 | 0.542 |
0.000
0.000 | 0.000 |
0.000
0.000 | 0.000 |
|
| | | Plot |
Mito |
|
Lyso or Perox |
|
ER |
Golgi |
PM |
Cytosol |
Nucleus |
|
| Expt B |
2
peptides |
6
spectra |
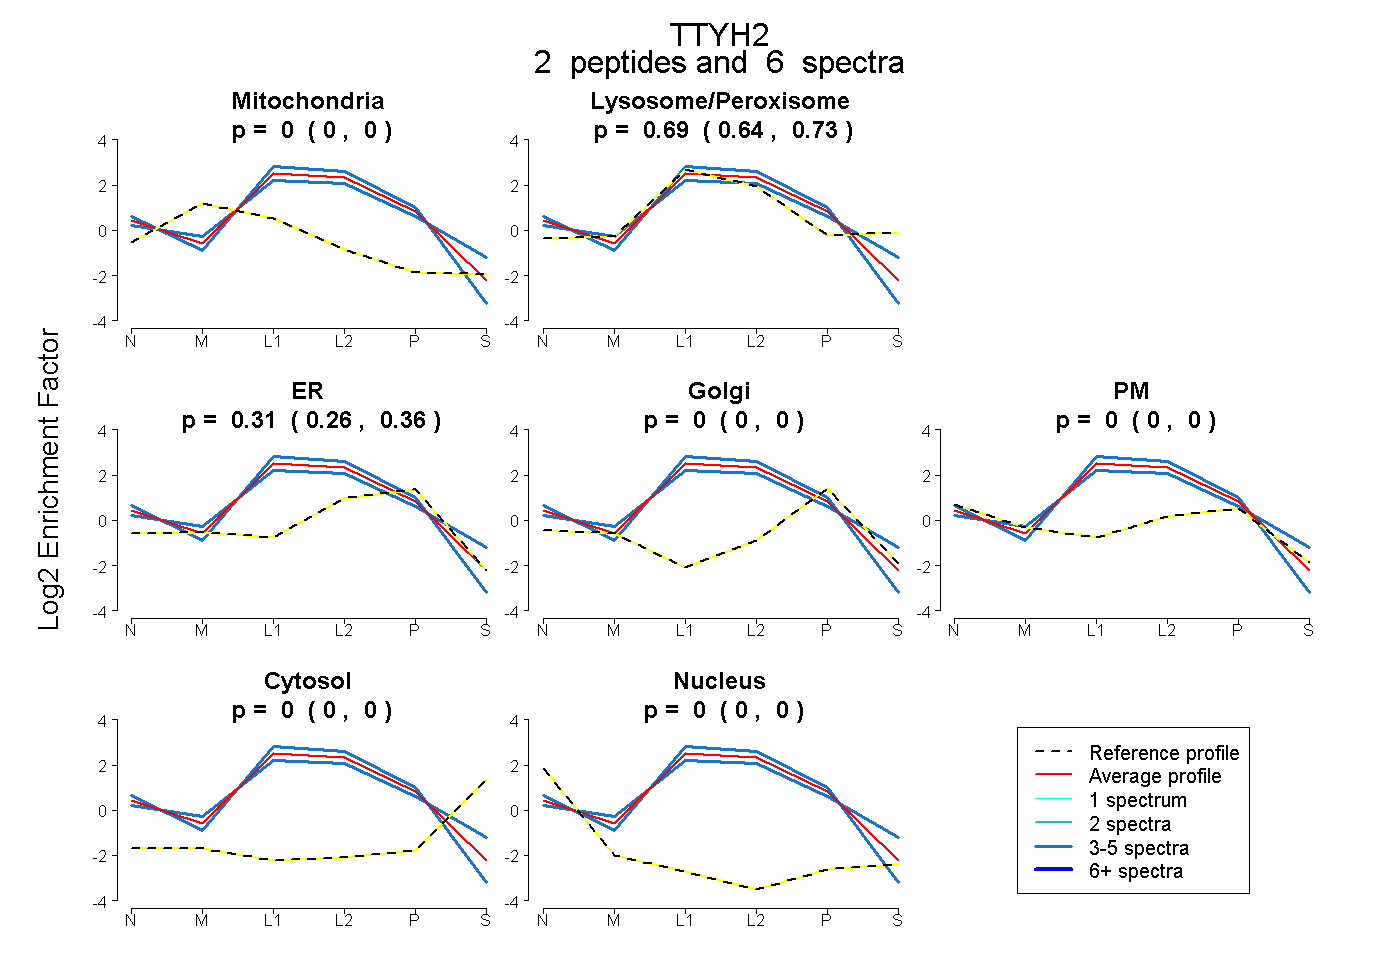 |
0.000
0.000 | 0.000 |
|
0.687
0.638 | 0.731 |
|
0.313
0.262 | 0.356 |
0.000
0.000 | 0.000 |
0.000
0.000 | 0.000 |
0.000
0.000 | 0.000 |
0.000
0.000 | 0.000 |
|
| | | Plot |
|
Lyso |
|
|
|
|
|
|
|
Other |
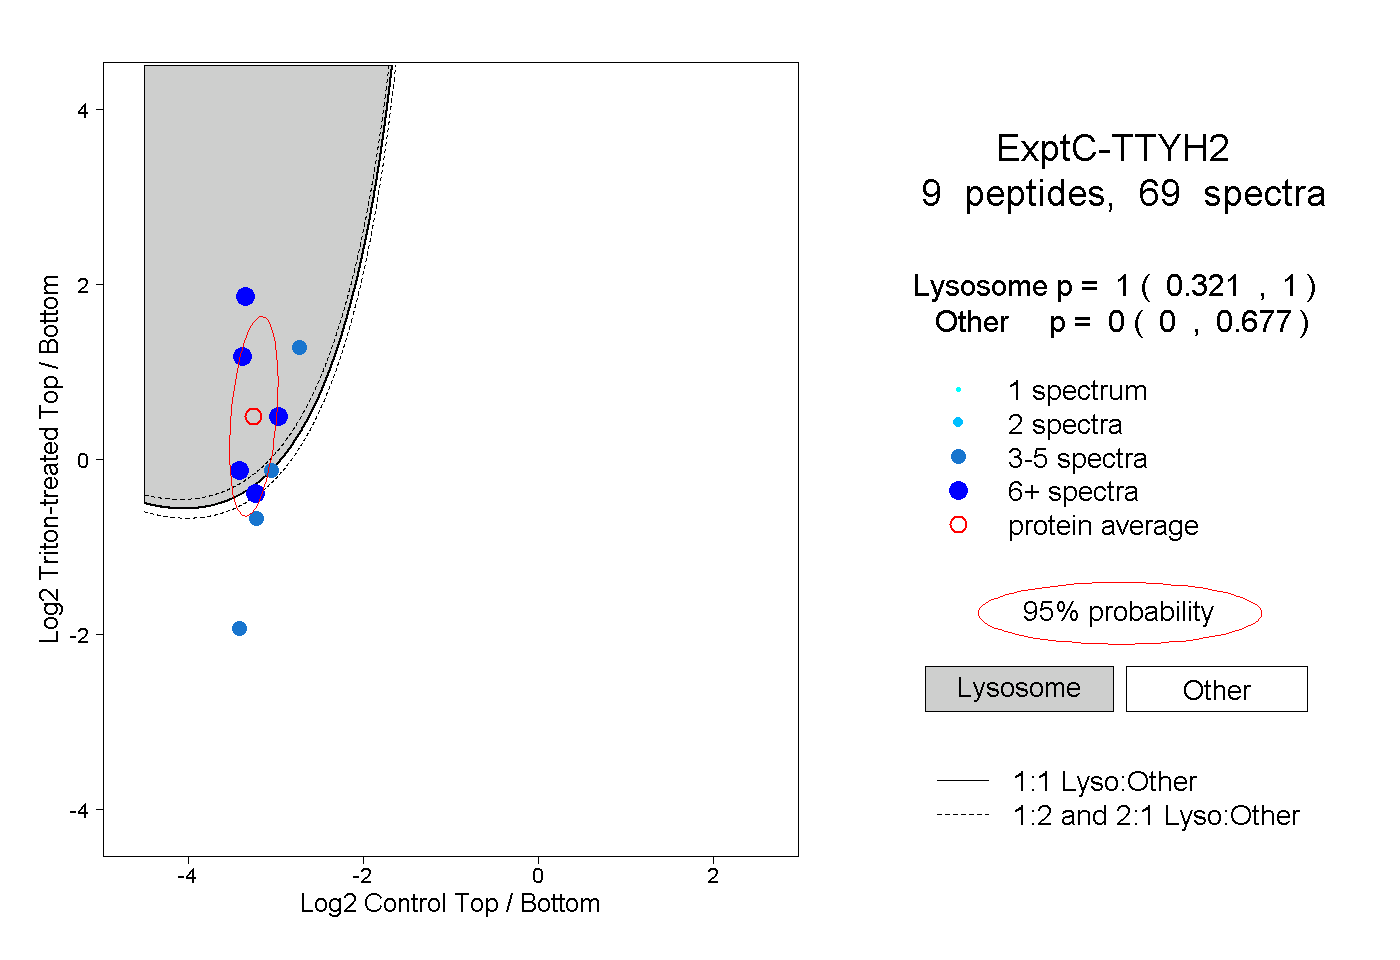
| Expt C |
9
peptides |
69
spectra |
 |
|
1.000
0.321 | 1.000 |
|
|
|
|
|
|
|
0.000
0.000 | 0.677 |
| 14 spectra, GDYMQTLK |
|
1.000 |
|
|
|
|
|
|
|
0.000 |
| 8 spectra, GSPPPTYSPSMR |
|
0.993 |
|
|
|
|
|
|
|
0.007 |
| 3 spectra, HYEFPS |
|
0.017 |
|
|
|
|
|
|
|
0.983 |
| 12 spectra, LSEIFAAR |
|
1.000 |
|
|
|
|
|
|
|
0.000 |
| 3 spectra, ATYMSVADEHLR |
|
0.000 |
|
|
|
|
|
|
|
1.000 |
| 3 spectra, YENVPLIGR |
|
0.509 |
|
|
|
|
|
|
|
0.491 |
| 4 spectra, DHTVQTK |
|
1.000 |
|
|
|
|
|
|
|
0.000 |
| 11 spectra, IAAHNPAR |
|
0.262 |
|
|
|
|
|
|
|
0.738 |
| 11 spectra, VDLEQHLAR |
|
0.953 |
|
|
|
|
|
|
|
0.047 |
| | | Plot |
|
Lyso |
|
|
|
|
|
|
|
Other |
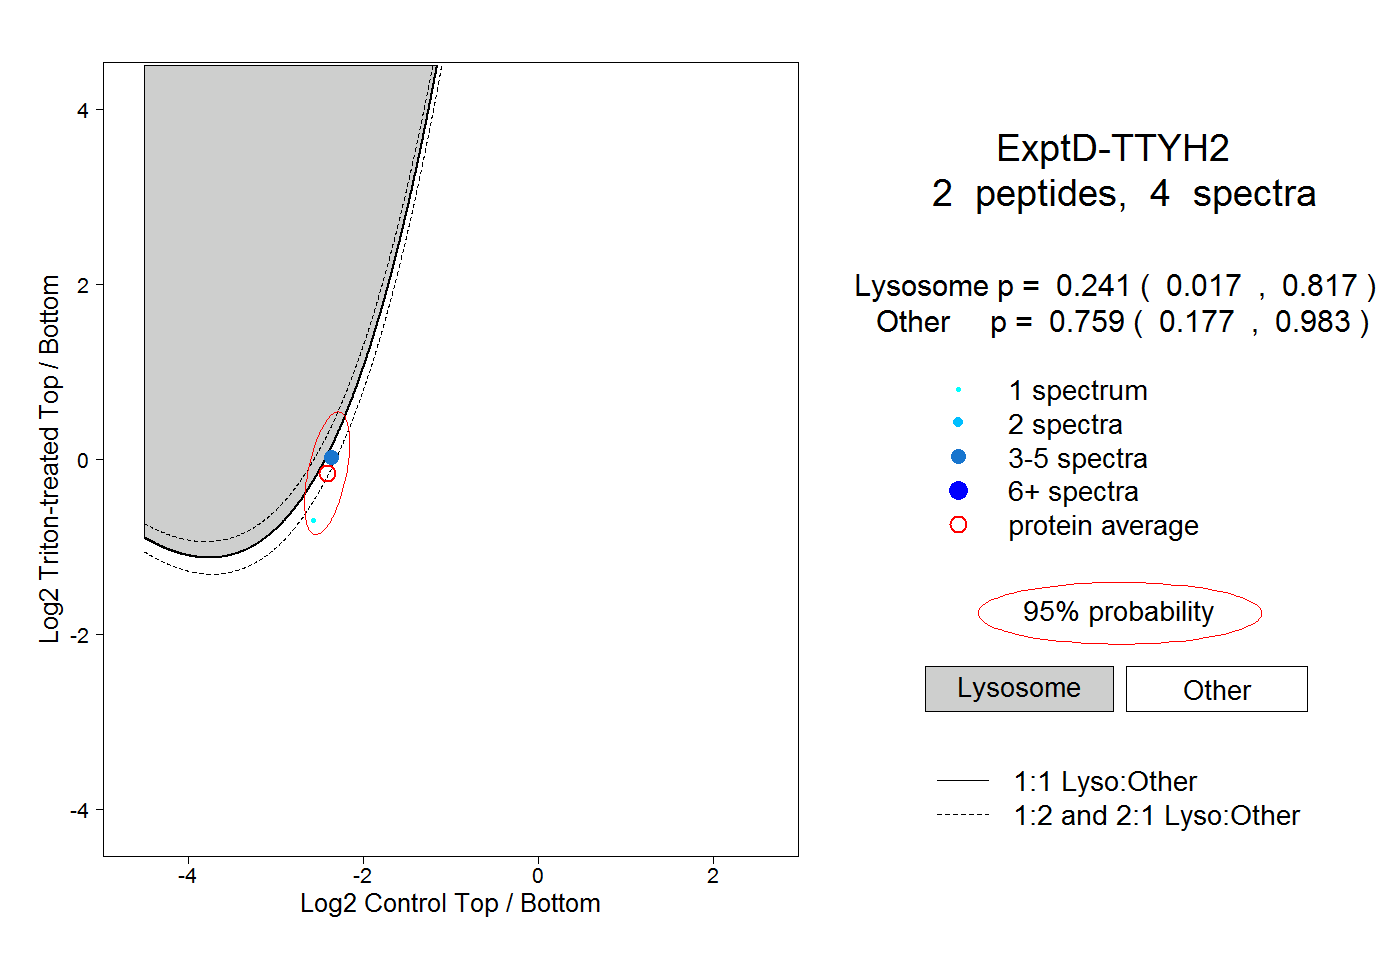
| Expt D |
2
peptides |
4
spectra |
 |
|
0.241
0.017 | 0.817 |
|
|
|
|
|
|
|
0.759
0.177 | 0.983 |