 7
7peptides
spectra
0.000 | 0.000
0.453 | 0.504
0.000 | 0.000
0.000 | 0.000
0.000 | 0.000
0.491 | 0.542
0.000 | 0.000
0.000 | 0.000
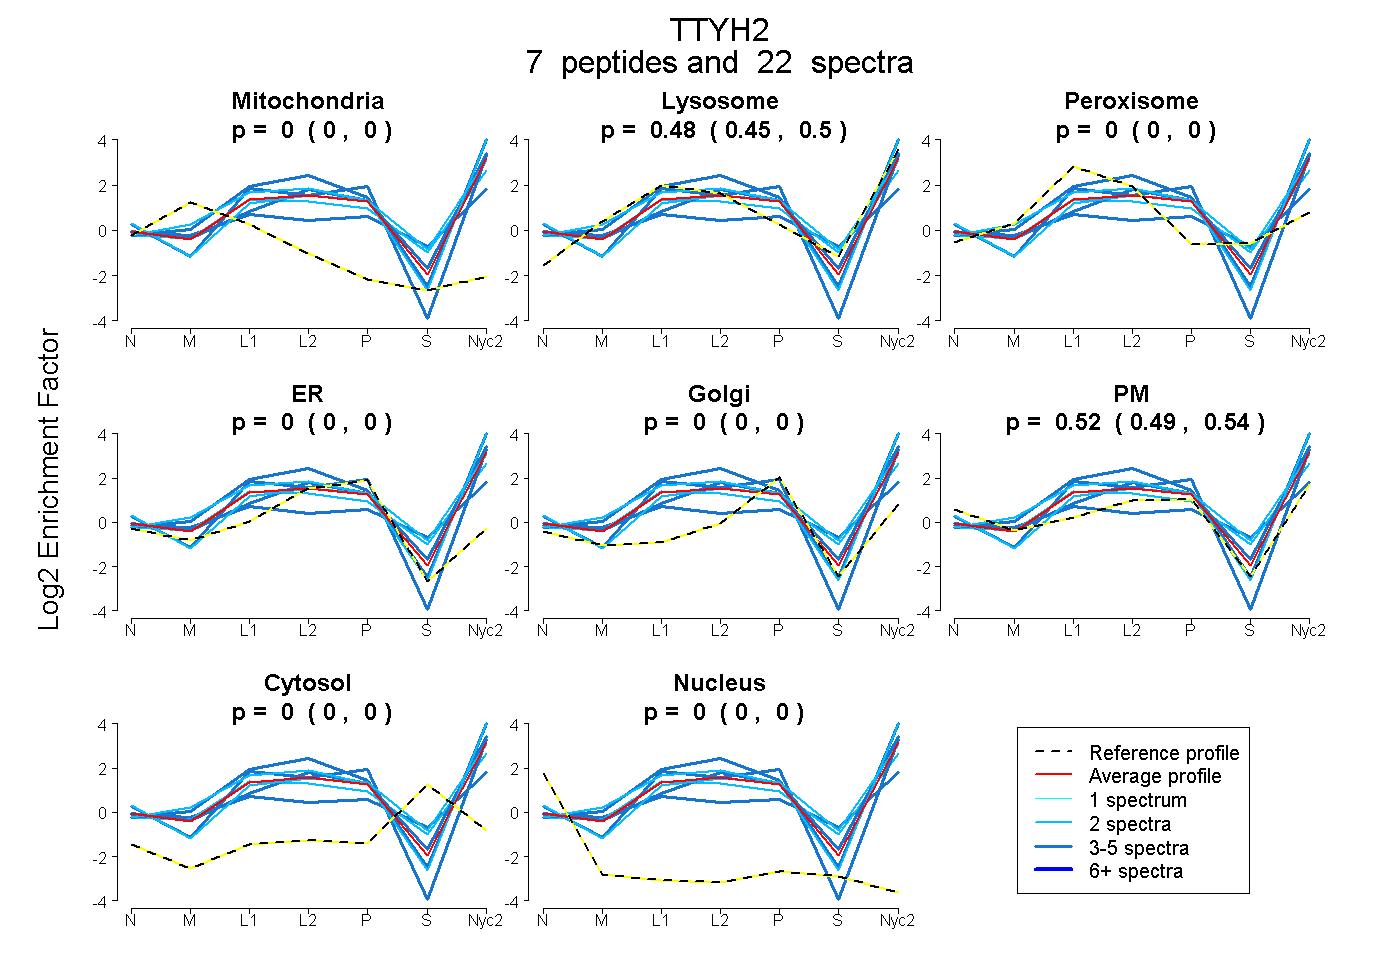
| Plot | Mito | Lyso | Perox | ER | Golgi | PM | Cytosol | Nucleus | |||||
| Expt A |
7 peptides |
22 spectra |
|
0.000 0.000 | 0.000 |
0.481 0.453 | 0.504 |
0.000 0.000 | 0.000 |
0.000 0.000 | 0.000 |
0.000 0.000 | 0.000 |
0.519 0.491 | 0.542 |
0.000 0.000 | 0.000 |
0.000 0.000 | 0.000 |
| 2 spectra, GDYMQTLK | 0.000 | 0.495 | 0.059 | 0.000 | 0.000 | 0.408 | 0.038 | 0.000 | ||
| 4 spectra, GSPPPTYSPSMR | 0.000 | 0.258 | 0.000 | 0.000 | 0.000 | 0.742 | 0.000 | 0.000 | ||
| 5 spectra, ATYMSVADEHLR | 0.000 | 0.294 | 0.070 | 0.000 | 0.000 | 0.443 | 0.192 | 0.000 | ||
| 2 spectra, YENVPLIGR | 0.000 | 0.455 | 0.000 | 0.000 | 0.000 | 0.518 | 0.027 | 0.000 | ||
| 4 spectra, LSEIFAAR | 0.000 | 0.689 | 0.000 | 0.000 | 0.000 | 0.311 | 0.000 | 0.000 | ||
| 2 spectra, VDLEQHLAR | 0.000 | 0.638 | 0.000 | 0.000 | 0.000 | 0.362 | 0.000 | 0.000 | ||
| 3 spectra, IAAHNPAR | 0.000 | 0.485 | 0.000 | 0.000 | 0.000 | 0.515 | 0.000 | 0.000 |
| Plot | Mito | Lyso or Perox | ER | Golgi | PM | Cytosol | Nucleus | ||||||
| Expt B |
2 peptides |
6 spectra |
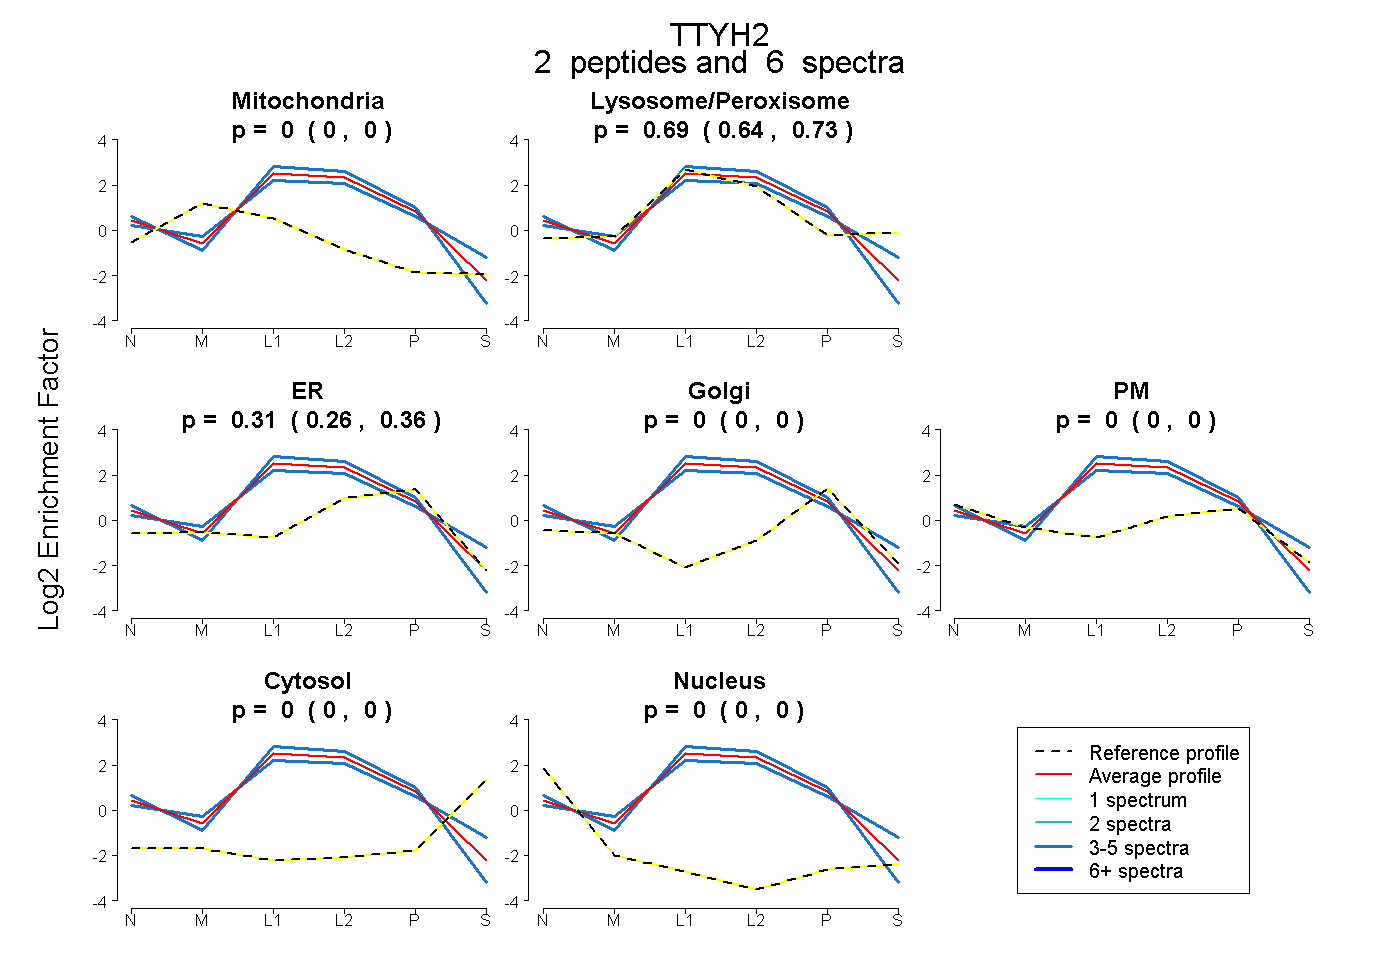 |
0.000 0.000 | 0.000 |
0.687 0.638 | 0.731 |
0.313 0.262 | 0.356 |
0.000 0.000 | 0.000 |
0.000 0.000 | 0.000 |
0.000 0.000 | 0.000 |
0.000 0.000 | 0.000 |
|||
| Plot | Lyso | Other | |||||||||||
| Expt C |
9 peptides |
69 spectra |
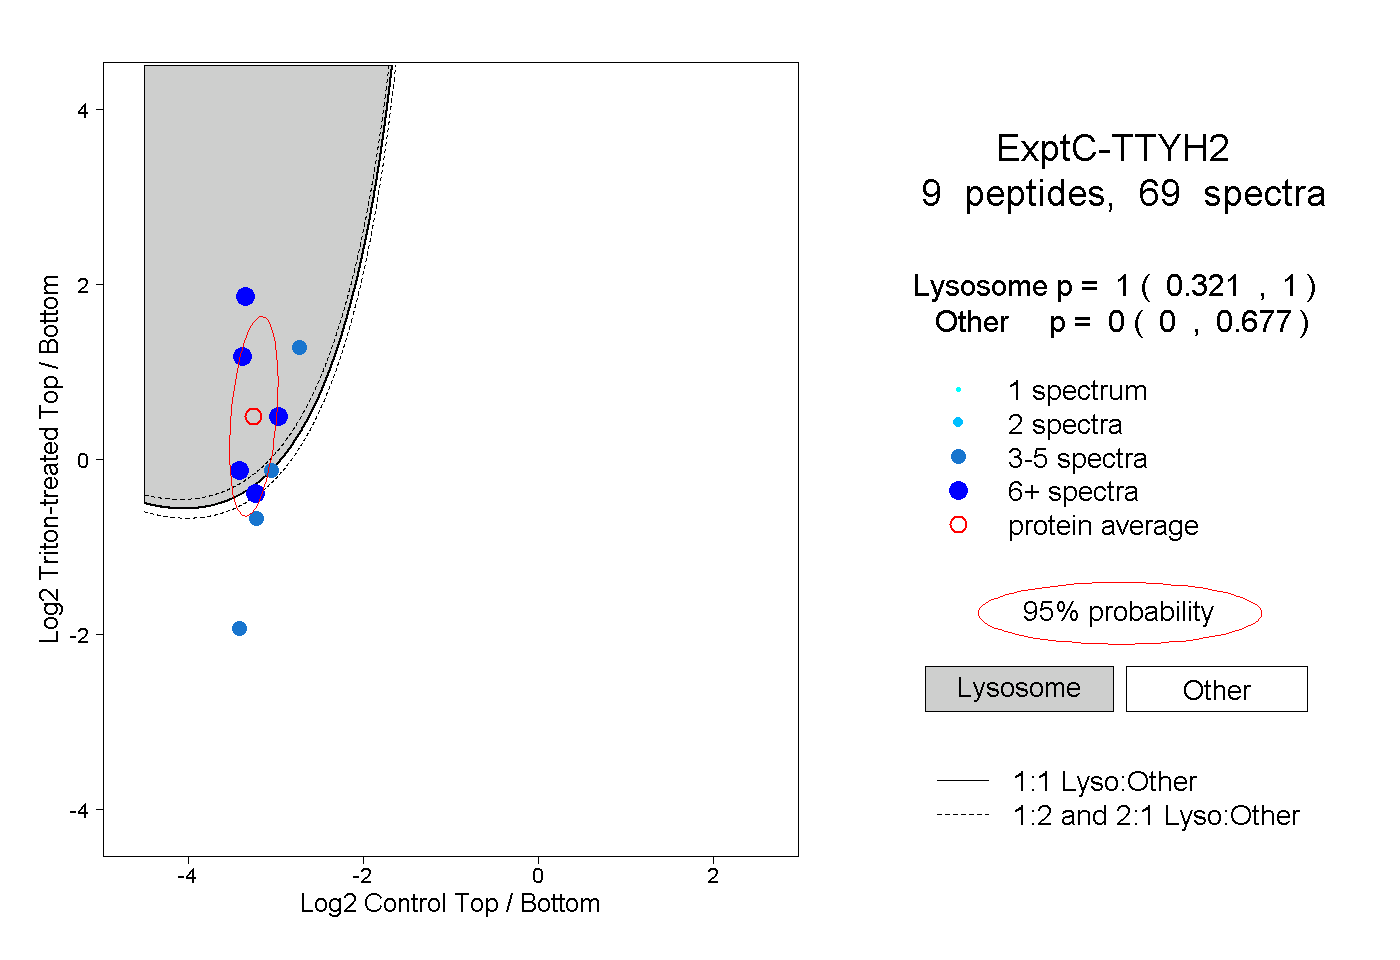 |
1.000 0.321 | 1.000 |
0.000 0.000 | 0.677 |
||||||||
| Plot | Lyso | Other | |||||||||||
| Expt D |
2 peptides |
4 spectra |
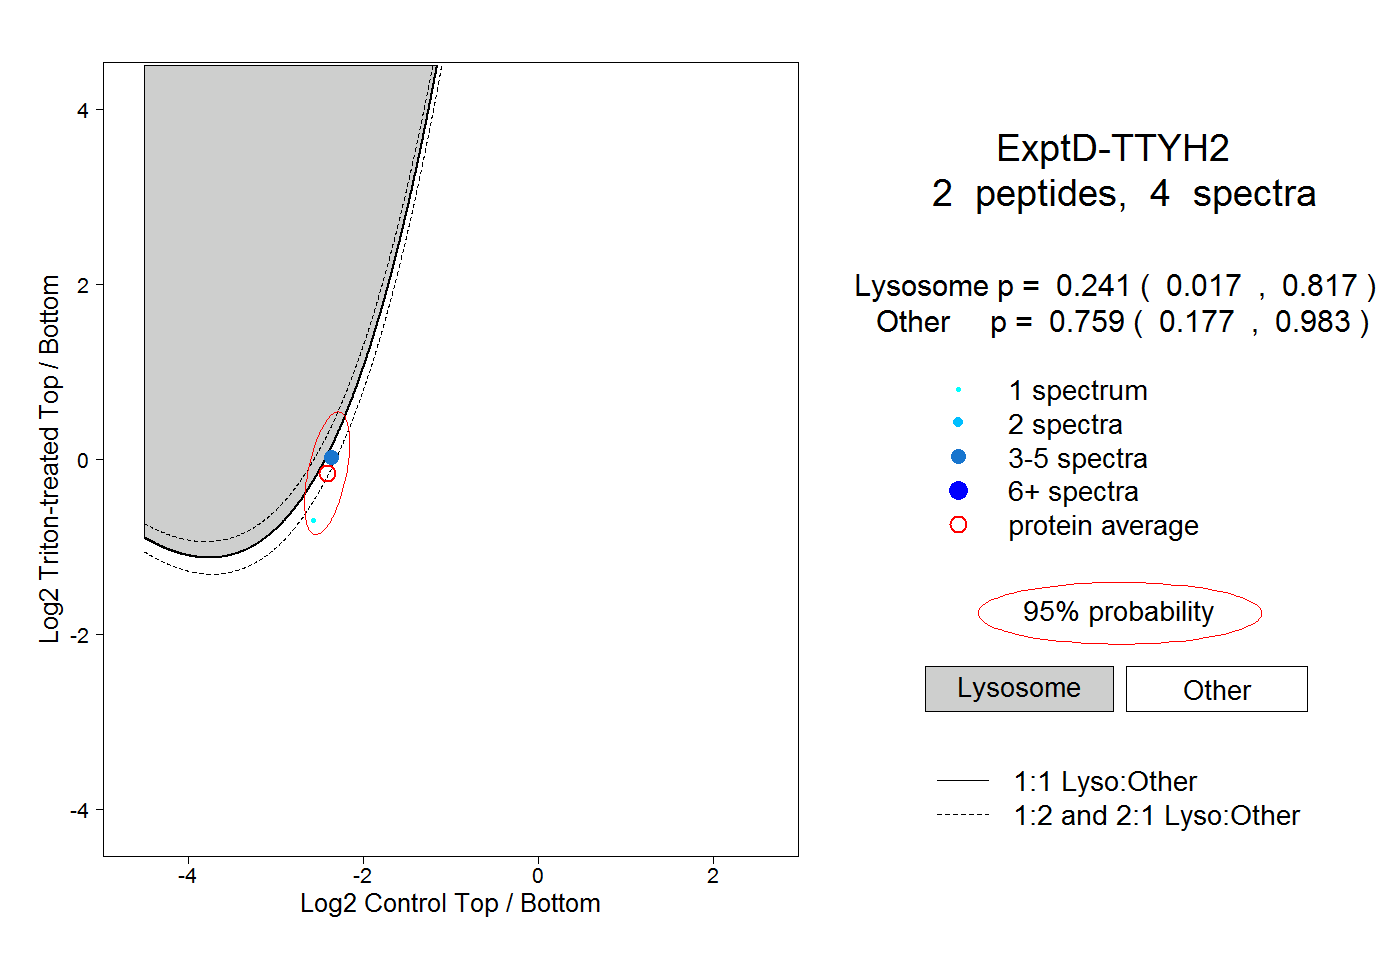 |
0.241 0.017 | 0.817 |
0.759 0.177 | 0.983 |