 6
6peptides
spectra
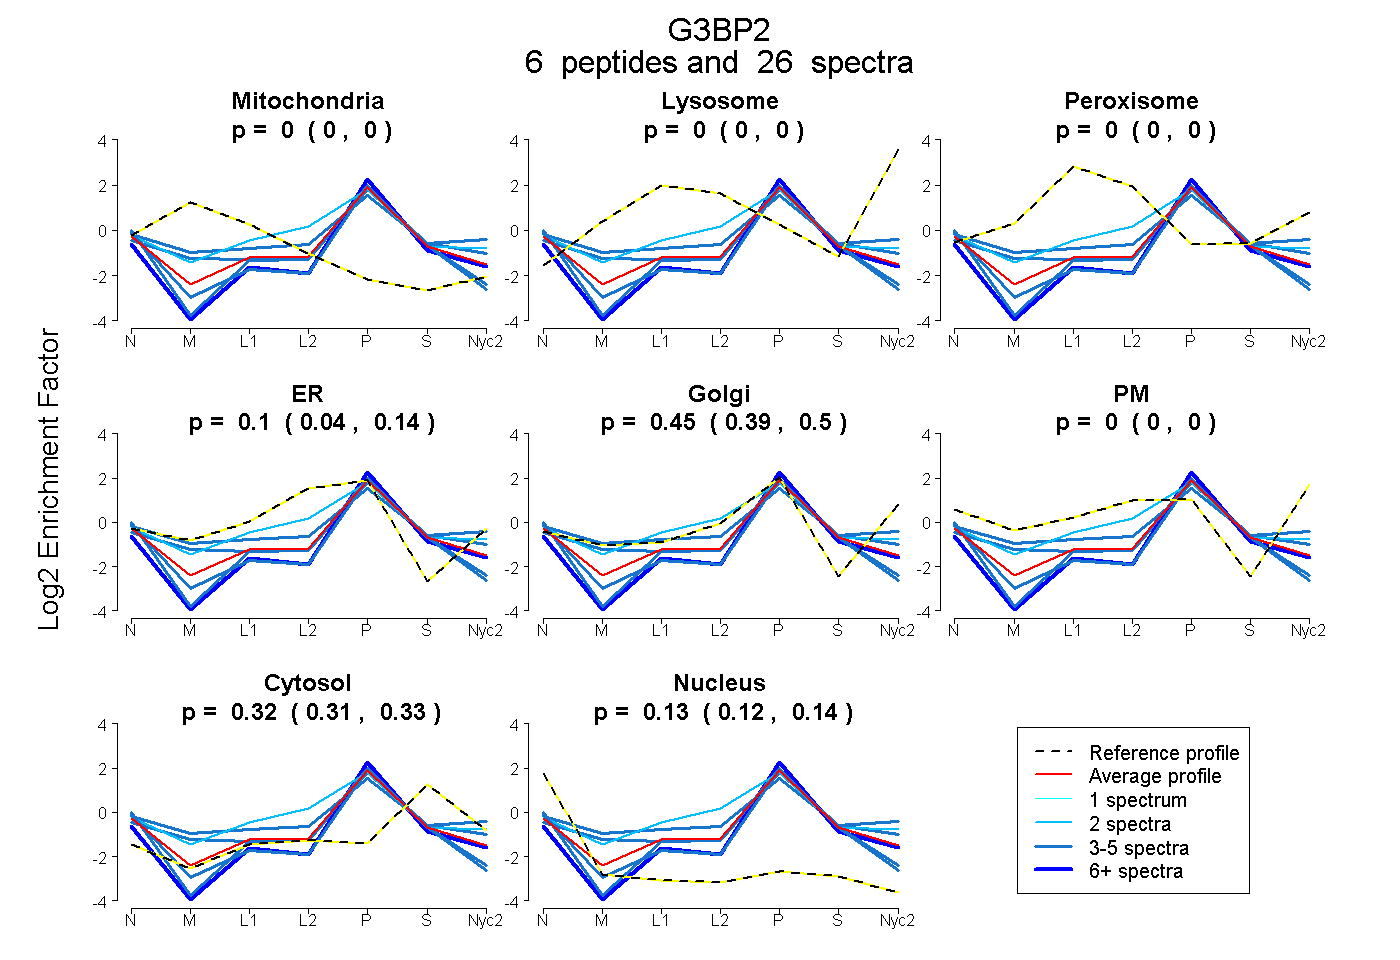
0.000 | 0.000
0.000 | 0.000
0.000 | 0.000
0.038 | 0.140
0.387 | 0.502
0.000 | 0.000
0.314 | 0.332
0.117 | 0.141
6peptides
spectra
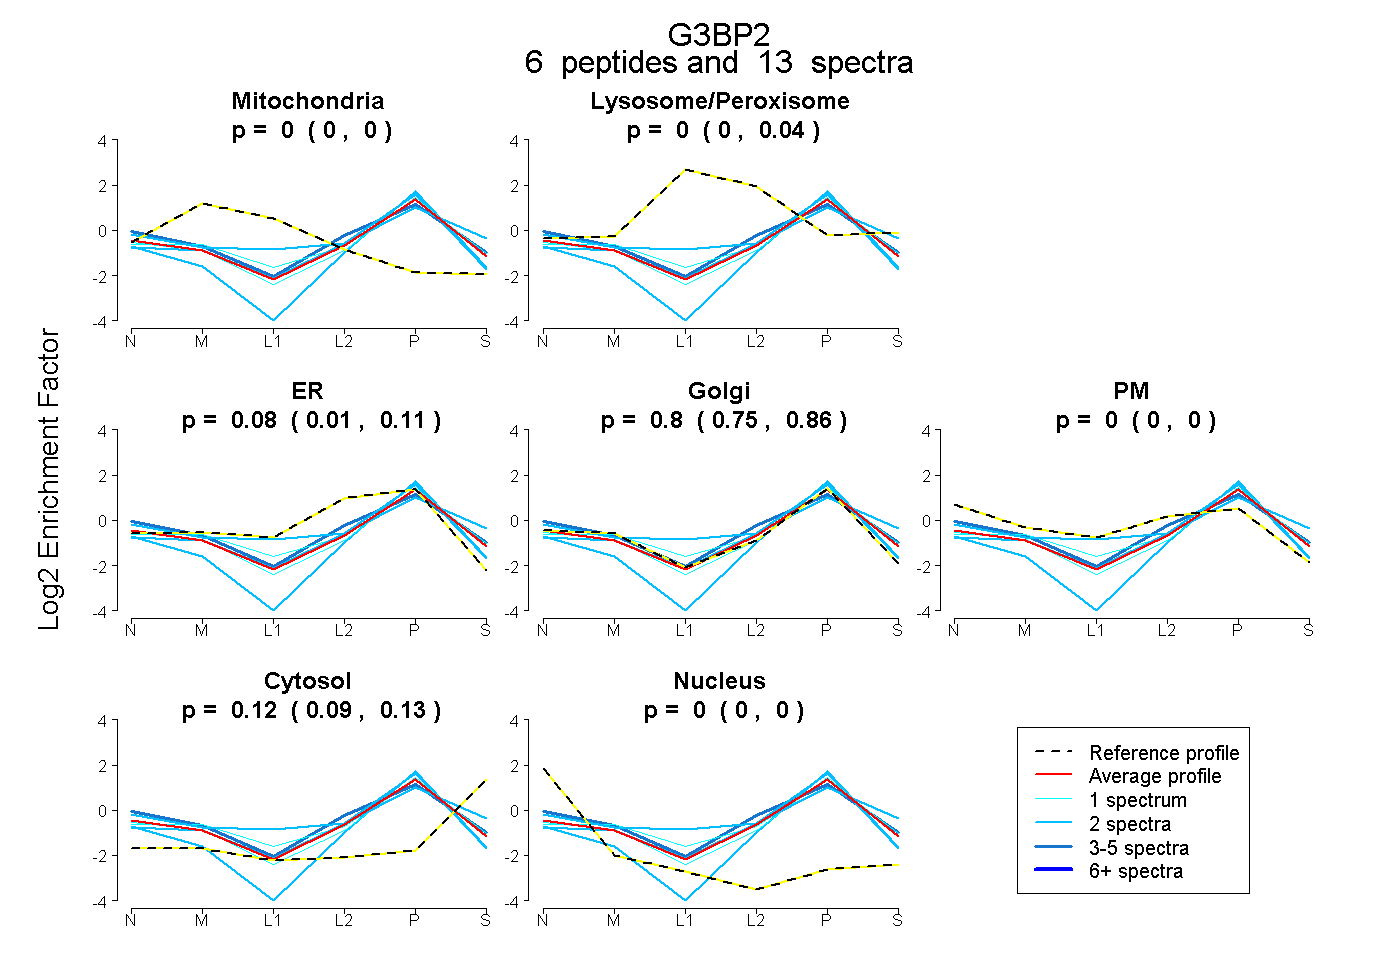
0.000 | 0.000
0.000 | 0.037
0.005 | 0.113
0.753 | 0.859
0.000 | 0.000
0.095 | 0.132
0.000 | 0.000
6peptides
spectra
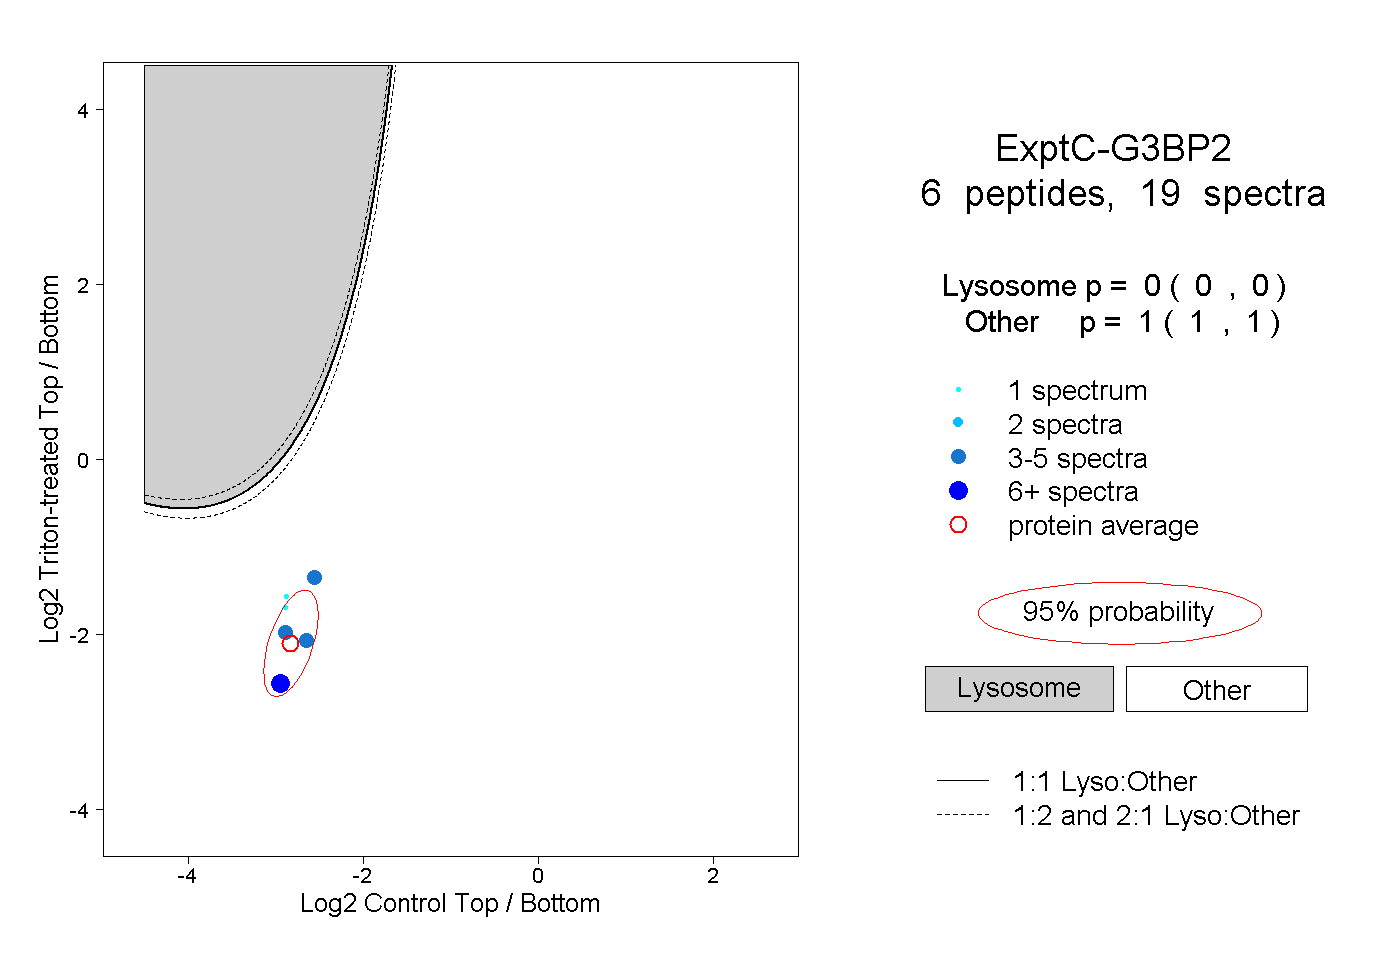
0.000 | 0.000
1.000 | 1.000
1peptide
spectrum
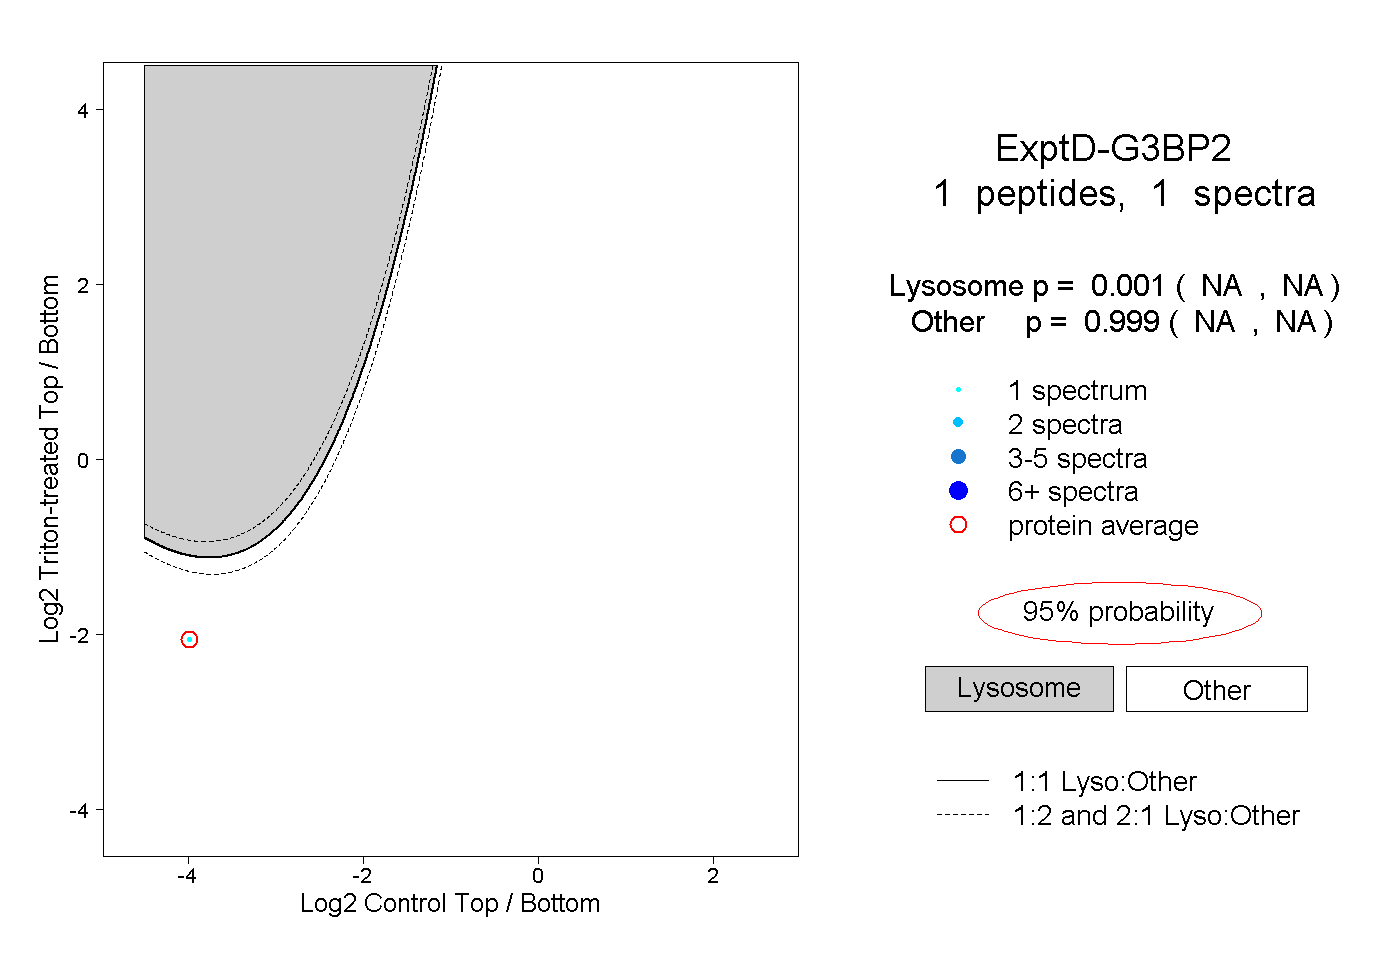
NA | NA
NA | NA