 6
6peptides
spectra
0.000 | 0.000
0.000 | 0.000
0.000 | 0.000
0.038 | 0.140
0.387 | 0.502
0.000 | 0.000
0.314 | 0.332
0.117 | 0.141
| Plot | Mito | Lyso | Perox | ER | Golgi | PM | Cytosol | Nucleus | |||||
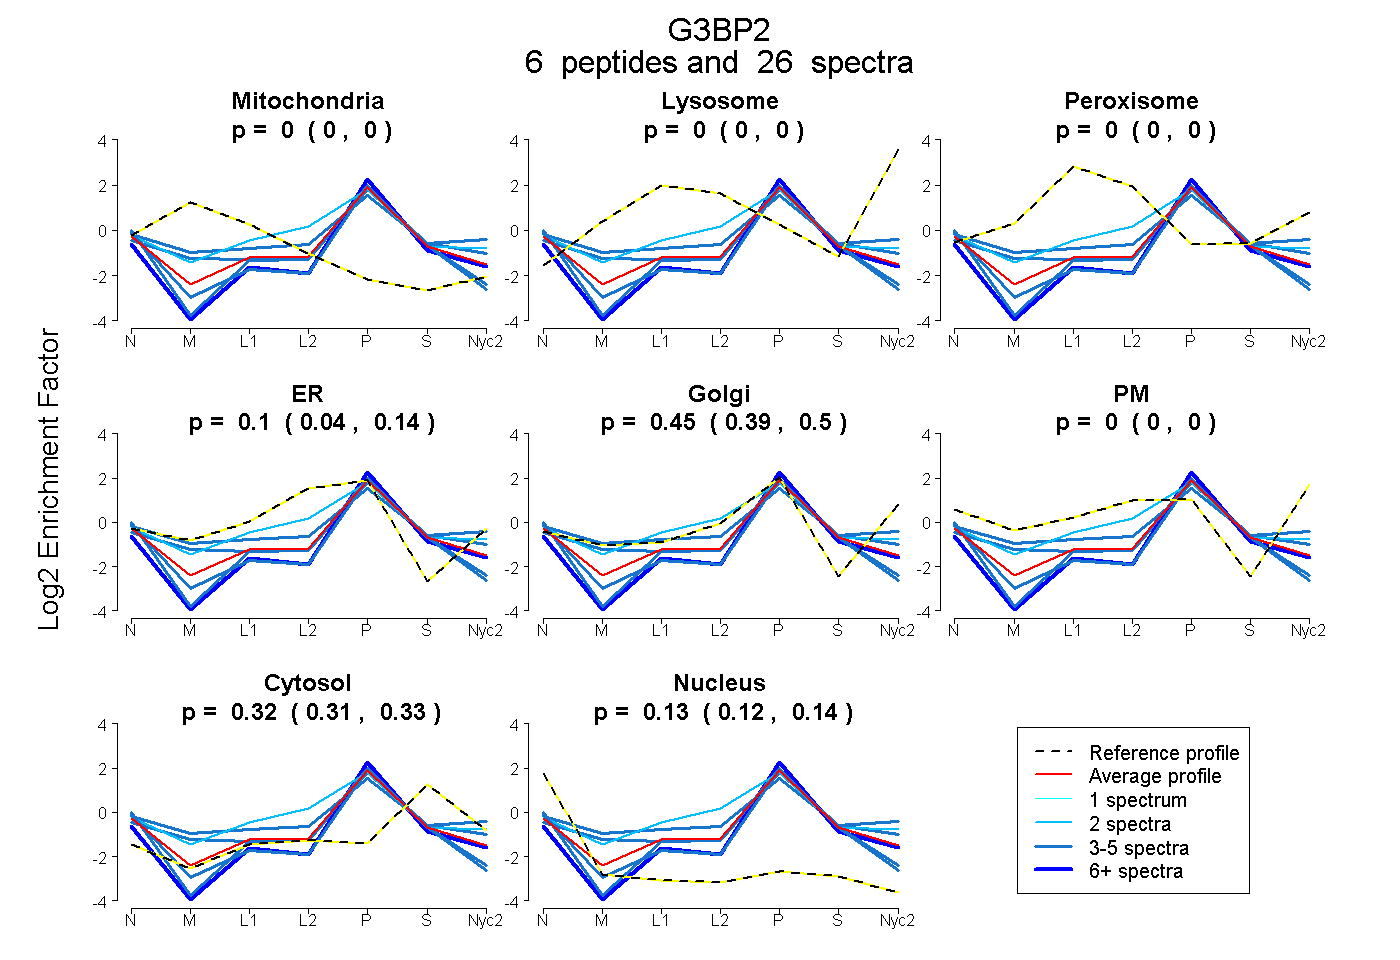
| Expt A |
6 peptides |
26 spectra |
|
0.000 0.000 | 0.000 |
0.000 0.000 | 0.000 |
0.000 0.000 | 0.000 |
0.096 0.038 | 0.140 |
0.449 0.387 | 0.502 |
0.000 0.000 | 0.000 |
0.324 0.314 | 0.332 |
0.131 0.117 | 0.141 |
| 5 spectra, HLEELEEK | 0.000 | 0.000 | 0.000 | 0.275 | 0.131 | 0.000 | 0.339 | 0.255 | ||
| 5 spectra, ERPGFPPR | 0.013 | 0.000 | 0.000 | 0.282 | 0.333 | 0.000 | 0.329 | 0.043 | ||
| 6 spectra, GIVGGGMMR | 0.000 | 0.000 | 0.000 | 0.000 | 0.478 | 0.000 | 0.339 | 0.183 | ||
| 4 spectra, VDAKPEVQSQPPR | 0.000 | 0.000 | 0.000 | 0.000 | 0.426 | 0.000 | 0.302 | 0.272 | ||
| 2 spectra, QYYTLLNK | 0.000 | 0.000 | 0.000 | 0.535 | 0.147 | 0.000 | 0.318 | 0.000 | ||
| 4 spectra, FYVHNDMFR | 0.000 | 0.000 | 0.000 | 0.000 | 0.645 | 0.000 | 0.329 | 0.026 |
| Plot | Mito | Lyso or Perox | ER | Golgi | PM | Cytosol | Nucleus | ||||||
| Expt B |
6 peptides |
13 spectra |
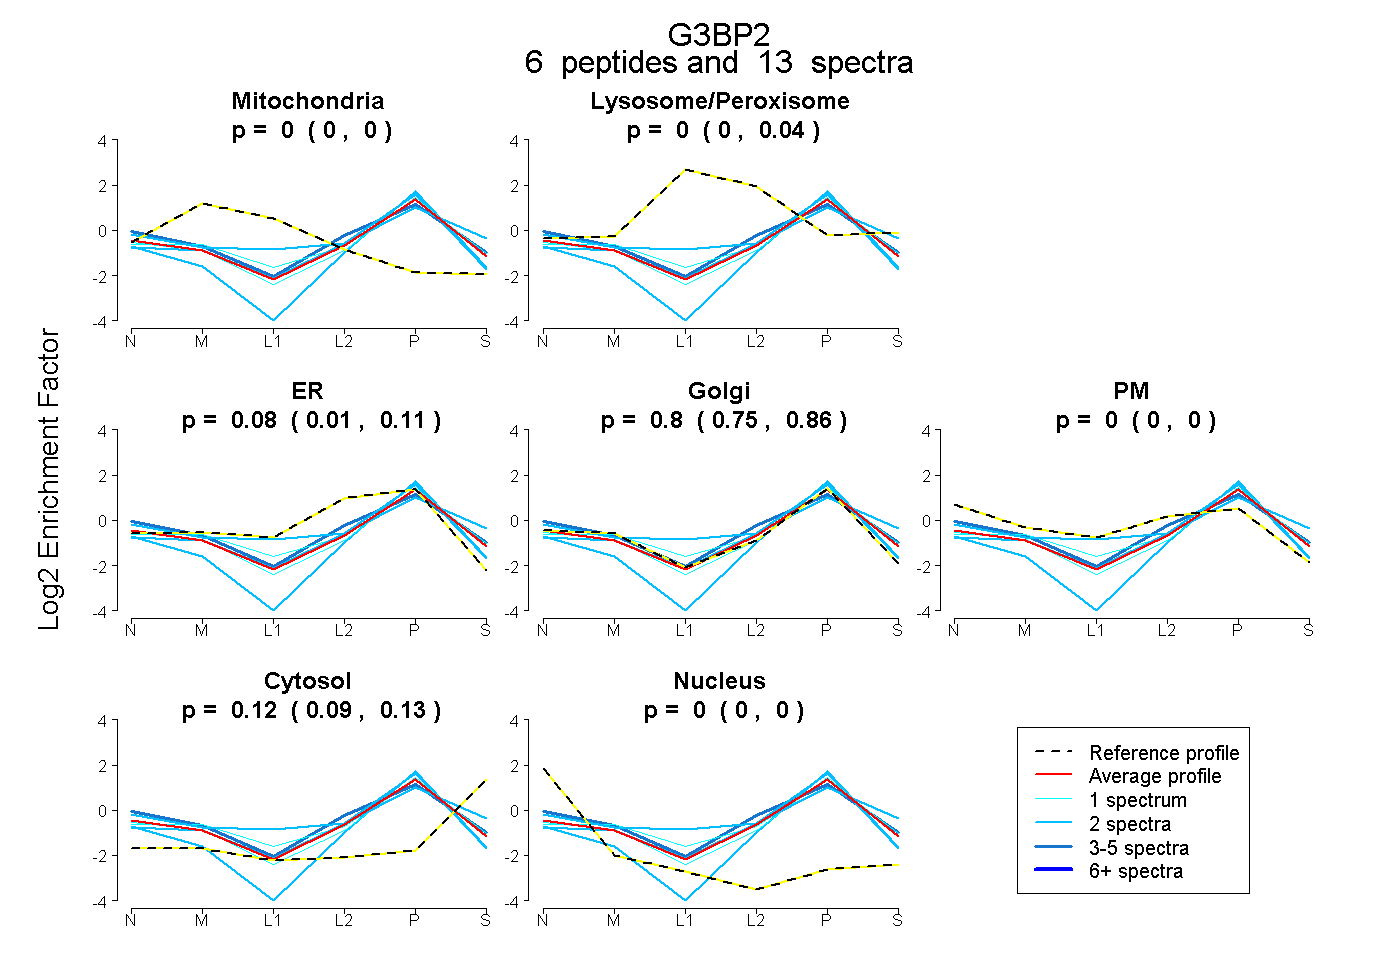 |
0.000 0.000 | 0.000 |
0.000 0.000 | 0.037 |
0.085 0.005 | 0.113 |
0.797 0.753 | 0.859 |
0.000 0.000 | 0.000 |
0.118 0.095 | 0.132 |
0.000 0.000 | 0.000 |
|||
| Plot | Lyso | Other | |||||||||||
| Expt C |
6 peptides |
19 spectra |
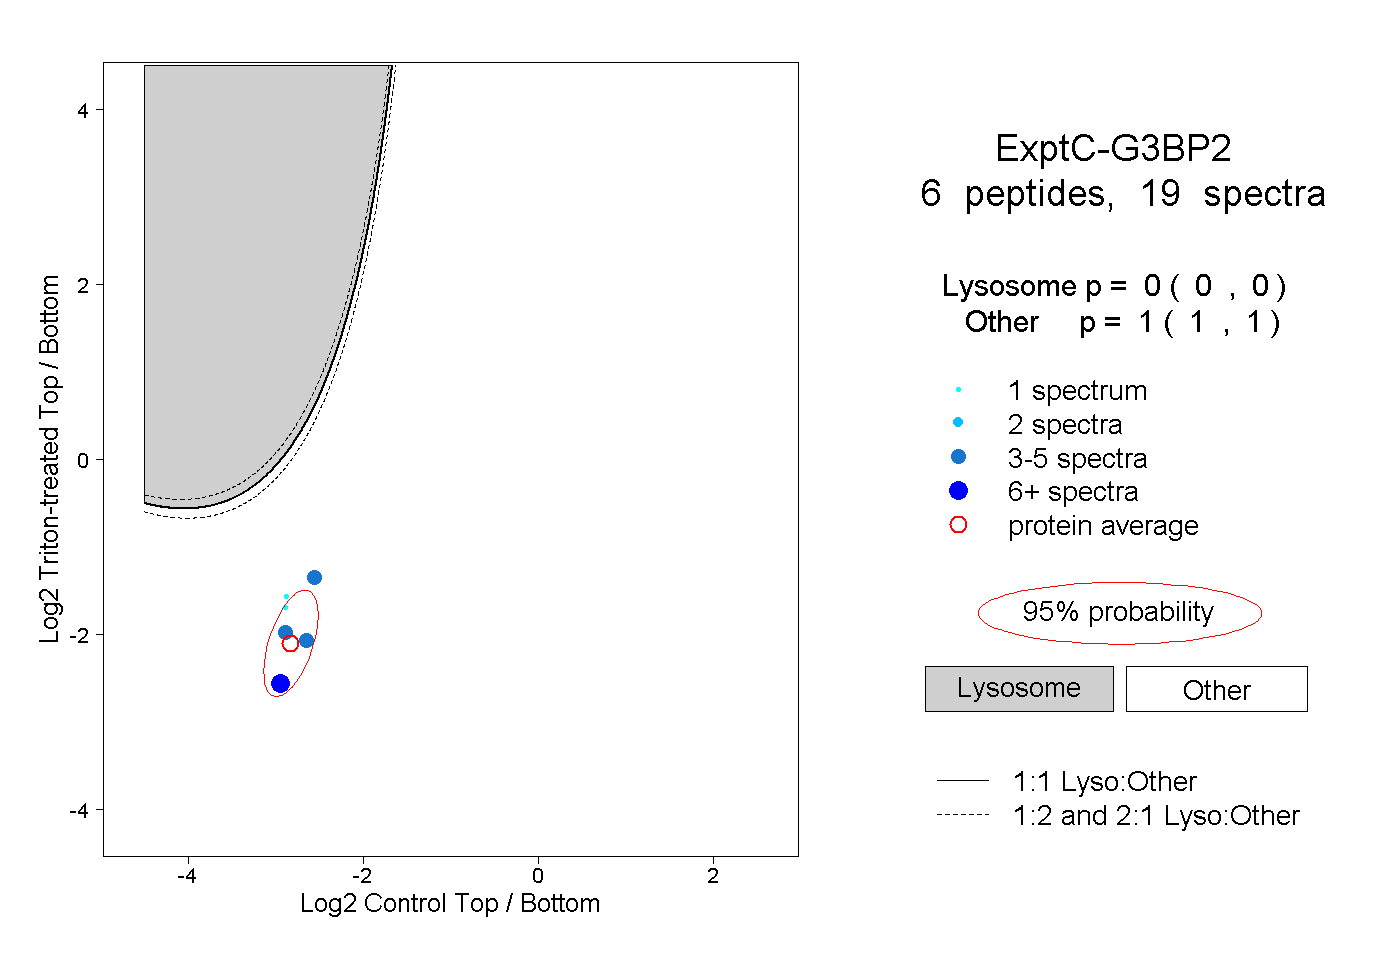 |
0.000 0.000 | 0.000 |
1.000 1.000 | 1.000 |
||||||||
| Plot | Lyso | Other | |||||||||||
| Expt D |
1 peptide |
1 spectrum |
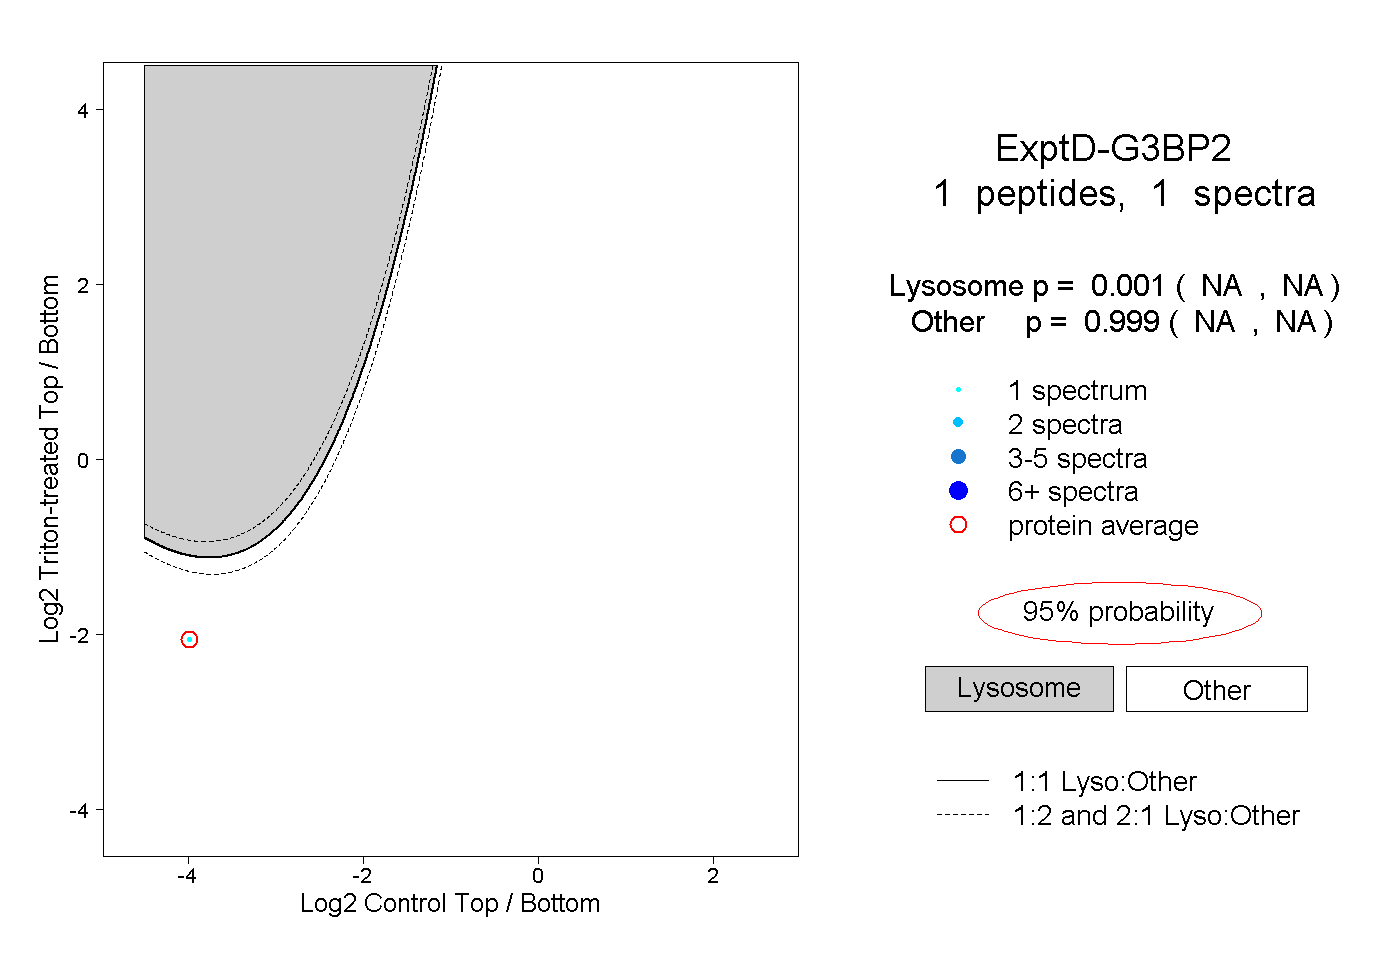 |
0.001 NA | NA |
0.999 NA | NA |