G3BP2
[ENSRNOP00000003346]
Main page
| | | Plot |
Mito |
Lyso |
|
Perox |
ER |
Golgi |
PM |
Cytosol |
Nucleus |
|
| Expt A |
 6
6
peptides |
26
spectra |
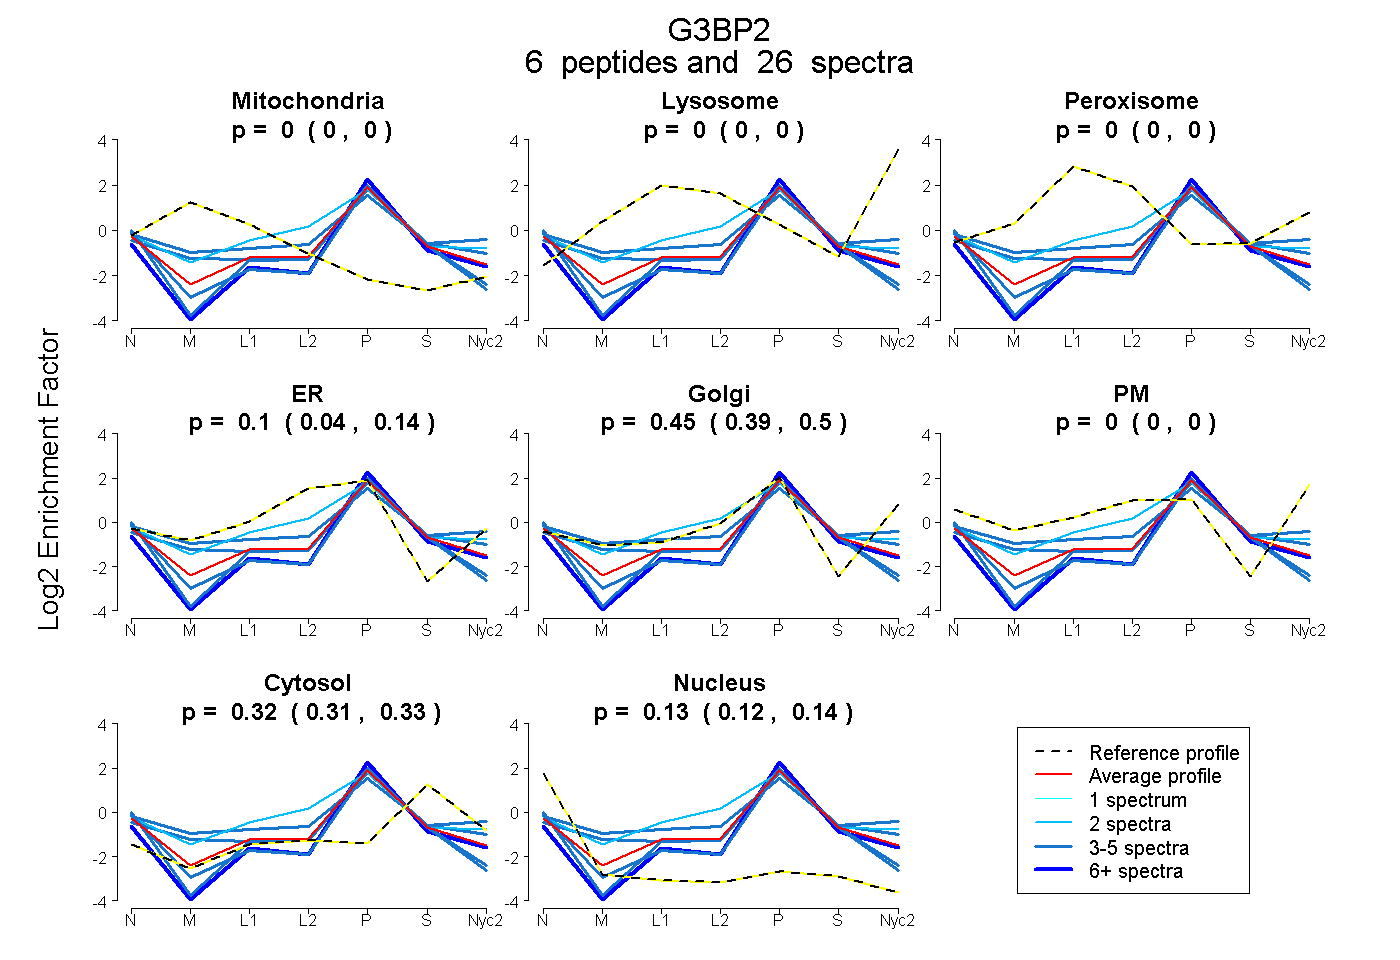 |
0.000
0.000 | 0.000 |
0.000
0.000 | 0.000 |
|
0.000
0.000 | 0.000 |
0.096
0.038 | 0.140 |
0.449
0.387 | 0.502 |
0.000
0.000 | 0.000 |
0.324
0.314 | 0.332 |
0.131
0.117 | 0.141 |
|
| | | Plot |
Mito |
|
Lyso or Perox |
|
ER |
Golgi |
PM |
Cytosol |
Nucleus |
|
| Expt B |
6
peptides |
13
spectra |
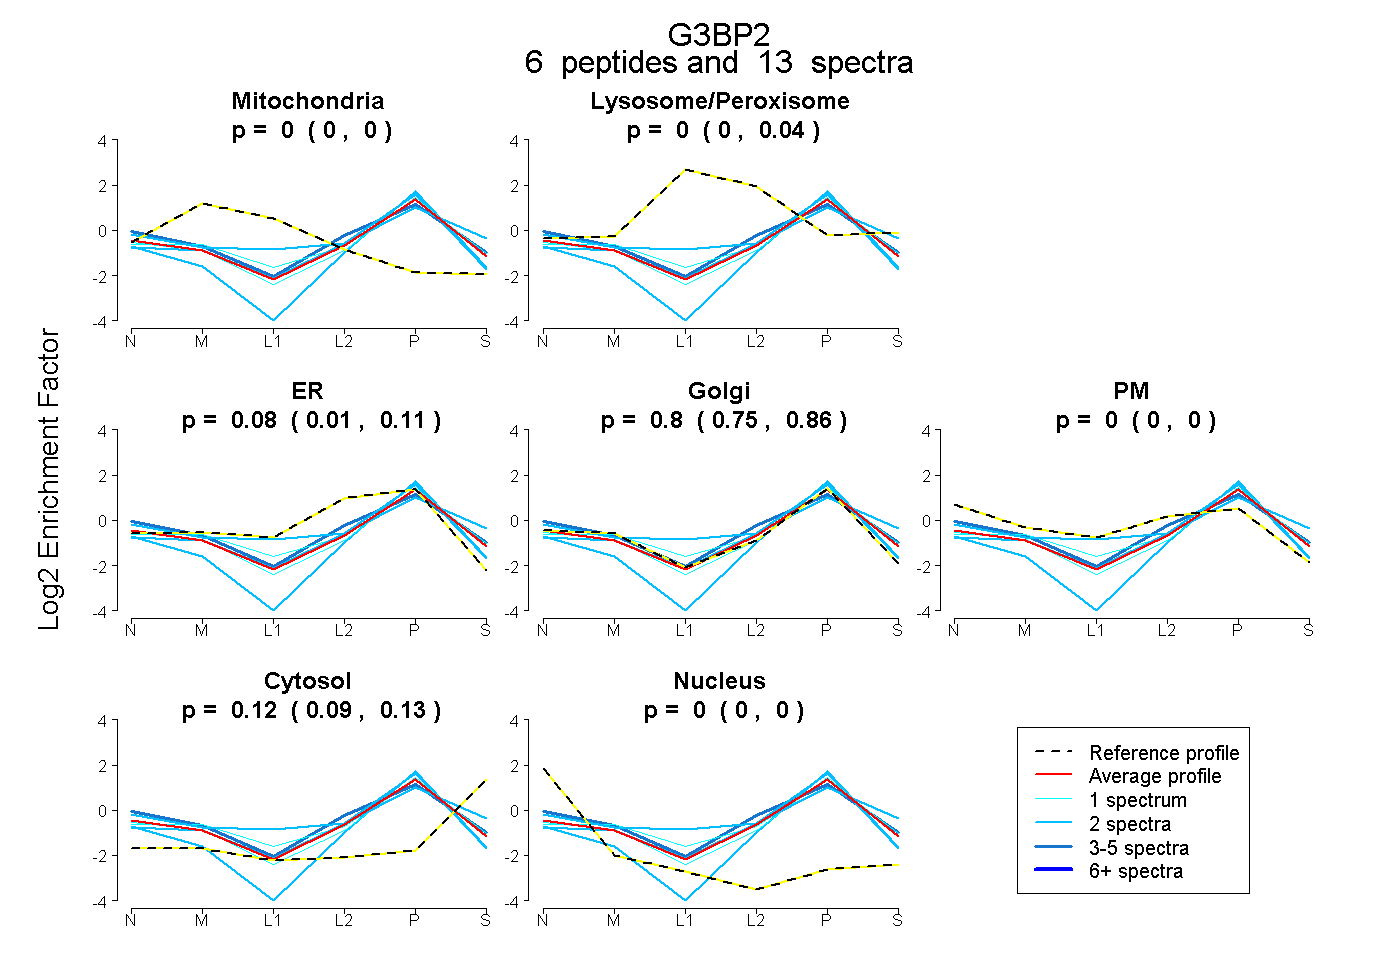 |
0.000
0.000 | 0.000 |
|
0.000
0.000 | 0.037 |
|
0.085
0.005 | 0.113 |
0.797
0.753 | 0.859 |
0.000
0.000 | 0.000 |
0.118
0.095 | 0.132 |
0.000
0.000 | 0.000 |
|
| 2 spectra, HLEELEEK |
0.000 |
|
0.000 |
|
0.000 |
0.933 |
0.000 |
0.067 |
0.000 |
|
| 5 spectra, APEYLHR |
0.000 |
|
0.000 |
|
0.111 |
0.550 |
0.214 |
0.125 |
0.000 |
|
| 1 spectrum, ERPGFPPR |
0.000 |
|
0.099 |
|
0.000 |
0.806 |
0.000 |
0.094 |
0.000 |
|
| 2 spectra, ILIAKPIMFR |
0.000 |
|
0.000 |
|
0.110 |
0.862 |
0.000 |
0.028 |
0.000 |
|
| 2 spectra, VDAKPEVQSQPPR |
0.000 |
|
0.250 |
|
0.000 |
0.590 |
0.000 |
0.160 |
0.000 |
|
| 1 spectrum, QYYTLLNK |
0.000 |
|
0.000 |
|
0.000 |
0.889 |
0.000 |
0.111 |
0.000 |
|
| | | Plot |
|
Lyso |
|
|
|
|
|
|
|
Other |
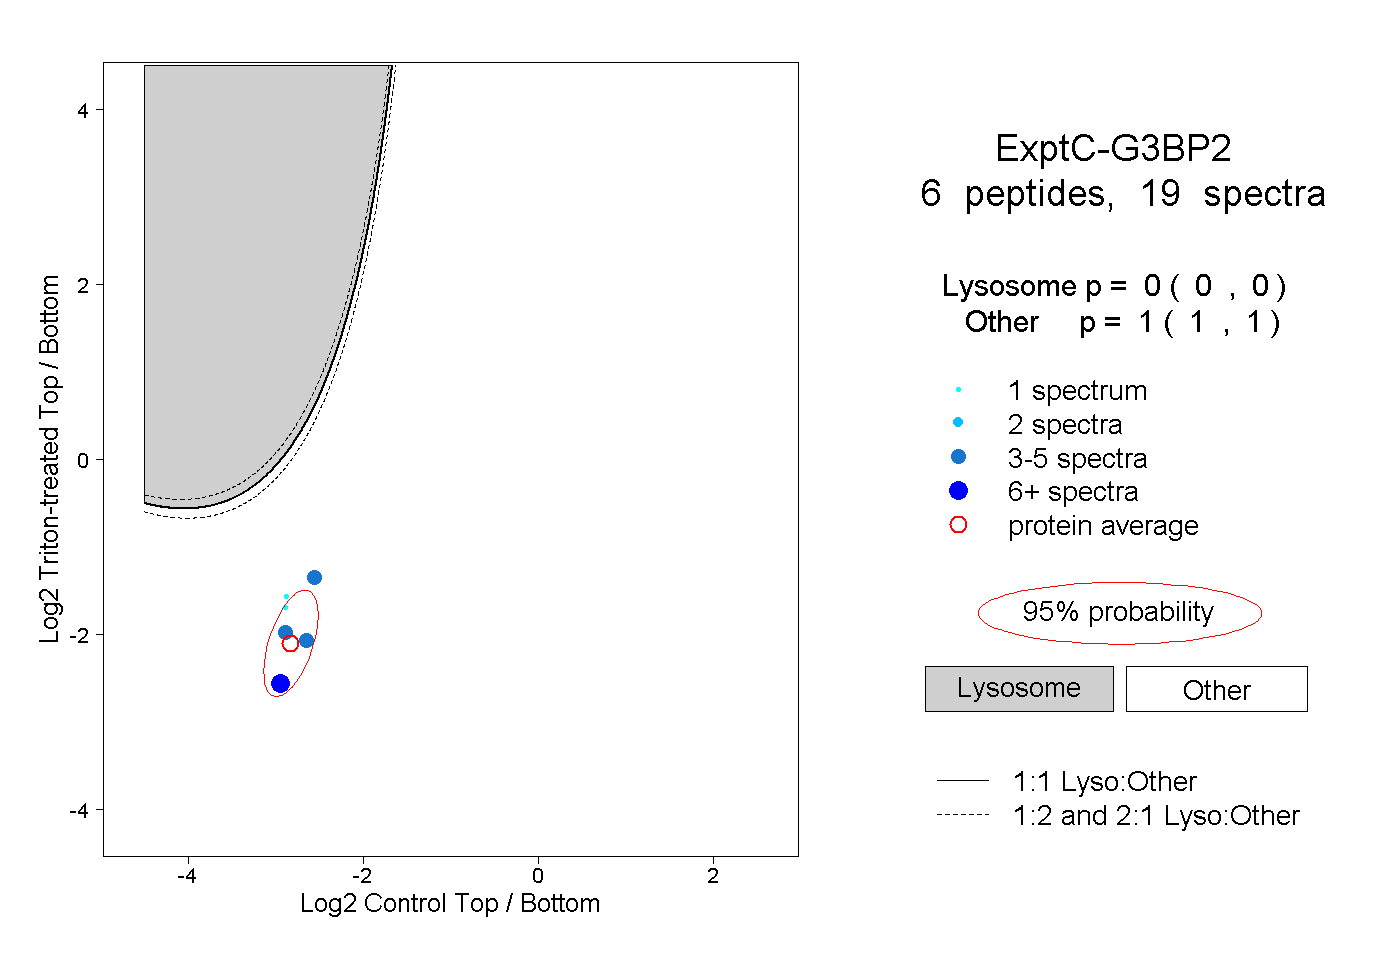
| Expt C |
6
peptides |
19
spectra |
 |
|
0.000
0.000 | 0.000 |
|
|
|
|
|
|
|
1.000
1.000 | 1.000 |
| | | Plot |
|
Lyso |
|
|
|
|
|
|
|
Other |
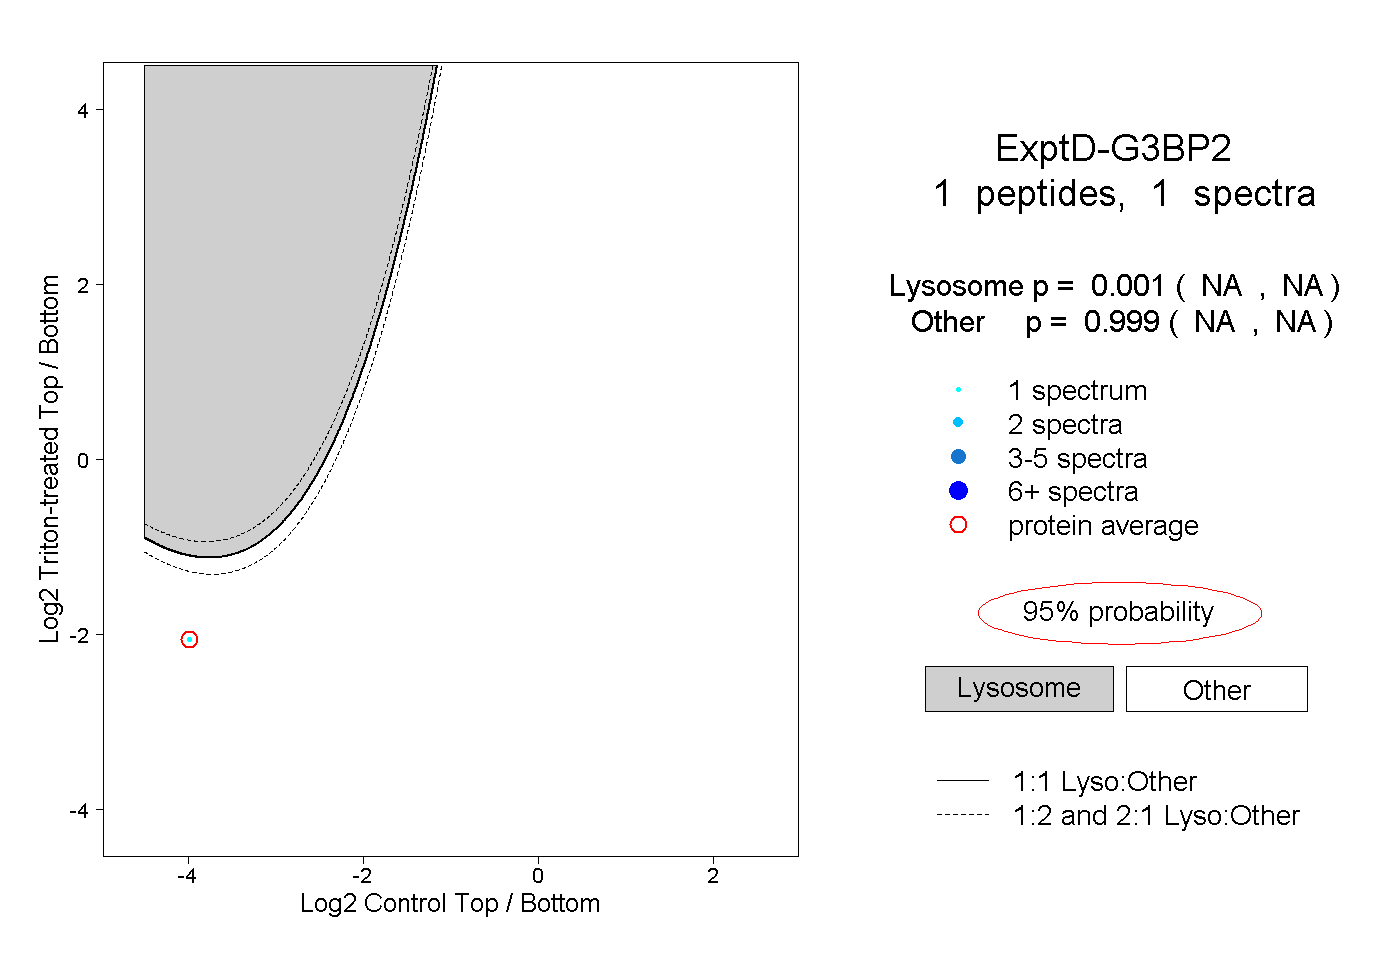
| Expt D |
1
peptide |
1
spectrum |
 |
|
0.001
NA | NA |
|
|
|
|
|
|
|
0.999
NA | NA |