 53
53peptides
spectra

0.000 | 0.000
0.000 | 0.000
0.000 | 0.000
0.015 | 0.038
0.540 | 0.566
0.000 | 0.000
0.262 | 0.266
0.151 | 0.157
7peptides
spectra
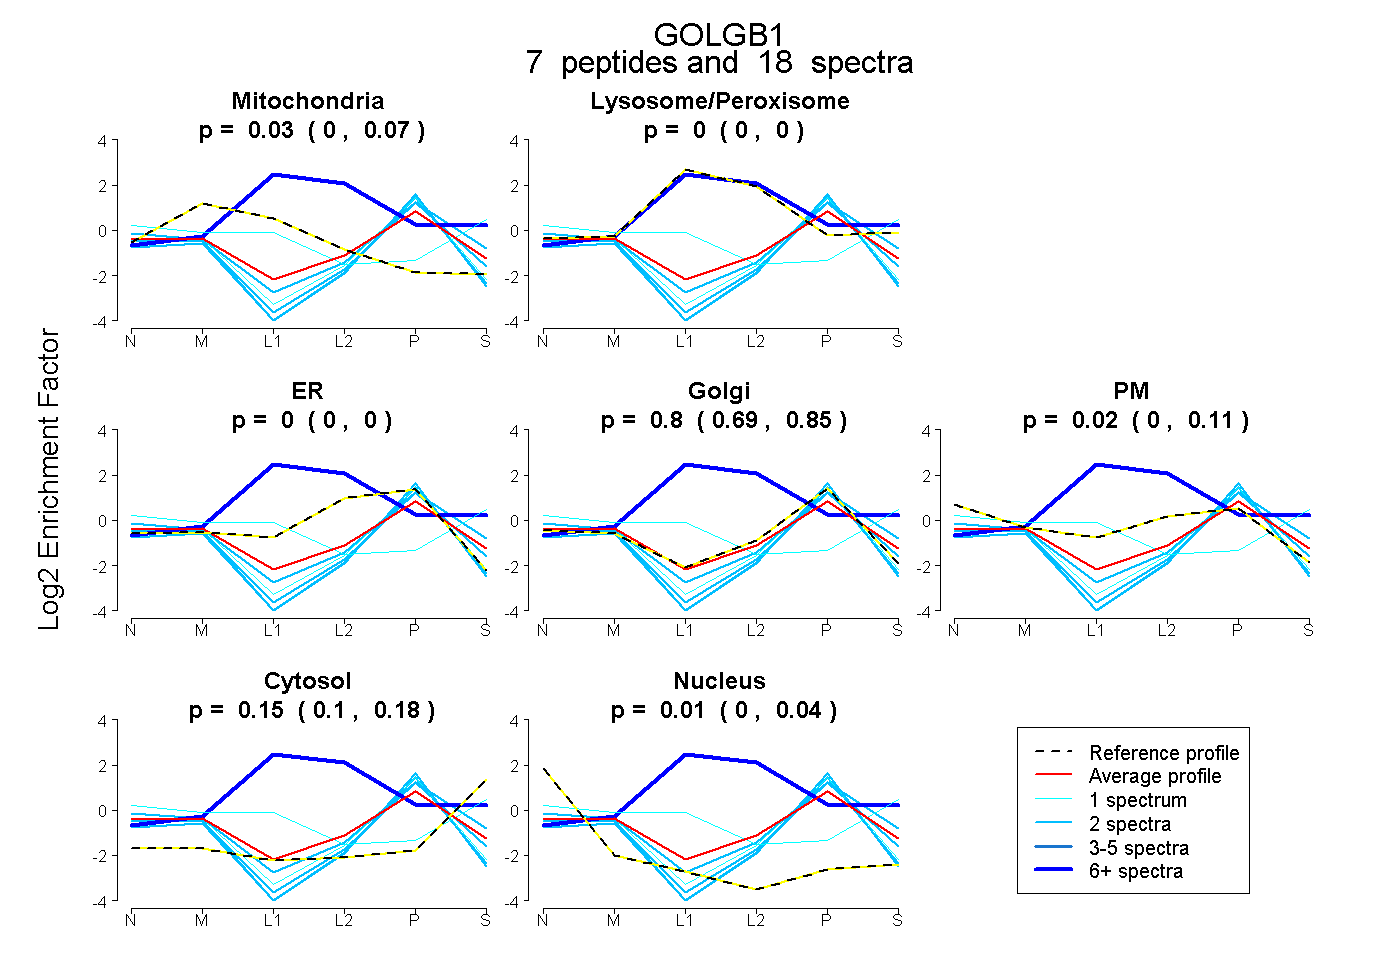
0.000 | 0.070
0.000 | 0.000
0.000 | 0.000
0.690 | 0.851
0.000 | 0.109
0.099 | 0.182
0.000 | 0.039
16peptides
spectra
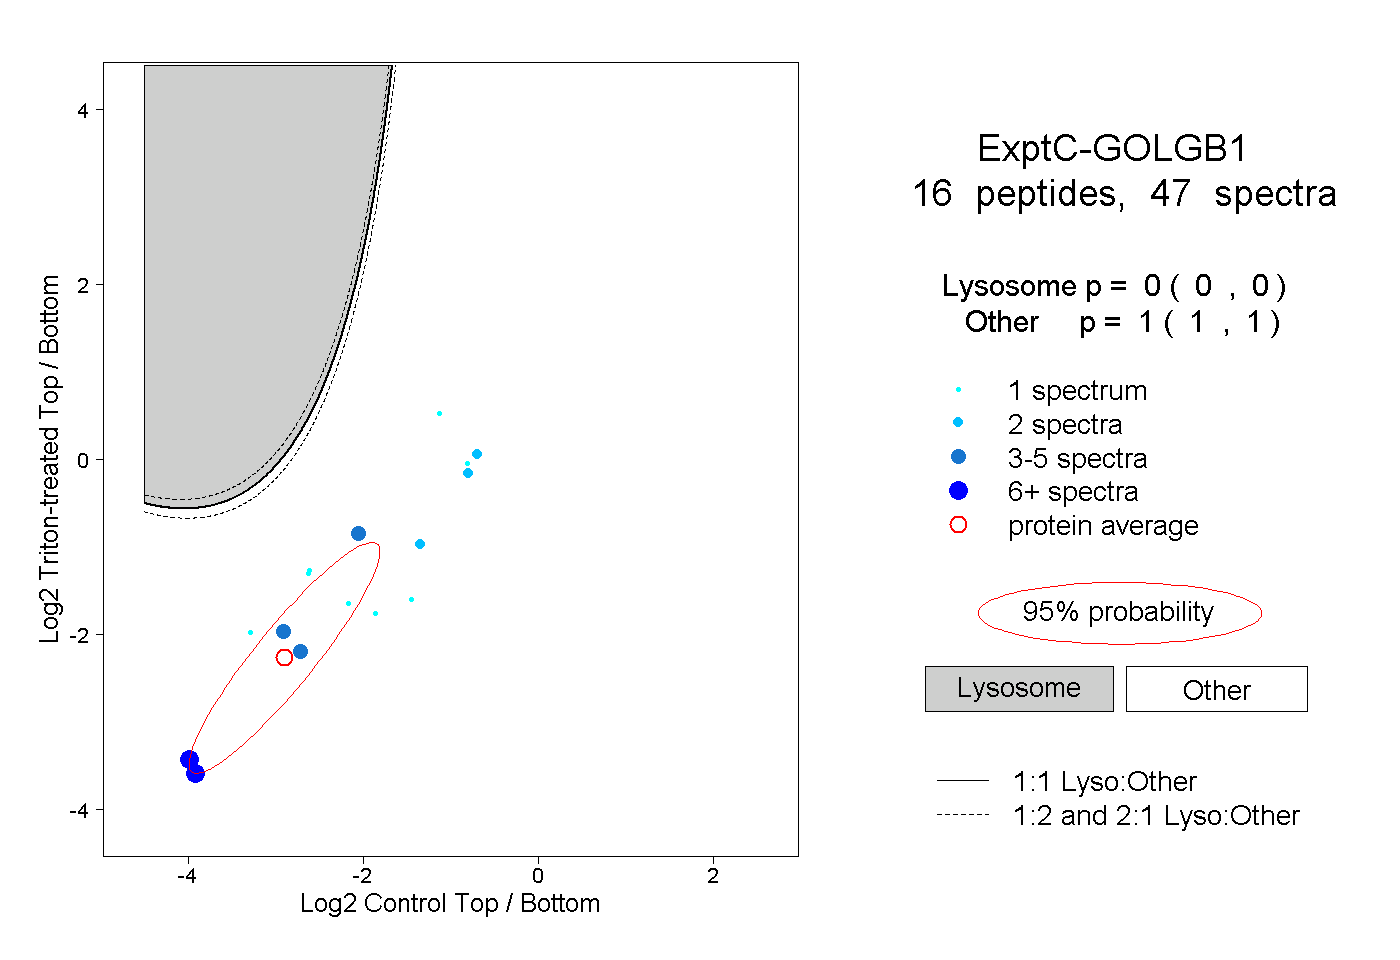
0.000 | 0.000
1.000 | 1.000
4peptides
spectra
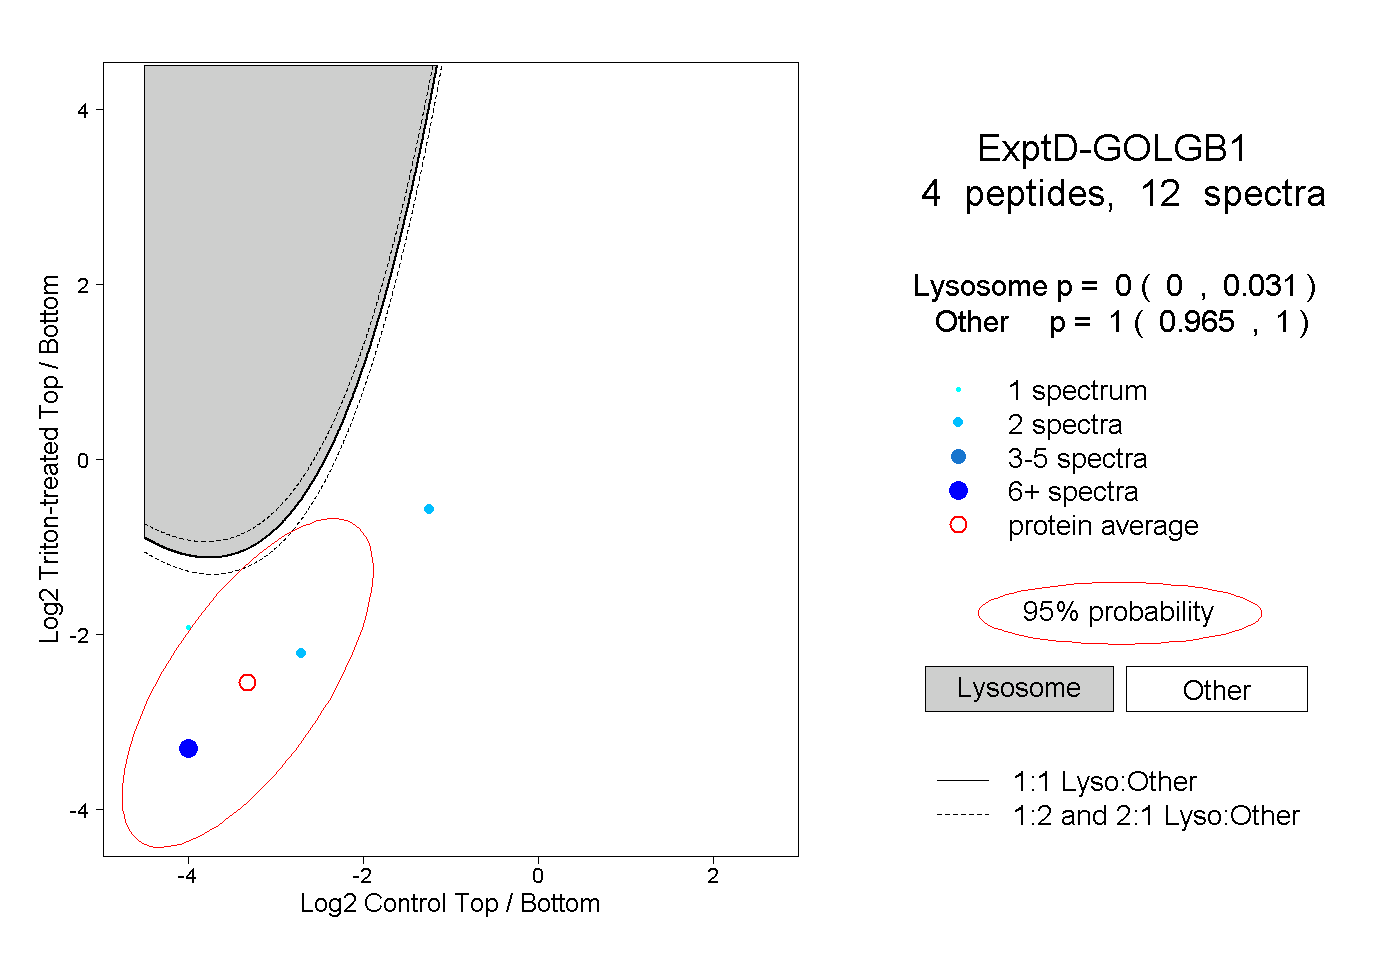
0.000 | 0.031
0.965 | 1.000