 53
53peptides
spectra

0.000 | 0.000
0.000 | 0.000
0.000 | 0.000
0.015 | 0.038
0.540 | 0.566
0.000 | 0.000
0.262 | 0.266
0.151 | 0.157
| Plot | Mito | Lyso | Perox | ER | Golgi | PM | Cytosol | Nucleus | |||||
| Expt A |
53 peptides |
103 spectra |
|
0.000 0.000 | 0.000 |
0.000 0.000 | 0.000 |
0.000 0.000 | 0.000 |
0.027 0.015 | 0.038 |
0.554 0.540 | 0.566 |
0.000 0.000 | 0.000 |
0.264 0.262 | 0.266 |
0.154 0.151 | 0.157 |
| 1 spectrum, TLQPELETLQK | 0.000 | 0.000 | 0.000 | 0.000 | 0.581 | 0.000 | 0.221 | 0.198 | ||
| 1 spectrum, AAAEEELQALVQR | 0.042 | 0.000 | 0.000 | 0.164 | 0.417 | 0.000 | 0.368 | 0.009 | ||
| 2 spectra, RPEGDYEVLDR | 0.000 | 0.000 | 0.092 | 0.543 | 0.000 | 0.000 | 0.364 | 0.000 | ||
| 2 spectra, LLEEEVAK | 0.080 | 0.000 | 0.082 | 0.321 | 0.284 | 0.000 | 0.215 | 0.018 | ||
| 2 spectra, FNCEQLETDLTASR | 0.000 | 0.000 | 0.000 | 0.000 | 0.575 | 0.000 | 0.149 | 0.276 | ||
| 1 spectrum, AGQAQAELEMQYGTLQQR | 0.000 | 0.000 | 0.457 | 0.000 | 0.000 | 0.314 | 0.229 | 0.000 | ||
| 1 spectrum, EAQEEIAFLK | 0.000 | 0.000 | 0.000 | 0.000 | 0.586 | 0.000 | 0.323 | 0.090 | ||
| 2 spectra, AASHEAK | 0.000 | 0.000 | 0.000 | 0.000 | 0.661 | 0.000 | 0.130 | 0.209 | ||
| 2 spectra, SQEQDSLSENAK | 0.000 | 0.000 | 0.000 | 0.000 | 0.547 | 0.000 | 0.224 | 0.229 | ||
| 2 spectra, ITLLEAQNR | 0.000 | 0.000 | 0.000 | 0.000 | 0.581 | 0.000 | 0.267 | 0.152 | ||
| 1 spectrum, DHLWNELEK | 0.000 | 0.000 | 0.000 | 0.000 | 0.675 | 0.000 | 0.325 | 0.000 | ||
| 1 spectrum, DALQQELEWLR | 0.000 | 0.000 | 0.000 | 0.042 | 0.452 | 0.000 | 0.216 | 0.290 | ||
| 2 spectra, AQAELSSFK | 0.000 | 0.000 | 0.000 | 0.000 | 0.641 | 0.000 | 0.260 | 0.099 | ||
| 1 spectrum, ELQELLK | 0.113 | 0.000 | 0.077 | 0.000 | 0.000 | 0.533 | 0.277 | 0.000 | ||
| 1 spectrum, NILSTQLR | 0.000 | 0.000 | 0.000 | 0.000 | 0.620 | 0.000 | 0.125 | 0.255 | ||
| 2 spectra, GNLAQAVEHHK | 0.081 | 0.000 | 0.000 | 0.484 | 0.000 | 0.000 | 0.321 | 0.114 | ||
| 1 spectrum, DLVEMEQK | 0.000 | 0.000 | 0.000 | 0.165 | 0.419 | 0.000 | 0.256 | 0.160 | ||
| 1 spectrum, SLLENQSLGGSCESLK | 0.000 | 0.000 | 0.000 | 0.484 | 0.158 | 0.000 | 0.314 | 0.044 | ||
| 8 spectra, VLELENEK | 0.000 | 0.000 | 0.000 | 0.000 | 0.458 | 0.000 | 0.167 | 0.375 | ||
| 1 spectrum, LIVEMDK | 0.038 | 0.000 | 0.000 | 0.147 | 0.482 | 0.000 | 0.261 | 0.072 | ||
| 1 spectrum, IAESTEWQEK | 0.000 | 0.056 | 0.000 | 0.000 | 0.735 | 0.000 | 0.209 | 0.000 | ||
| 2 spectra, SSAEMEDFVLMR | 0.000 | 0.000 | 0.000 | 0.000 | 0.412 | 0.000 | 0.279 | 0.309 | ||
| 2 spectra, IADLEHLK | 0.000 | 0.000 | 0.000 | 0.000 | 0.524 | 0.000 | 0.250 | 0.226 | ||
| 1 spectrum, DQQVTELSFSMTEK | 0.067 | 0.000 | 0.000 | 0.254 | 0.000 | 0.000 | 0.458 | 0.221 | ||
| 1 spectrum, AQLDSFVK | 0.000 | 0.000 | 0.000 | 0.000 | 0.634 | 0.000 | 0.195 | 0.171 | ||
| 2 spectra, ILELEEENDR | 0.000 | 0.000 | 0.000 | 0.000 | 0.428 | 0.000 | 0.155 | 0.418 | ||
| 2 spectra, TNQLTEALETIK | 0.000 | 0.000 | 0.000 | 0.522 | 0.043 | 0.000 | 0.435 | 0.000 | ||
| 1 spectrum, QQEADIQNCK | 0.256 | 0.000 | 0.055 | 0.000 | 0.591 | 0.000 | 0.097 | 0.000 | ||
| 2 spectra, ELEEDSK | 0.000 | 0.000 | 0.000 | 0.000 | 0.550 | 0.000 | 0.271 | 0.179 | ||
| 4 spectra, ELSQTLENEK | 0.000 | 0.000 | 0.000 | 0.000 | 0.589 | 0.000 | 0.243 | 0.168 | ||
| 2 spectra, QMTIHMEELK | 0.000 | 0.000 | 0.000 | 0.050 | 0.670 | 0.000 | 0.191 | 0.088 | ||
| 2 spectra, SLQEQLSSAR | 0.000 | 0.000 | 0.000 | 0.000 | 0.511 | 0.000 | 0.142 | 0.347 | ||
| 1 spectrum, LTISEK | 0.000 | 0.137 | 0.000 | 0.560 | 0.137 | 0.000 | 0.166 | 0.000 | ||
| 3 spectra, STLTAVCEER | 0.000 | 0.000 | 0.000 | 0.115 | 0.463 | 0.000 | 0.347 | 0.074 | ||
| 1 spectrum, EQLSLLSR | 0.000 | 0.000 | 0.000 | 0.076 | 0.547 | 0.000 | 0.377 | 0.000 | ||
| 5 spectra, ESEVLEGAER | 0.000 | 0.000 | 0.000 | 0.187 | 0.304 | 0.000 | 0.211 | 0.298 | ||
| 2 spectra, LALLQEER | 0.000 | 0.000 | 0.000 | 0.000 | 0.514 | 0.000 | 0.106 | 0.380 | ||
| 1 spectrum, TQVLELETSLHTAK | 0.009 | 0.056 | 0.117 | 0.000 | 0.467 | 0.142 | 0.210 | 0.000 | ||
| 1 spectrum, SLQSQLQTK | 0.000 | 0.000 | 0.000 | 0.000 | 0.588 | 0.000 | 0.140 | 0.273 | ||
| 1 spectrum, AQLQESQDQTK | 0.000 | 0.000 | 0.000 | 0.000 | 0.418 | 0.000 | 0.202 | 0.380 | ||
| 3 spectra, SMSSLQDSR | 0.000 | 0.000 | 0.000 | 0.000 | 0.607 | 0.000 | 0.134 | 0.259 | ||
| 4 spectra, IAELEMEK | 0.000 | 0.000 | 0.000 | 0.032 | 0.484 | 0.000 | 0.155 | 0.329 | ||
| 2 spectra, EMEELSQALSQK | 0.158 | 0.000 | 0.000 | 0.000 | 0.568 | 0.000 | 0.258 | 0.016 | ||
| 1 spectrum, MTQDLQNK | 0.000 | 0.174 | 0.014 | 0.000 | 0.596 | 0.013 | 0.202 | 0.000 | ||
| 3 spectra, ELDVLGELR | 0.000 | 0.000 | 0.000 | 0.000 | 0.531 | 0.000 | 0.248 | 0.222 | ||
| 2 spectra, ALHTQLEMQAK | 0.129 | 0.000 | 0.000 | 0.083 | 0.453 | 0.000 | 0.335 | 0.000 | ||
| 3 spectra, ILLDDTQSEAAR | 0.000 | 0.000 | 0.000 | 0.000 | 0.473 | 0.000 | 0.274 | 0.254 | ||
| 3 spectra, ETSVSSPPR | 0.000 | 0.000 | 0.000 | 0.182 | 0.327 | 0.000 | 0.490 | 0.000 | ||
| 2 spectra, LDALHR | 0.000 | 0.000 | 0.000 | 0.000 | 0.484 | 0.000 | 0.287 | 0.229 | ||
| 3 spectra, LADAEK | 0.000 | 0.000 | 0.000 | 0.000 | 0.547 | 0.000 | 0.166 | 0.287 | ||
| 2 spectra, DVLCAPR | 0.000 | 0.000 | 0.000 | 0.532 | 0.000 | 0.000 | 0.201 | 0.267 | ||
| 1 spectrum, ELETSLAEAEK | 0.000 | 0.000 | 0.000 | 0.167 | 0.204 | 0.000 | 0.221 | 0.408 | ||
| 2 spectra, VAELAR | 0.000 | 0.000 | 0.000 | 0.000 | 0.611 | 0.000 | 0.097 | 0.292 |
| Plot | Mito | Lyso or Perox | ER | Golgi | PM | Cytosol | Nucleus | ||||||
| Expt B |
7 peptides |
18 spectra |
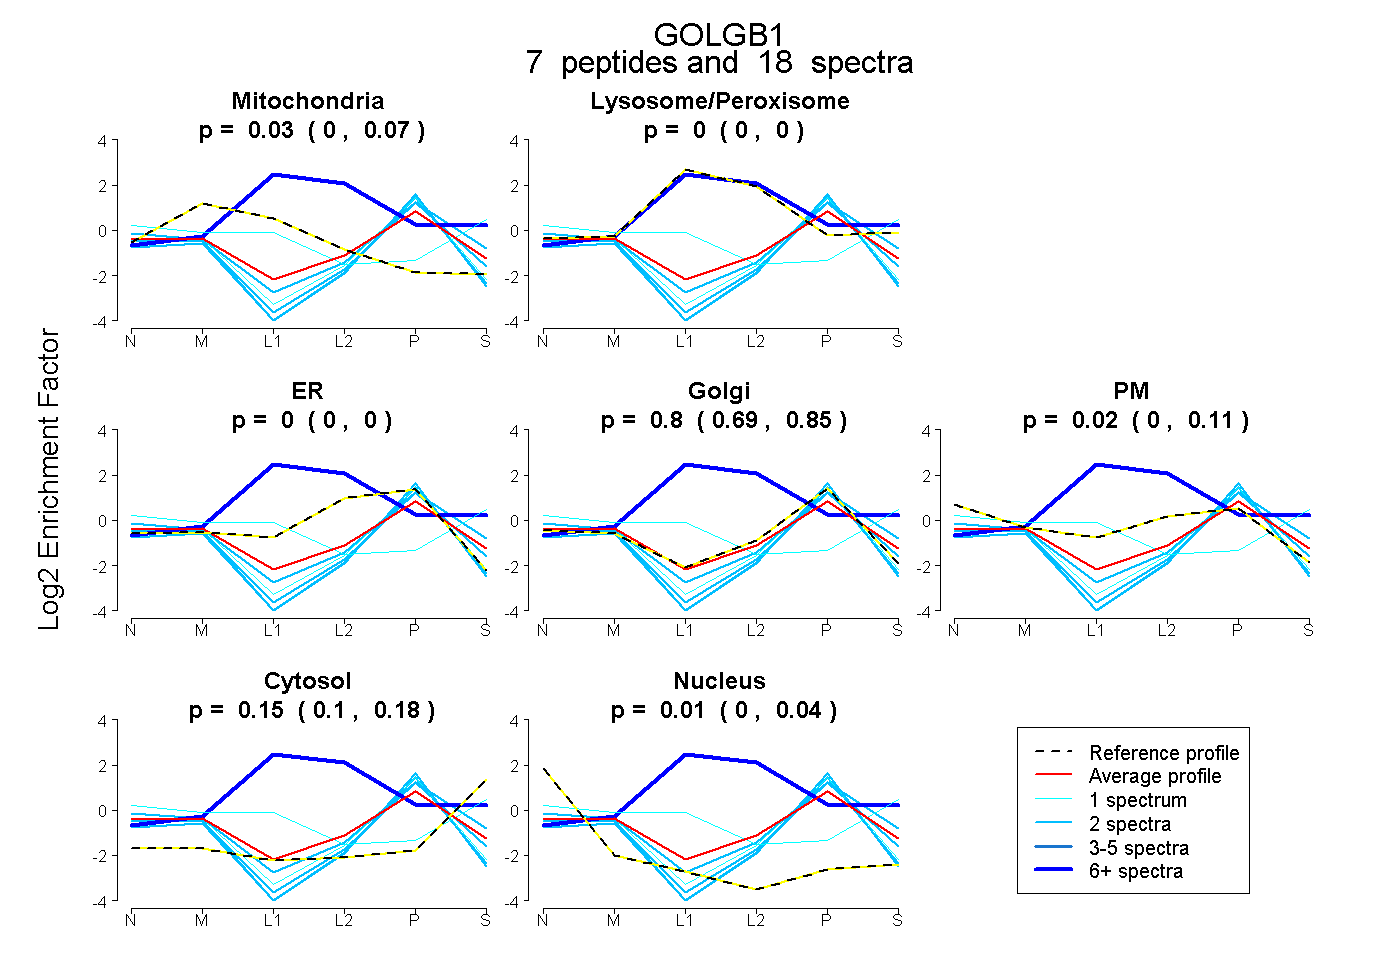 |
0.026 0.000 | 0.070 |
0.000 0.000 | 0.000 |
0.000 0.000 | 0.000 |
0.797 0.690 | 0.851 |
0.023 0.000 | 0.109 |
0.147 0.099 | 0.182 |
0.007 0.000 | 0.039 |
|||
| Plot | Lyso | Other | |||||||||||
| Expt C |
16 peptides |
47 spectra |
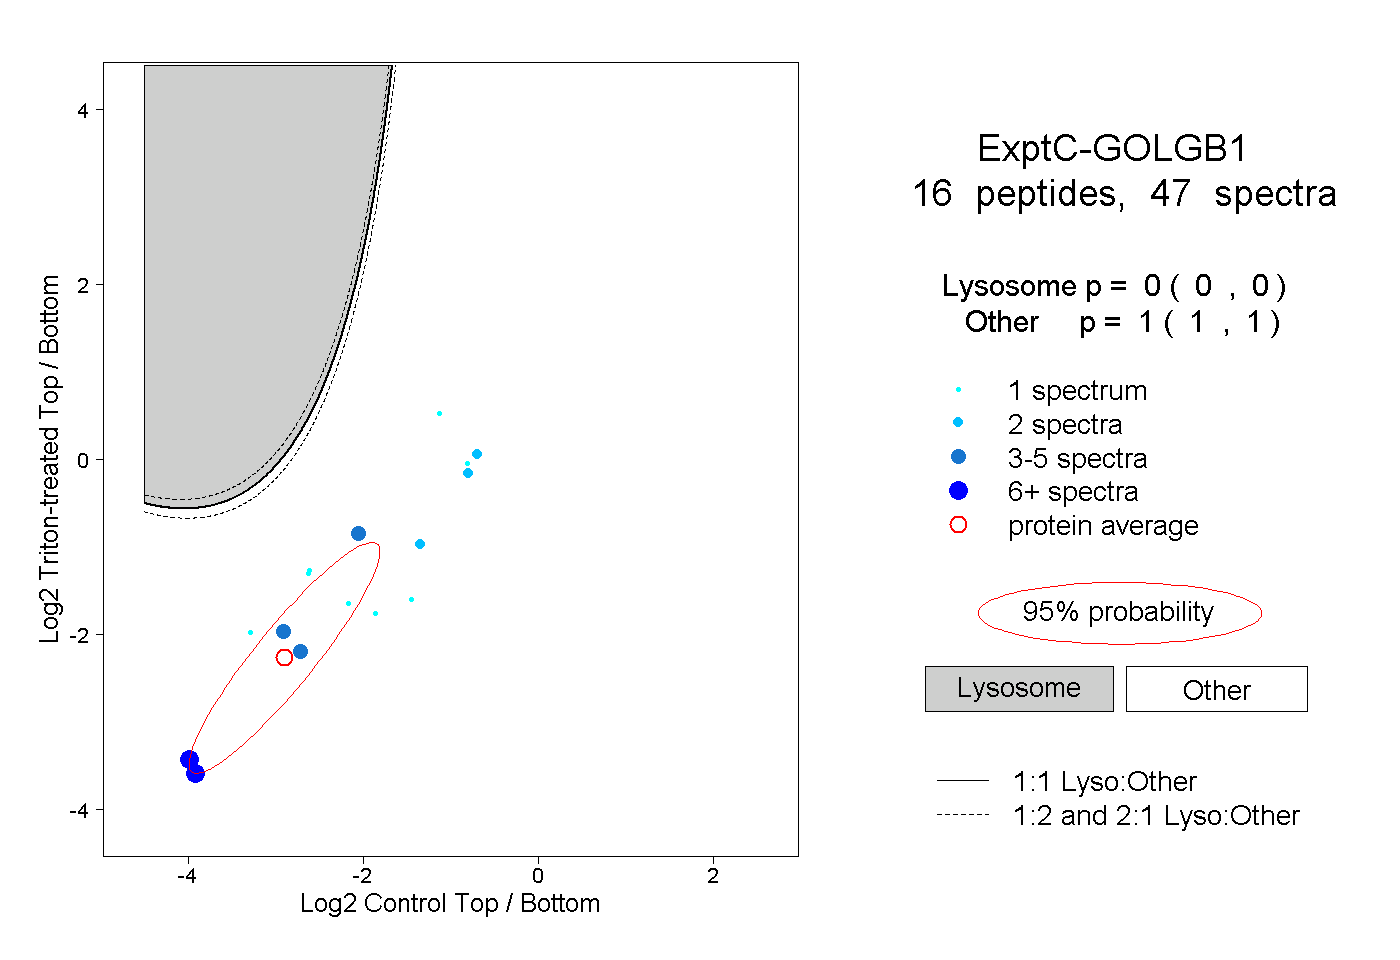 |
0.000 0.000 | 0.000 |
1.000 1.000 | 1.000 |
||||||||
| Plot | Lyso | Other | |||||||||||
| Expt D |
4 peptides |
12 spectra |
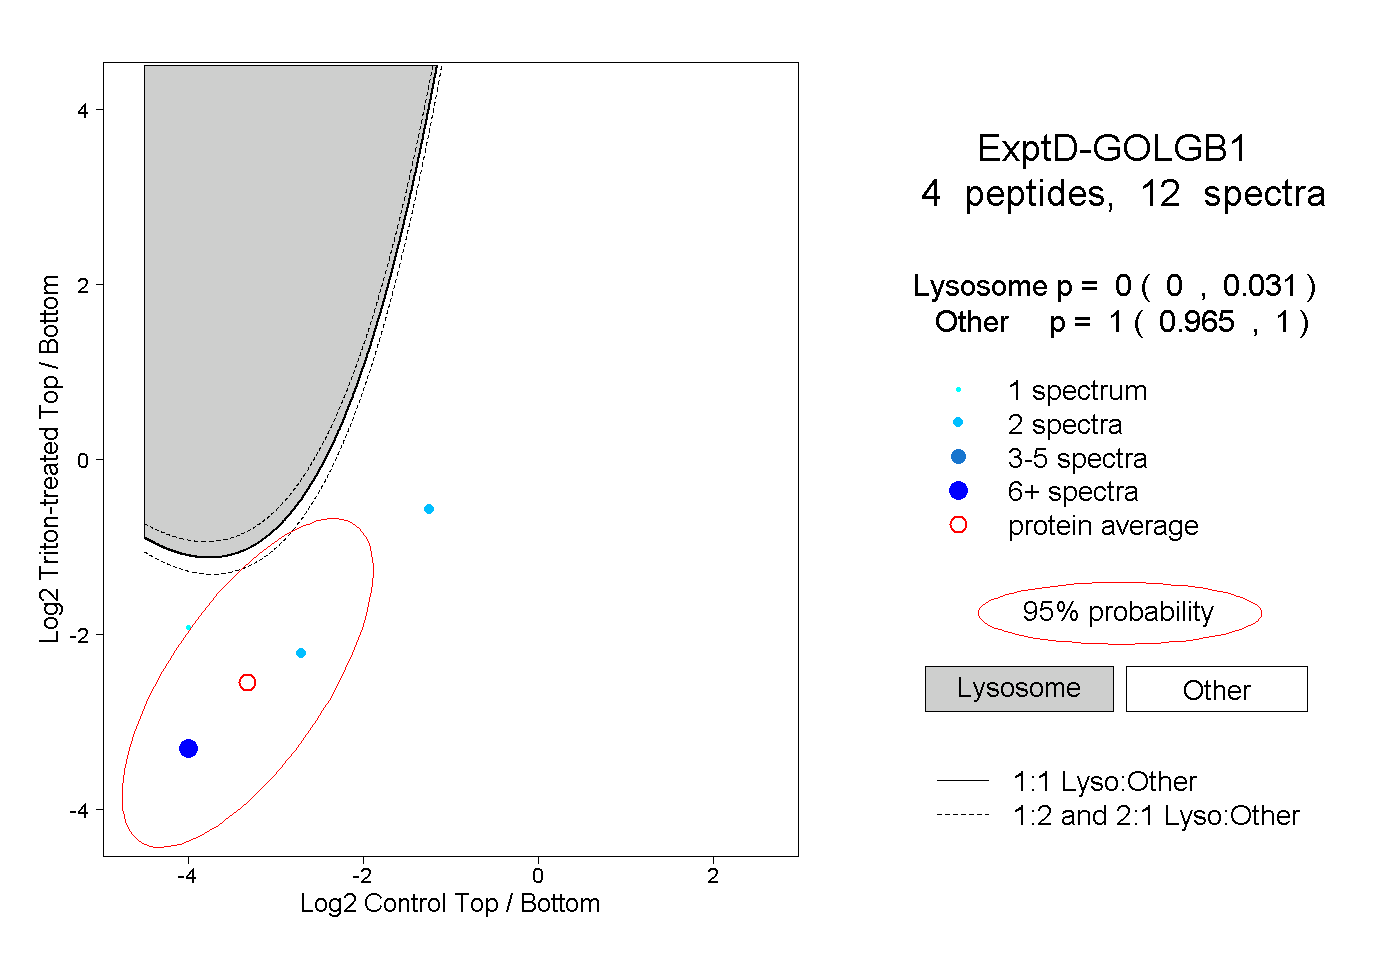 |
0.000 0.000 | 0.031 |
1.000 0.965 | 1.000 |