GOLGB1
[ENSRNOP00000003255]
Main page
| | | Plot |
Mito |
Lyso |
|
Perox |
ER |
Golgi |
PM |
Cytosol |
Nucleus |
|
| Expt A |
 53
53
peptides |
103
spectra |
 |
0.000
0.000 | 0.000 |
0.000
0.000 | 0.000 |
|
0.000
0.000 | 0.000 |
0.027
0.015 | 0.038 |
0.554
0.540 | 0.566 |
0.000
0.000 | 0.000 |
0.264
0.262 | 0.266 |
0.154
0.151 | 0.157 |
|
| | | Plot |
Mito |
|
Lyso or Perox |
|
ER |
Golgi |
PM |
Cytosol |
Nucleus |
|
| Expt B |
7
peptides |
18
spectra |
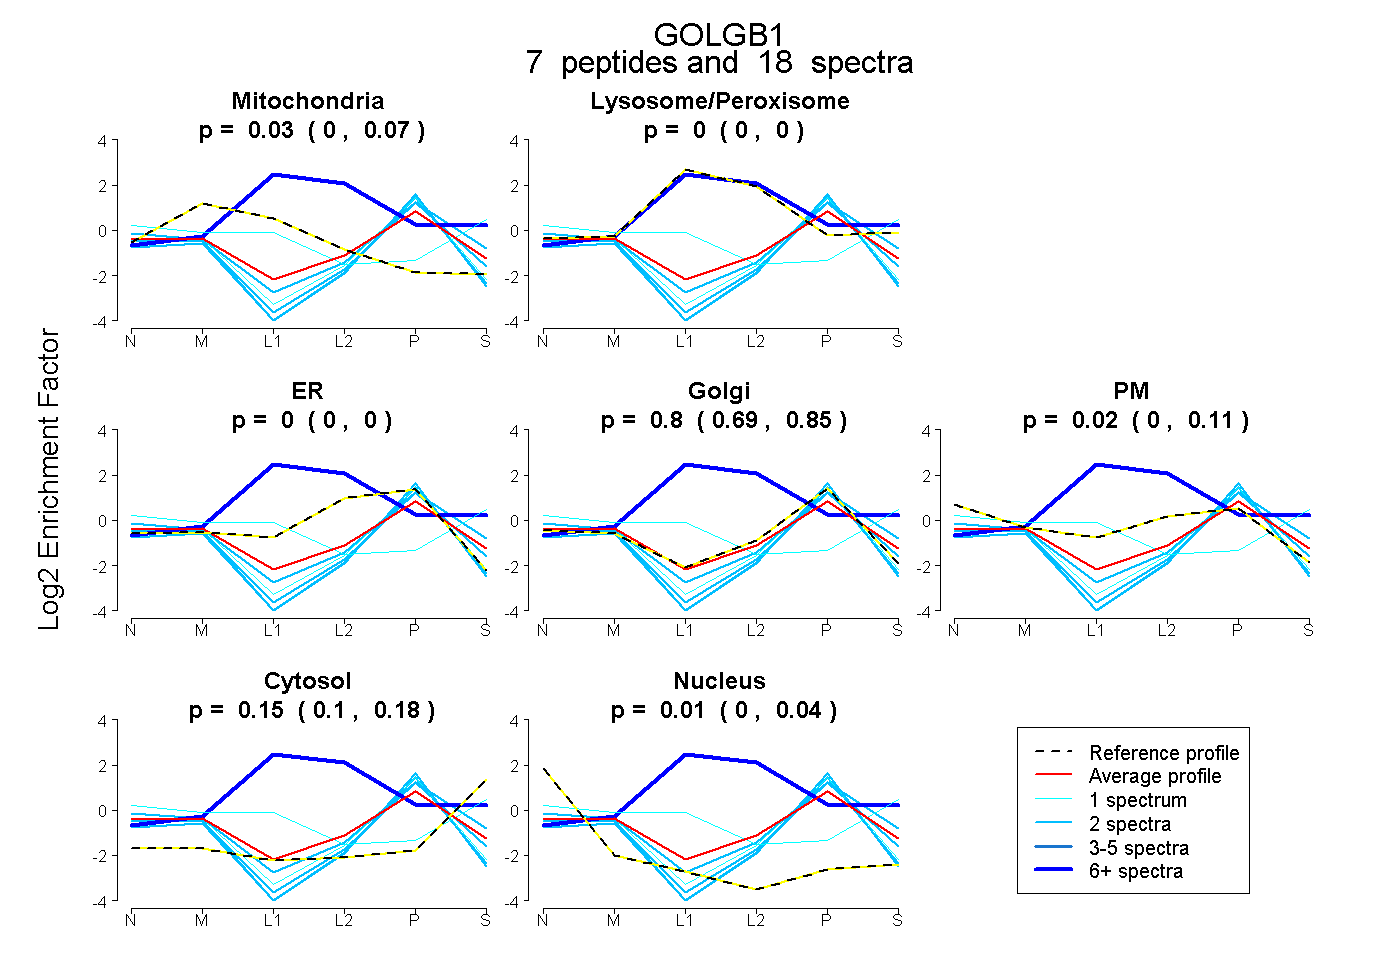 |
0.026
0.000 | 0.070 |
|
0.000
0.000 | 0.000 |
|
0.000
0.000 | 0.000 |
0.797
0.690 | 0.851 |
0.023
0.000 | 0.109 |
0.147
0.099 | 0.182 |
0.007
0.000 | 0.039 |
|
| 2 spectra, ILELEEENDR |
0.000 |
|
0.000 |
|
0.000 |
0.915 |
0.000 |
0.000 |
0.085 |
|
| 1 spectrum, VLADNLK |
0.230 |
|
0.262 |
|
0.000 |
0.000 |
0.000 |
0.363 |
0.145 |
|
| 1 spectrum, IADLEHLK |
0.000 |
|
0.000 |
|
0.000 |
0.931 |
0.000 |
0.000 |
0.069 |
|
| 2 spectra, LDALHR |
0.000 |
|
0.000 |
|
0.000 |
0.776 |
0.000 |
0.207 |
0.016 |
|
| 8 spectra, VESELR |
0.000 |
|
0.954 |
|
0.043 |
0.000 |
0.000 |
0.003 |
0.000 |
|
| 2 spectra, FSQLLEEK |
0.000 |
|
0.000 |
|
0.000 |
0.895 |
0.000 |
0.029 |
0.075 |
|
| 2 spectra, ESEVLEGAER |
0.000 |
|
0.000 |
|
0.000 |
0.882 |
0.000 |
0.000 |
0.118 |
|
| | | Plot |
|
Lyso |
|
|
|
|
|
|
|
Other |
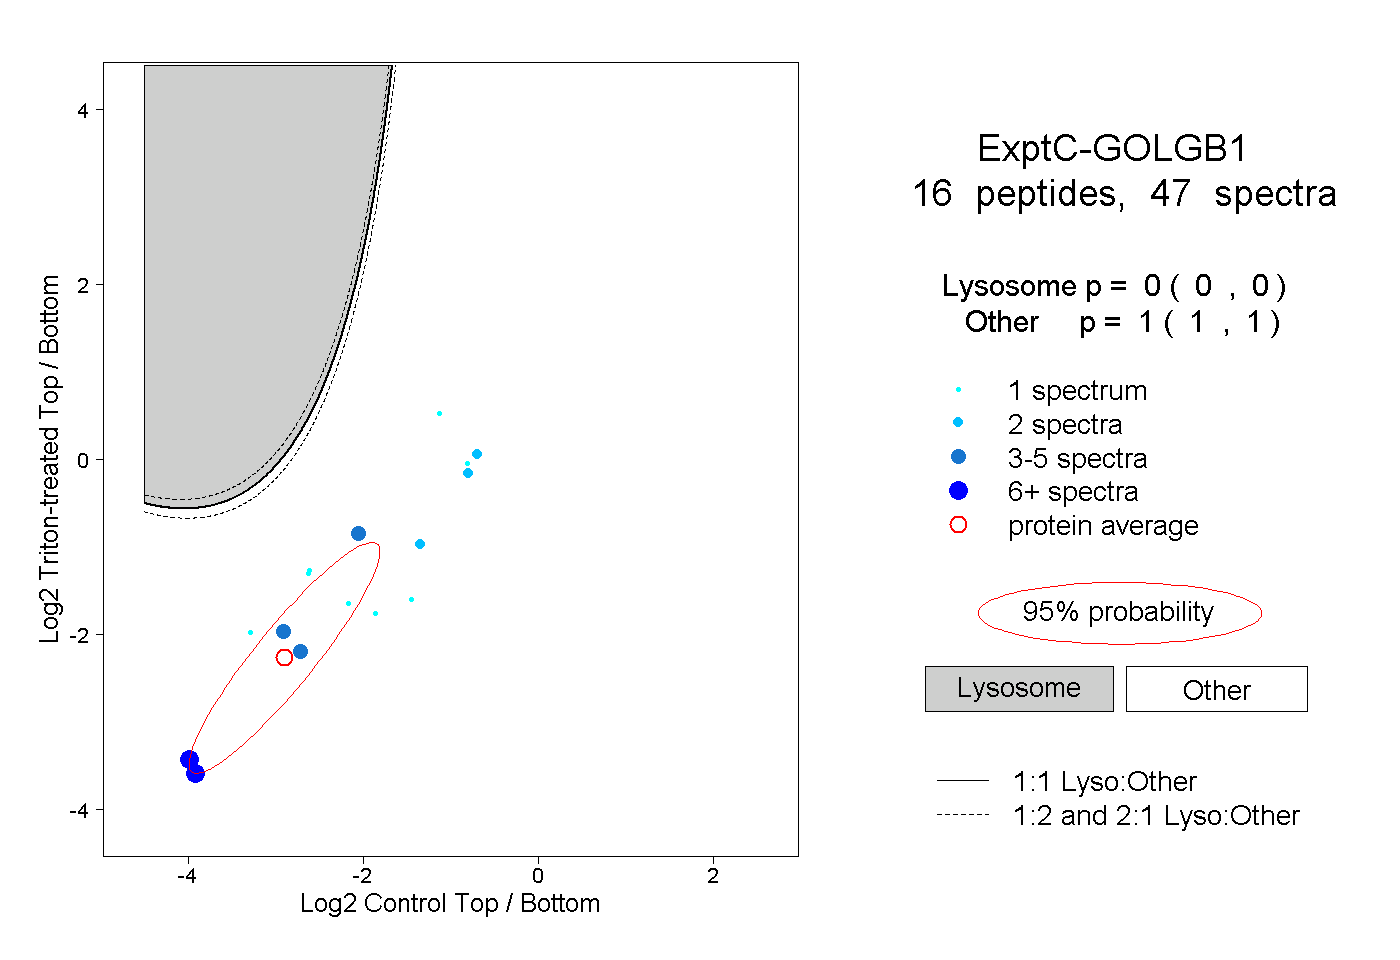
| Expt C |
16
peptides |
47
spectra |
 |
|
0.000
0.000 | 0.000 |
|
|
|
|
|
|
|
1.000
1.000 | 1.000 |
| | | Plot |
|
Lyso |
|
|
|
|
|
|
|
Other |
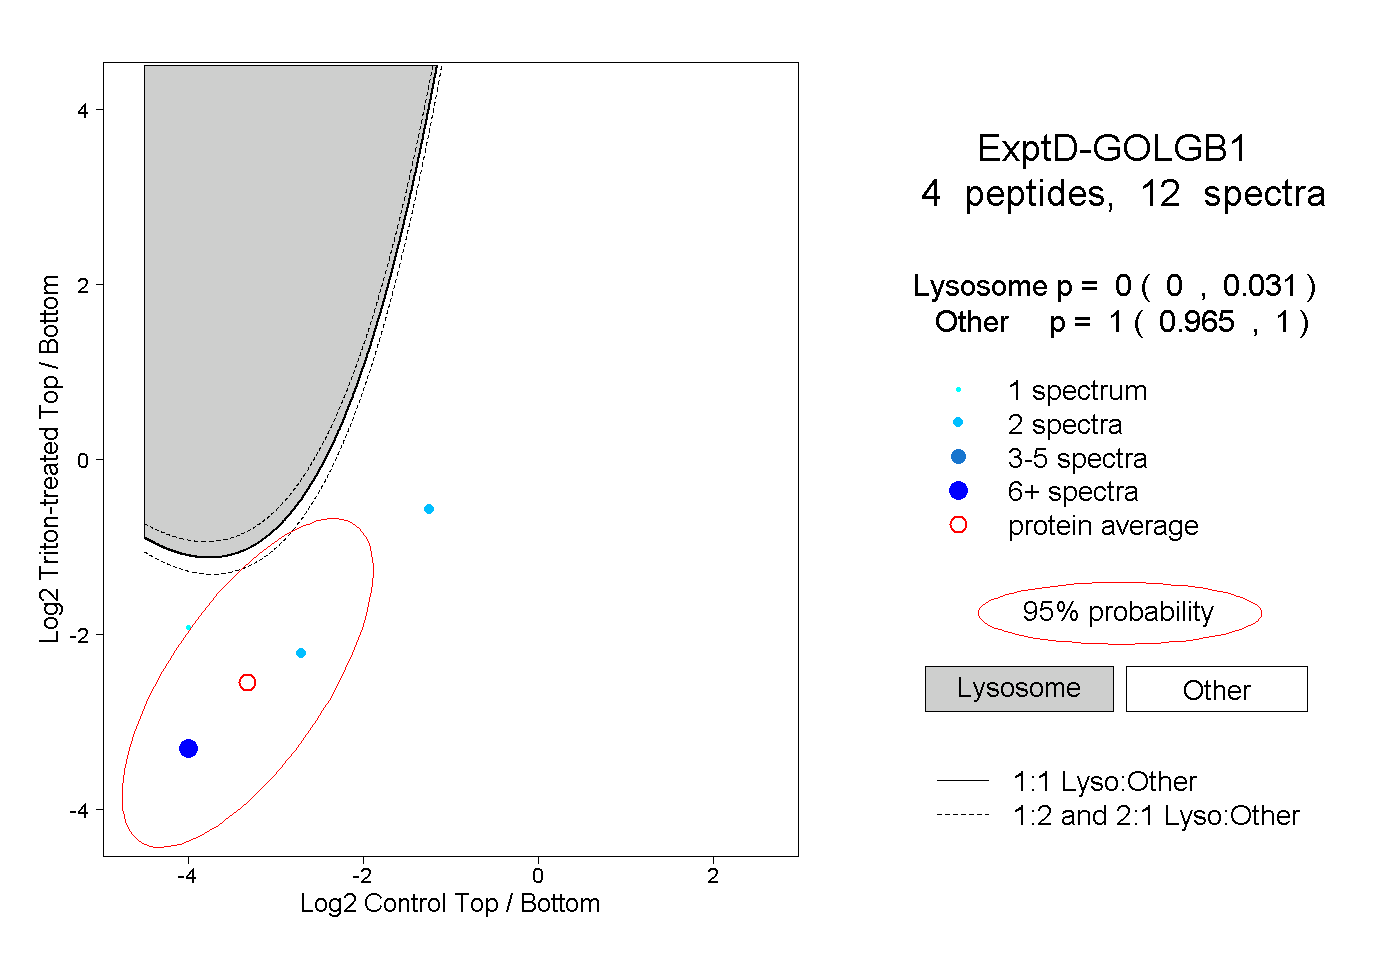
| Expt D |
4
peptides |
12
spectra |
 |
|
0.000
0.000 | 0.031 |
|
|
|
|
|
|
|
1.000
0.965 | 1.000 |