 20
20peptides
spectra
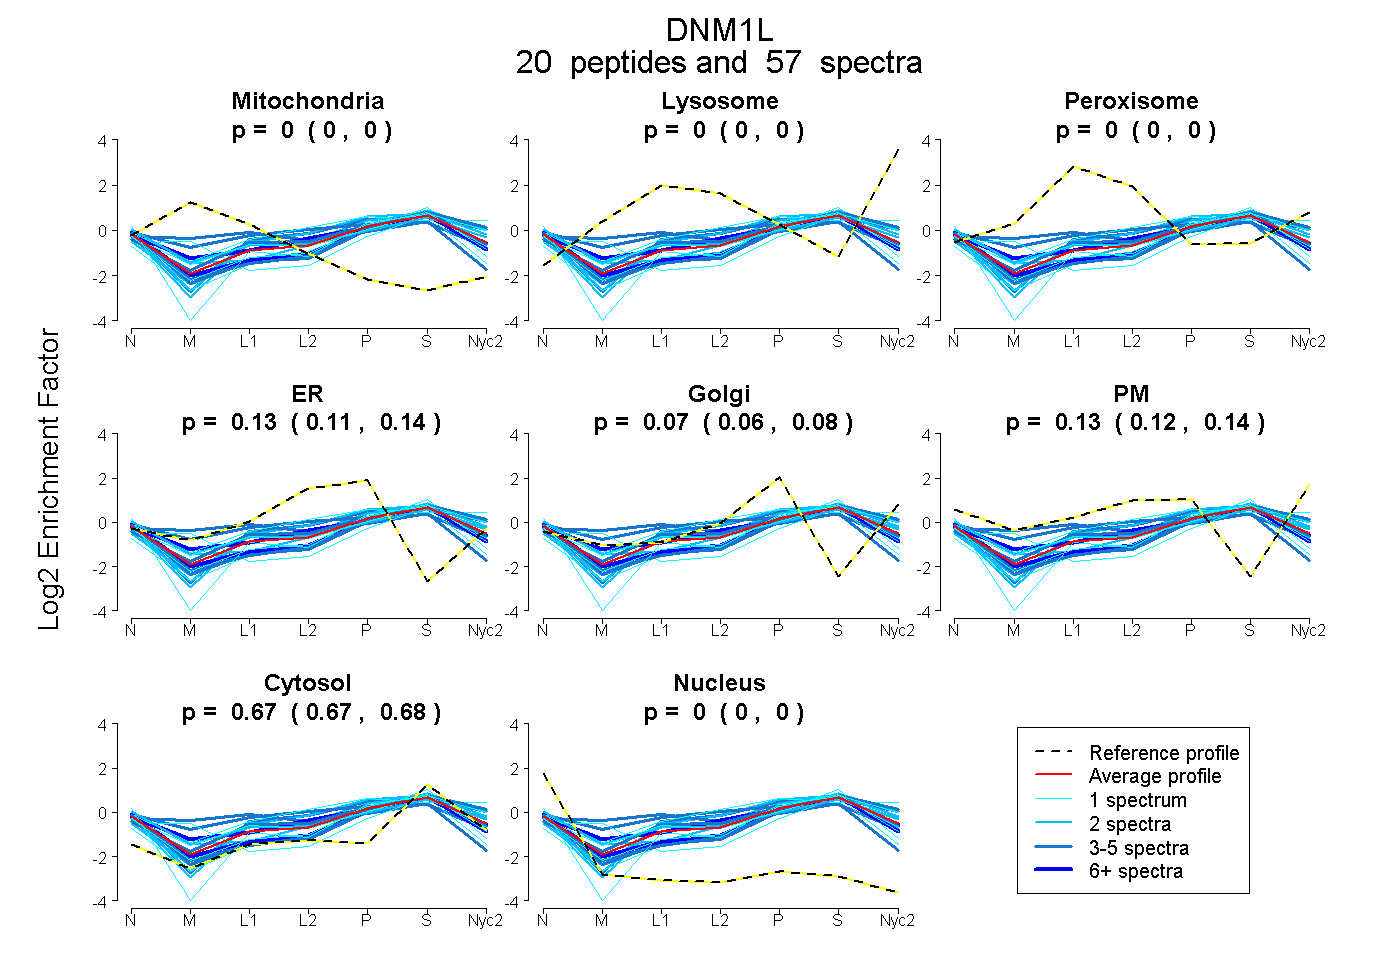
0.000 | 0.000
0.000 | 0.000
0.000 | 0.000
0.114 | 0.141
0.055 | 0.080
0.117 | 0.140
0.670 | 0.675
0.000 | 0.000
8peptides
spectra
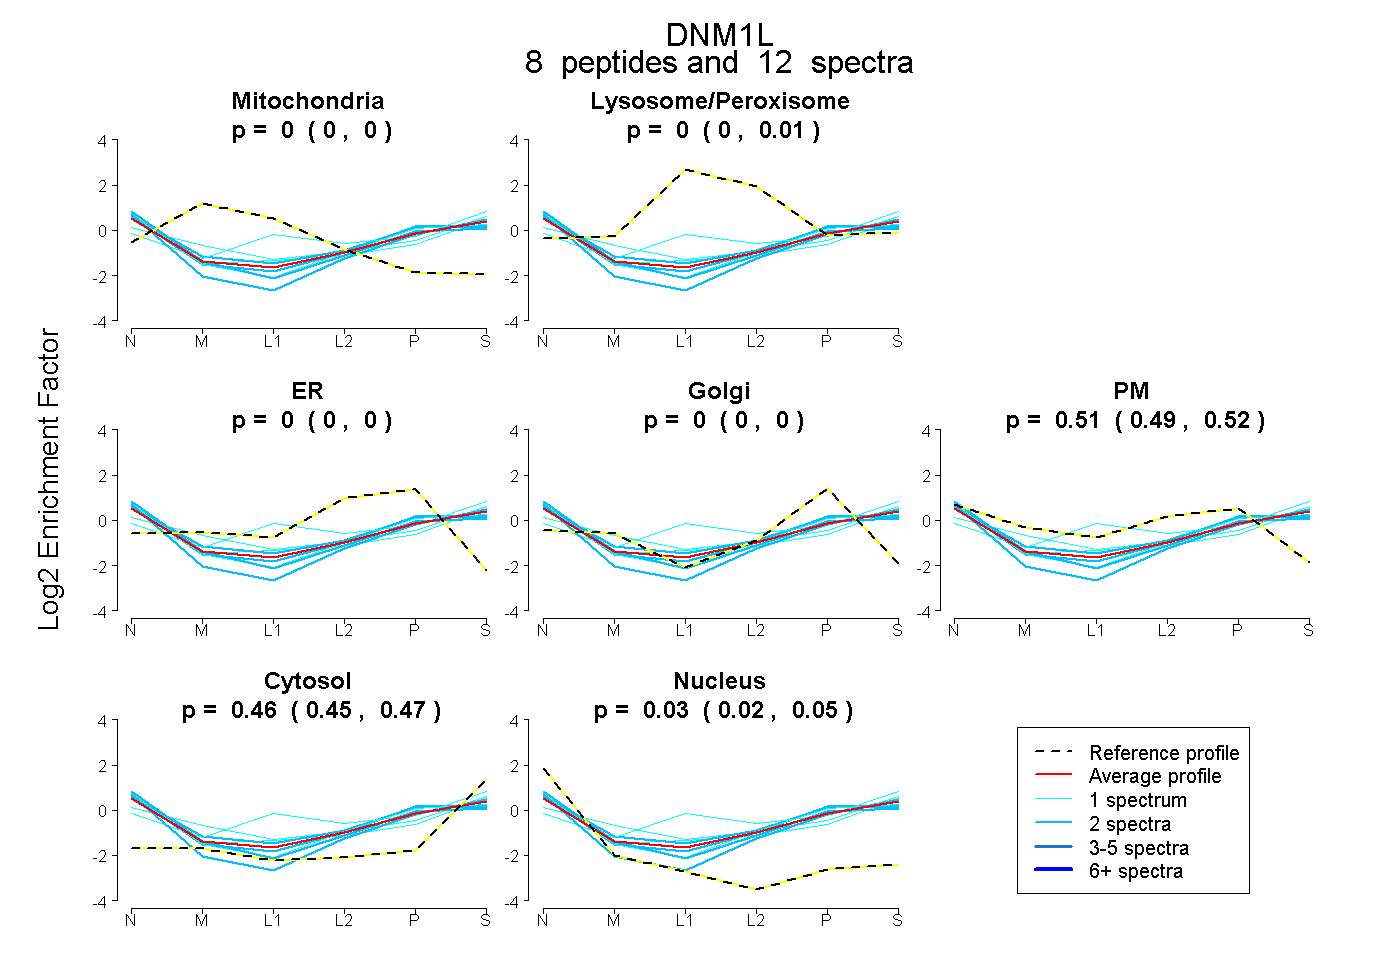
0.000 | 0.000
0.000 | 0.006
0.000 | 0.000
0.000 | 0.000
0.490 | 0.518
0.446 | 0.470
0.021 | 0.046
21peptides
spectra
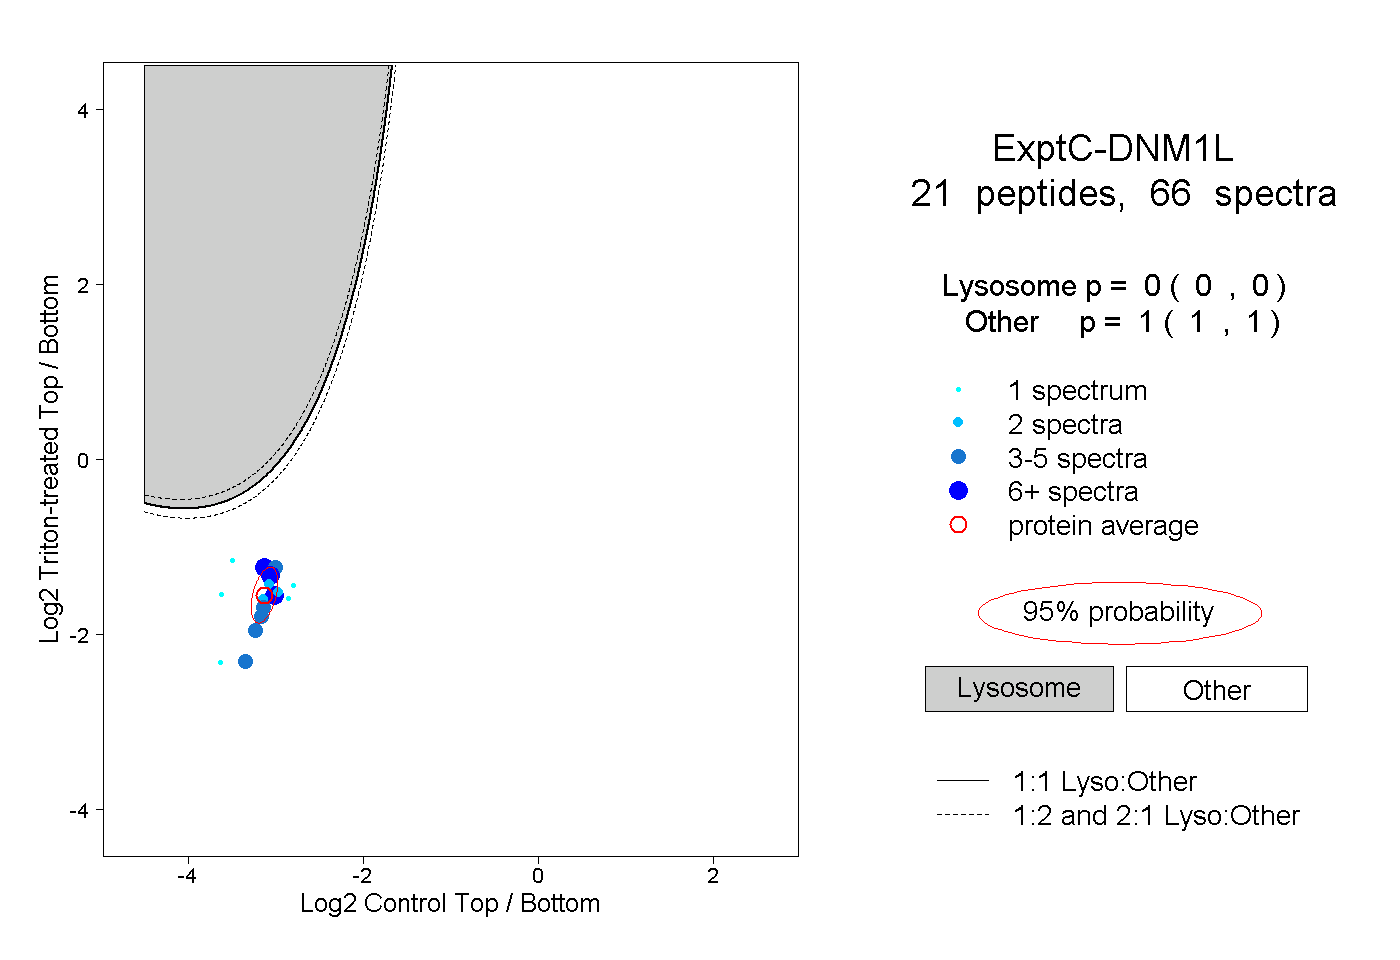
0.000 | 0.000
1.000 | 1.000
4peptides
spectra
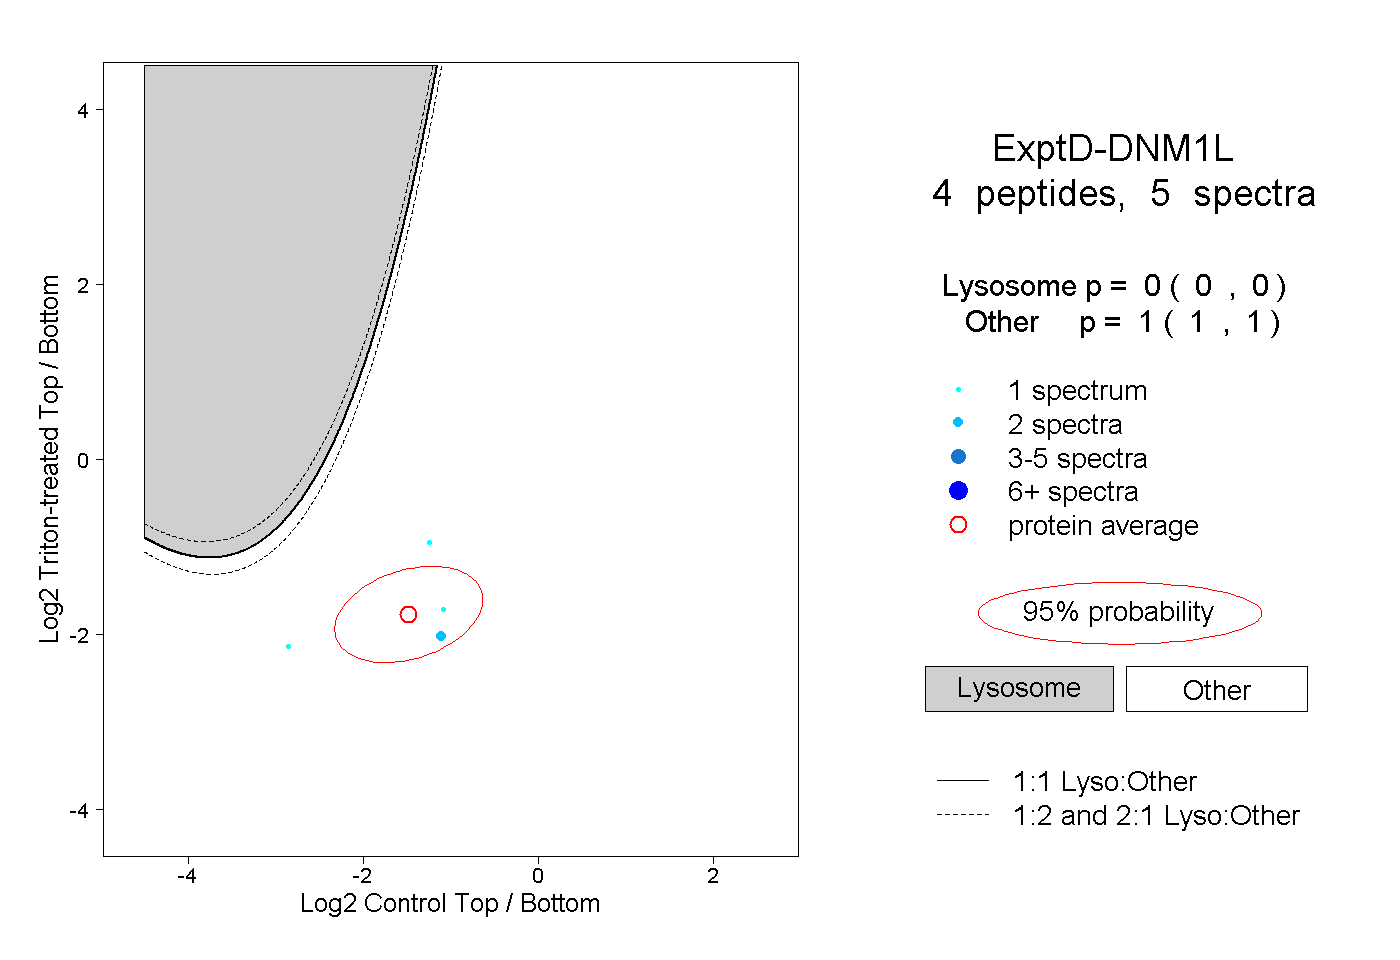
0.000 | 0.000
1.000 | 1.000