DNM1L
[ENSRNOP00000002482]
Main page
| | | Plot |
Mito |
Lyso |
|
Perox |
ER |
Golgi |
PM |
Cytosol |
Nucleus |
|
| Expt A |
 20
20
peptides |
57
spectra |
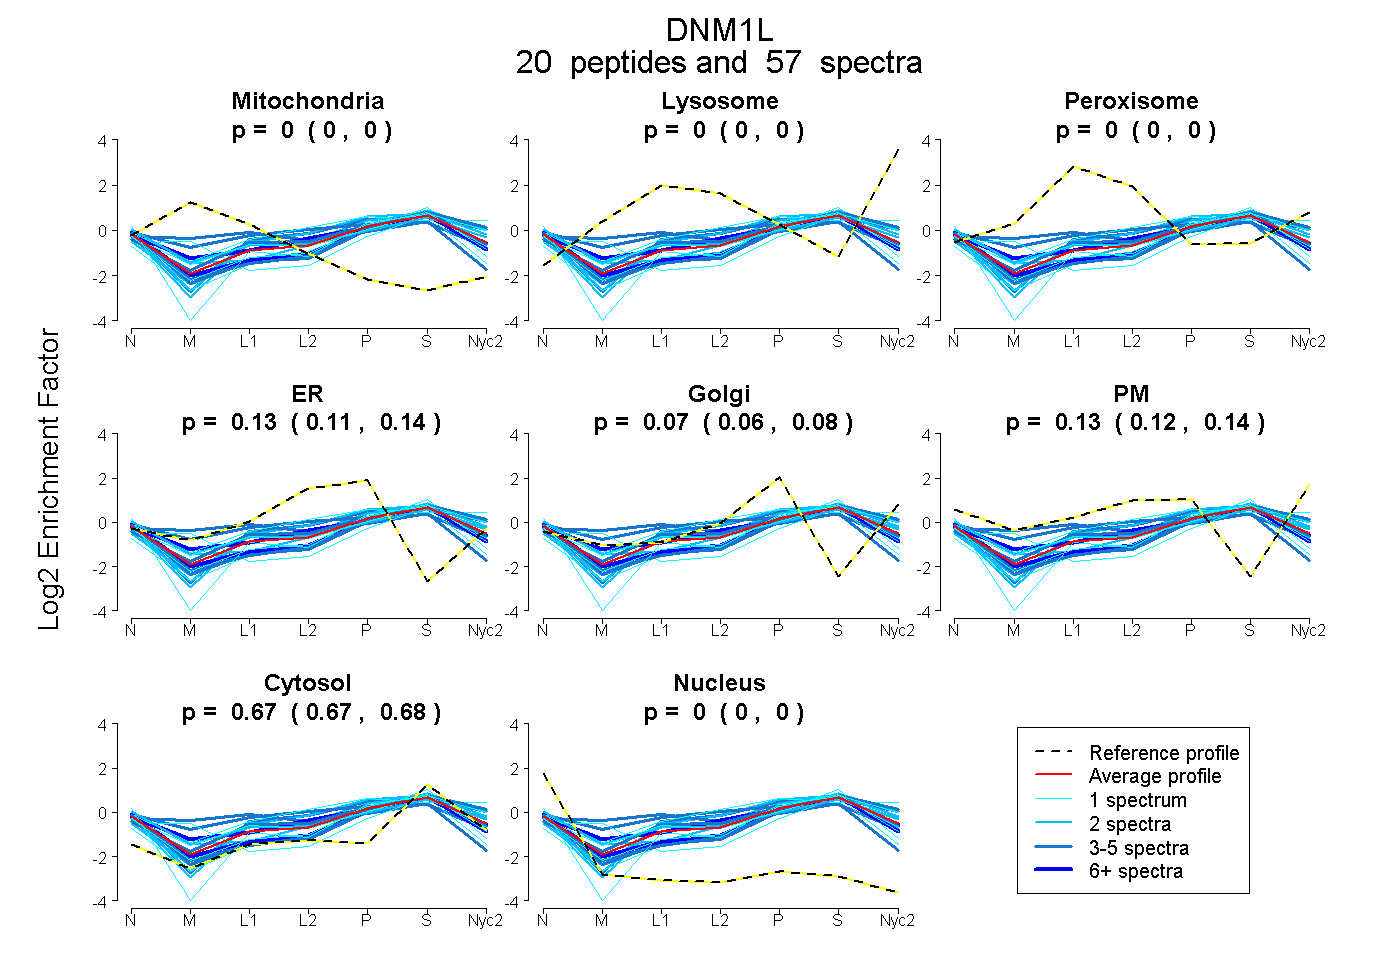 |
0.000
0.000 | 0.000 |
0.000
0.000 | 0.000 |
|
0.000
0.000 | 0.000 |
0.129
0.114 | 0.141 |
0.069
0.055 | 0.080 |
0.130
0.117 | 0.140 |
0.673
0.670 | 0.675 |
0.000
0.000 | 0.000 |
|
| | | Plot |
Mito |
|
Lyso or Perox |
|
ER |
Golgi |
PM |
Cytosol |
Nucleus |
|
| Expt B |
8
peptides |
12
spectra |
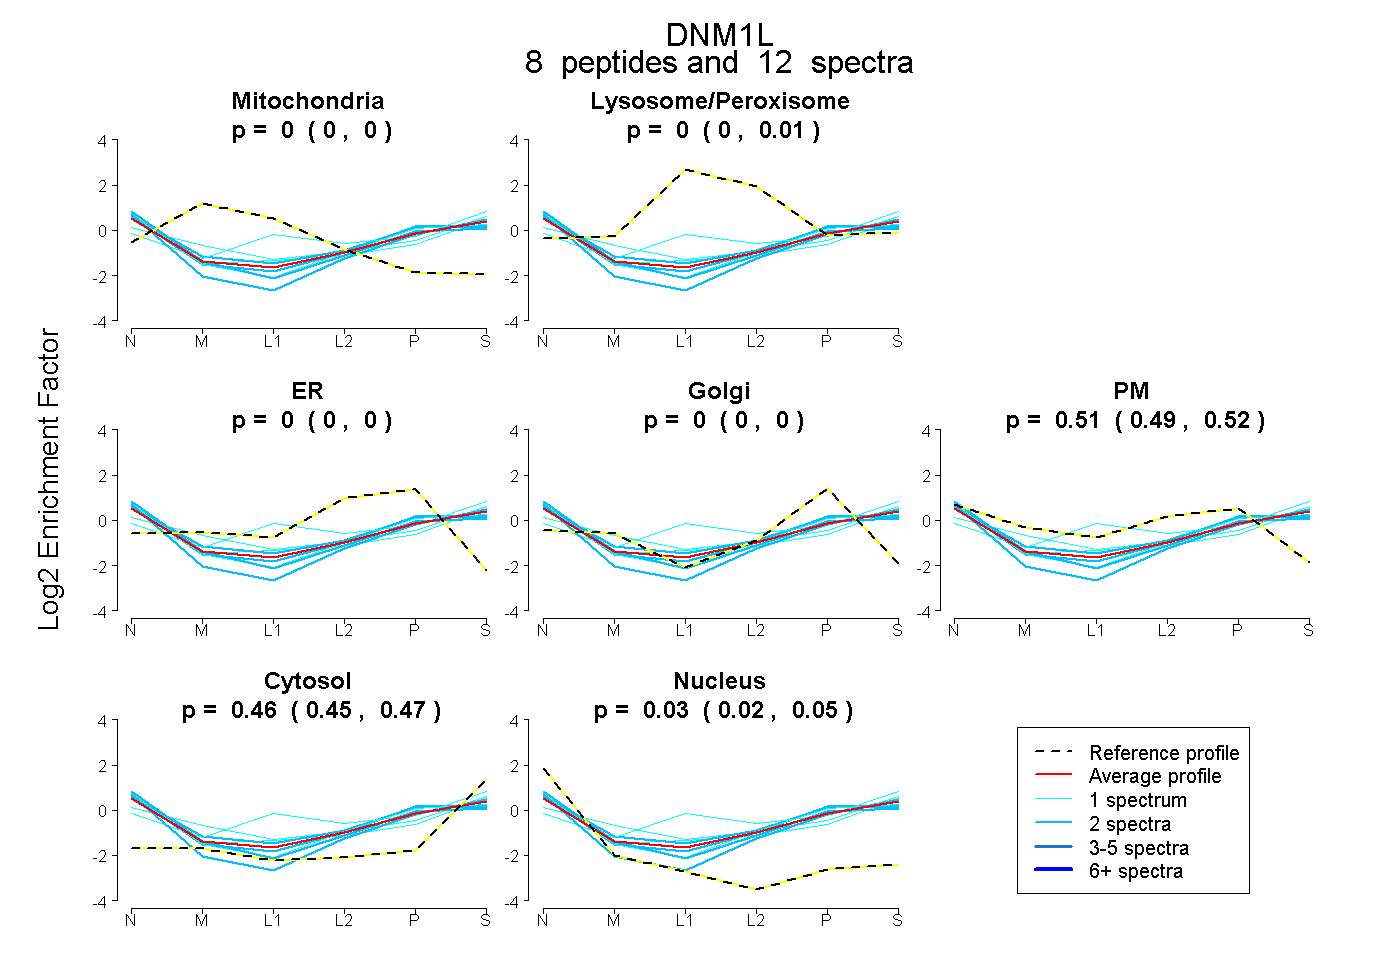 |
0.000
0.000 | 0.000 |
|
0.000
0.000 | 0.006 |
|
0.000
0.000 | 0.000 |
0.000
0.000 | 0.000 |
0.507
0.490 | 0.518 |
0.459
0.446 | 0.470 |
0.033
0.021 | 0.046 |
|
| 1 spectrum, LLMHHIR |
0.000 |
|
0.331 |
|
0.000 |
0.000 |
0.198 |
0.472 |
0.000 |
|
| 2 spectra, GTGVVTR |
0.000 |
|
0.000 |
|
0.000 |
0.064 |
0.484 |
0.406 |
0.046 |
|
| 1 spectrum, LGIIGVVNR |
0.000 |
|
0.000 |
|
0.000 |
0.083 |
0.440 |
0.406 |
0.071 |
|
| 2 spectra, DIELQIR |
0.000 |
|
0.000 |
|
0.000 |
0.000 |
0.596 |
0.398 |
0.006 |
|
| 2 spectra, SSVLESLVGR |
0.000 |
|
0.000 |
|
0.000 |
0.074 |
0.434 |
0.367 |
0.126 |
|
| 1 spectrum, DCEVIER |
0.000 |
|
0.129 |
|
0.000 |
0.000 |
0.290 |
0.417 |
0.164 |
|
| 2 spectra, SYFLIVR |
0.000 |
|
0.000 |
|
0.000 |
0.167 |
0.213 |
0.466 |
0.153 |
|
| 1 spectrum, CVELVHEEMQR |
0.000 |
|
0.077 |
|
0.000 |
0.000 |
0.422 |
0.502 |
0.000 |
|
| | | Plot |
|
Lyso |
|
|
|
|
|
|
|
Other |
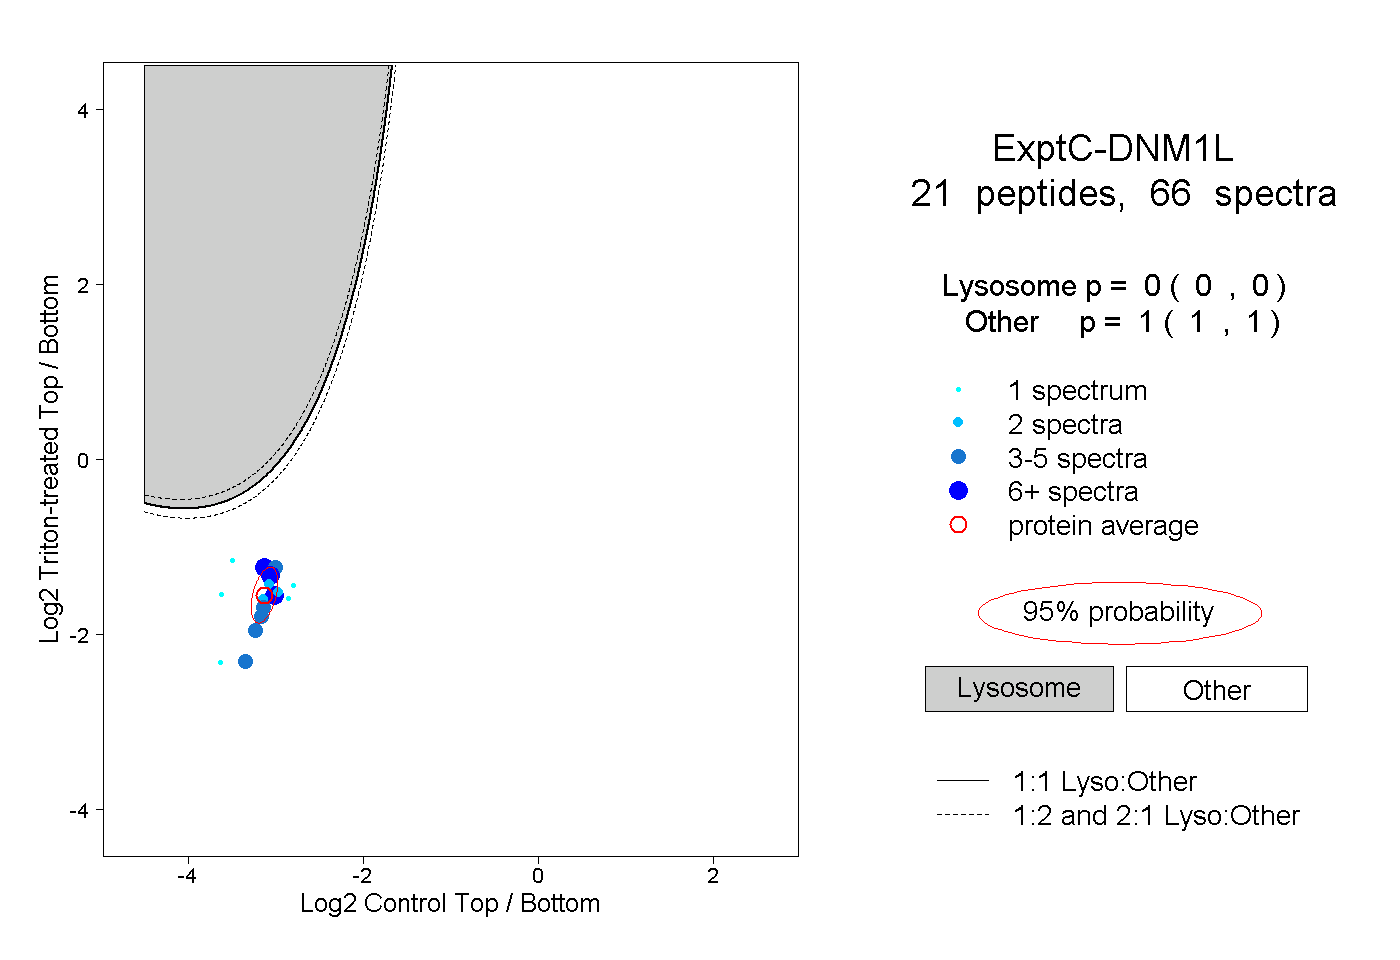
| Expt C |
21
peptides |
66
spectra |
 |
|
0.000
0.000 | 0.000 |
|
|
|
|
|
|
|
1.000
1.000 | 1.000 |
| | | Plot |
|
Lyso |
|
|
|
|
|
|
|
Other |
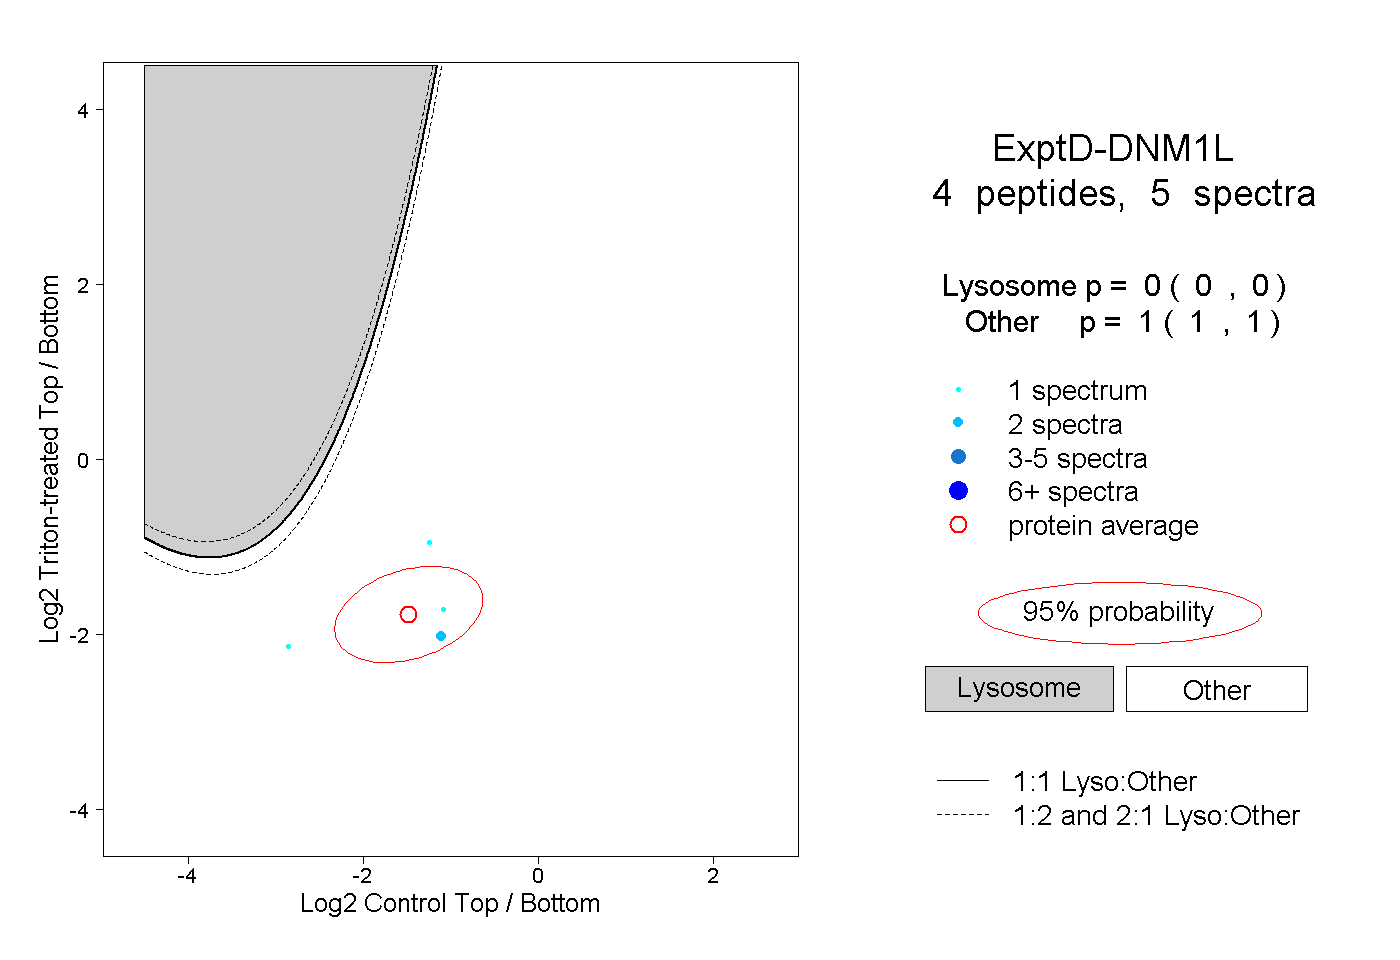
| Expt D |
4
peptides |
5
spectra |
 |
|
0.000
0.000 | 0.000 |
|
|
|
|
|
|
|
1.000
1.000 | 1.000 |