 20
20peptides
spectra
0.000 | 0.000
0.000 | 0.000
0.000 | 0.000
0.114 | 0.141
0.055 | 0.080
0.117 | 0.140
0.670 | 0.675
0.000 | 0.000
| Plot | Mito | Lyso | Perox | ER | Golgi | PM | Cytosol | Nucleus | |||||
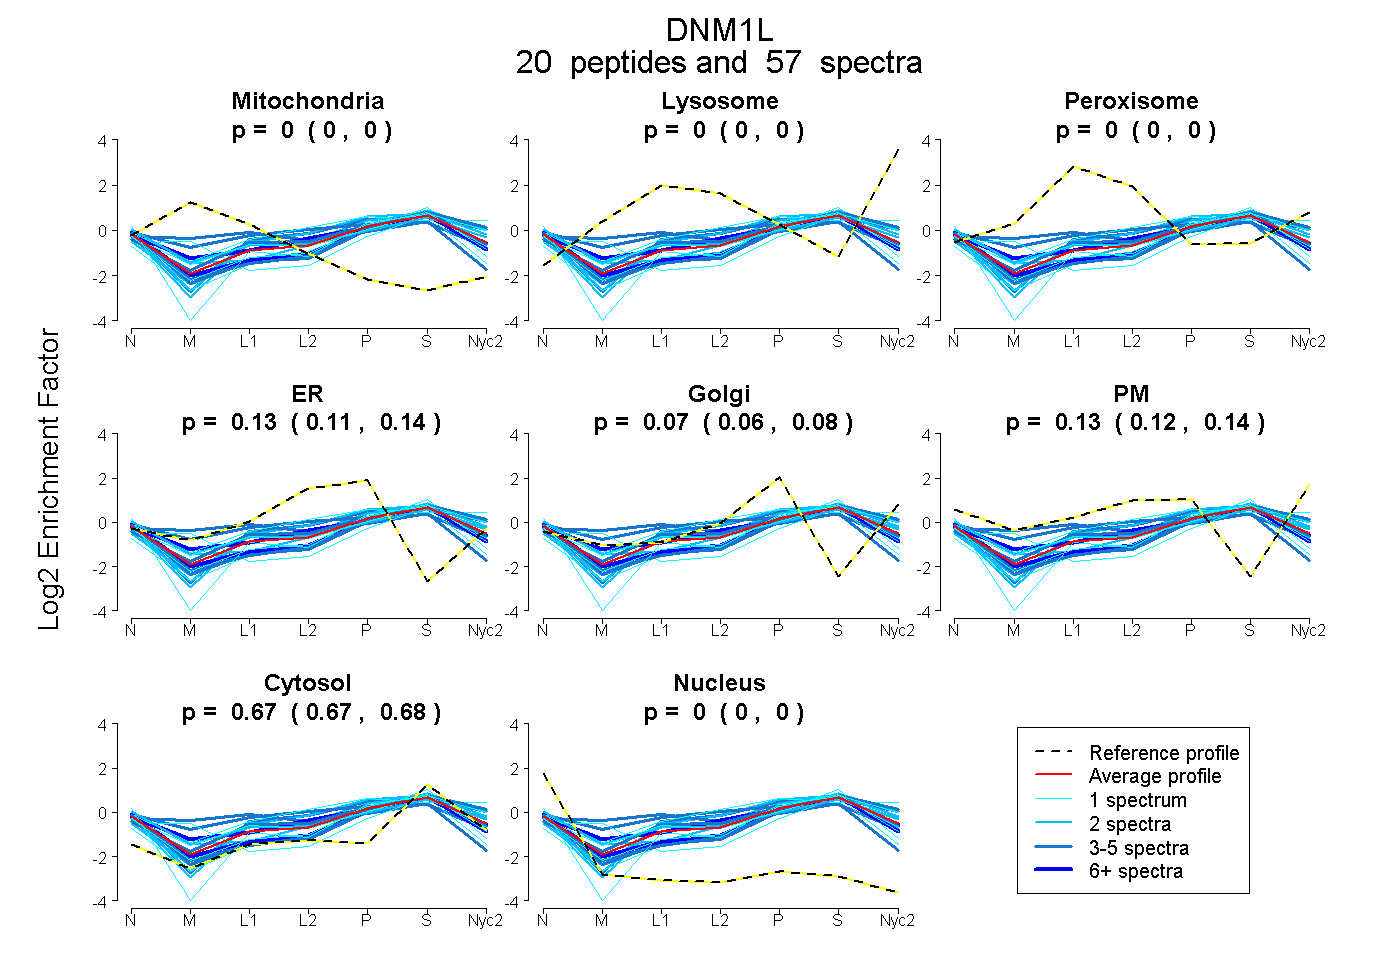
| Expt A |
20 peptides |
57 spectra |
|
0.000 0.000 | 0.000 |
0.000 0.000 | 0.000 |
0.000 0.000 | 0.000 |
0.129 0.114 | 0.141 |
0.069 0.055 | 0.080 |
0.130 0.117 | 0.140 |
0.673 0.670 | 0.675 |
0.000 0.000 | 0.000 |
| 12 spectra, LLMHHIR | 0.000 | 0.000 | 0.036 | 0.184 | 0.000 | 0.154 | 0.626 | 0.000 | ||
| 3 spectra, GTGVVTR | 0.000 | 0.000 | 0.000 | 0.000 | 0.243 | 0.000 | 0.690 | 0.067 | ||
| 1 spectrum, TLAVITK | 0.000 | 0.000 | 0.000 | 0.075 | 0.203 | 0.000 | 0.699 | 0.023 | ||
| 2 spectra, ELPSAVSR | 0.000 | 0.000 | 0.000 | 0.009 | 0.040 | 0.238 | 0.712 | 0.000 | ||
| 1 spectrum, GVSPEPIHLK | 0.203 | 0.000 | 0.000 | 0.000 | 0.141 | 0.000 | 0.627 | 0.030 | ||
| 1 spectrum, YPSLANR | 0.000 | 0.000 | 0.071 | 0.000 | 0.080 | 0.216 | 0.632 | 0.000 | ||
| 1 spectrum, VFSPNVVNLTLVDLPGMTK | 0.000 | 0.000 | 0.000 | 0.000 | 0.231 | 0.000 | 0.707 | 0.062 | ||
| 2 spectra, ISGNNK | 0.000 | 0.000 | 0.000 | 0.000 | 0.169 | 0.199 | 0.624 | 0.008 | ||
| 3 spectra, CVELVHEEMQR | 0.037 | 0.000 | 0.187 | 0.298 | 0.000 | 0.001 | 0.478 | 0.000 | ||
| 1 spectrum, SSLLDDLLTESEDMAQR | 0.000 | 0.000 | 0.117 | 0.000 | 0.114 | 0.309 | 0.460 | 0.000 | ||
| 7 spectra, LGIIGVVNR | 0.000 | 0.000 | 0.000 | 0.057 | 0.221 | 0.000 | 0.668 | 0.054 | ||
| 2 spectra, AVMHFLVNHVK | 0.000 | 0.000 | 0.066 | 0.188 | 0.142 | 0.000 | 0.605 | 0.000 | ||
| 2 spectra, DIELQIR | 0.000 | 0.000 | 0.000 | 0.026 | 0.226 | 0.009 | 0.702 | 0.037 | ||
| 3 spectra, SSVLESLVGR | 0.000 | 0.000 | 0.000 | 0.000 | 0.271 | 0.000 | 0.690 | 0.039 | ||
| 2 spectra, ALQGASQIIAEIR | 0.000 | 0.000 | 0.000 | 0.016 | 0.119 | 0.214 | 0.651 | 0.000 | ||
| 1 spectrum, LDLMDAGTDAMDVLMGR | 0.000 | 0.000 | 0.000 | 0.063 | 0.113 | 0.000 | 0.801 | 0.023 | ||
| 4 spectra, AEELLAEEK | 0.000 | 0.000 | 0.000 | 0.143 | 0.000 | 0.238 | 0.619 | 0.000 | ||
| 2 spectra, VPVGDQPK | 0.000 | 0.000 | 0.036 | 0.015 | 0.000 | 0.310 | 0.627 | 0.011 | ||
| 3 spectra, SYFLIVR | 0.000 | 0.001 | 0.100 | 0.000 | 0.143 | 0.150 | 0.605 | 0.000 | ||
| 4 spectra, DCLPELK | 0.226 | 0.000 | 0.125 | 0.183 | 0.000 | 0.000 | 0.467 | 0.000 |
| Plot | Mito | Lyso or Perox | ER | Golgi | PM | Cytosol | Nucleus | ||||||
| Expt B |
8 peptides |
12 spectra |
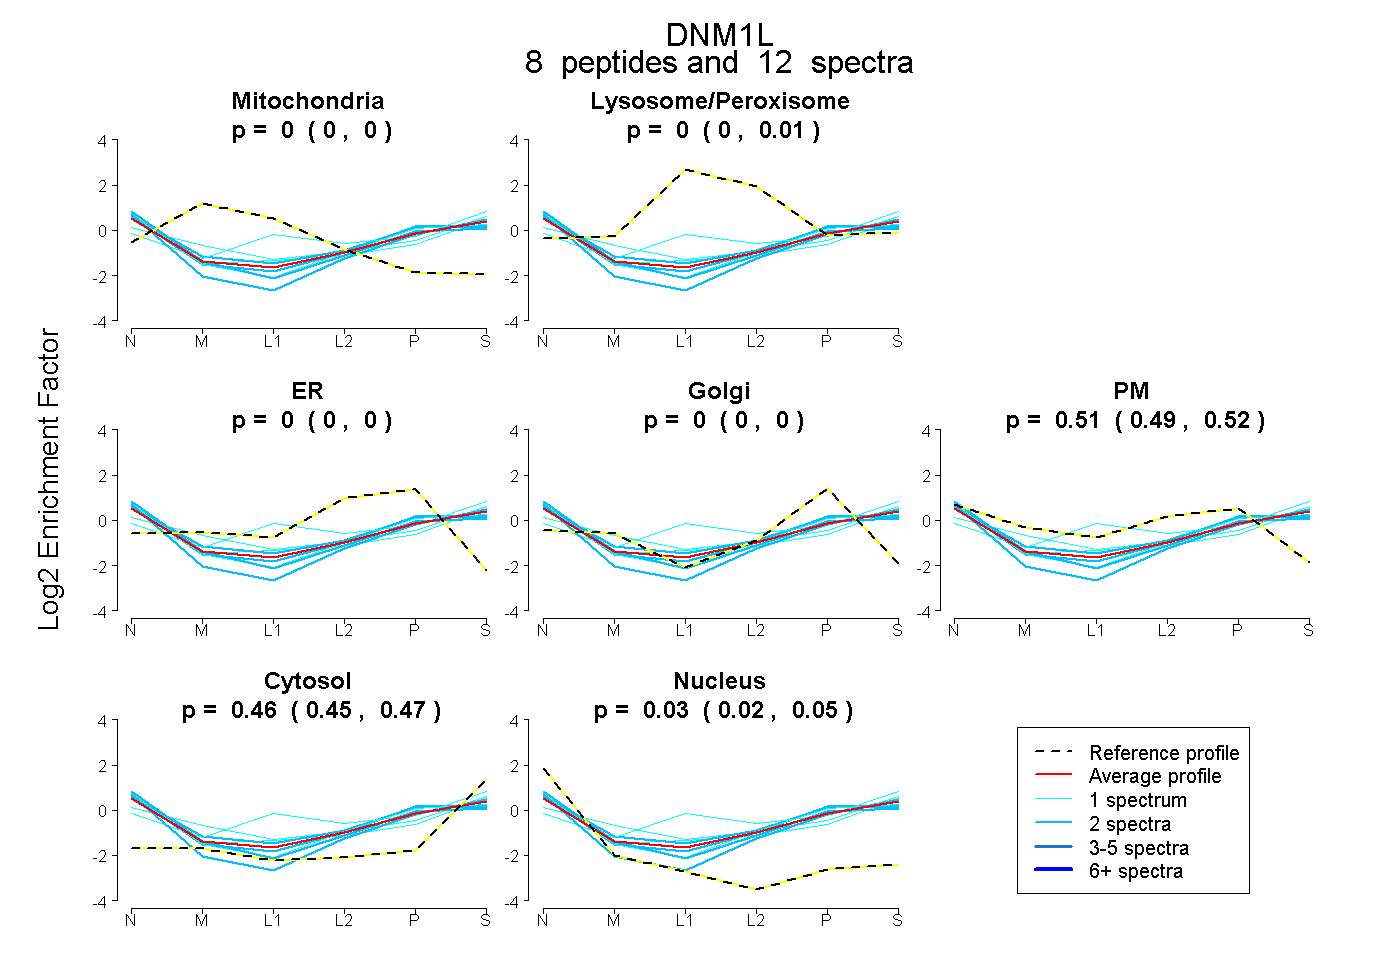 |
0.000 0.000 | 0.000 |
0.000 0.000 | 0.006 |
0.000 0.000 | 0.000 |
0.000 0.000 | 0.000 |
0.507 0.490 | 0.518 |
0.459 0.446 | 0.470 |
0.033 0.021 | 0.046 |
|||
| Plot | Lyso | Other | |||||||||||
| Expt C |
21 peptides |
66 spectra |
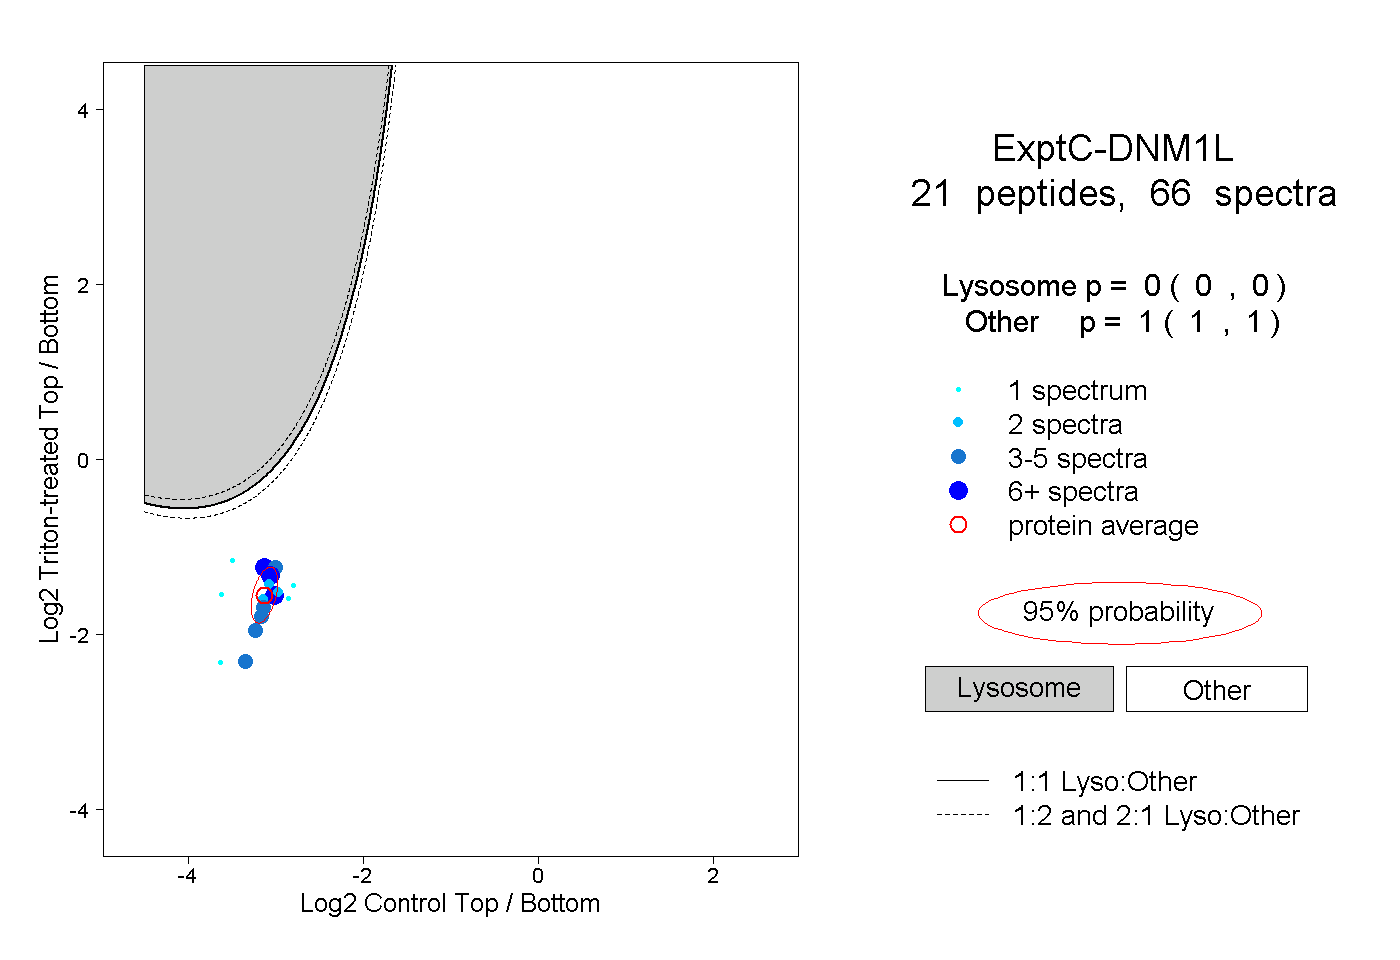 |
0.000 0.000 | 0.000 |
1.000 1.000 | 1.000 |
||||||||
| Plot | Lyso | Other | |||||||||||
| Expt D |
4 peptides |
5 spectra |
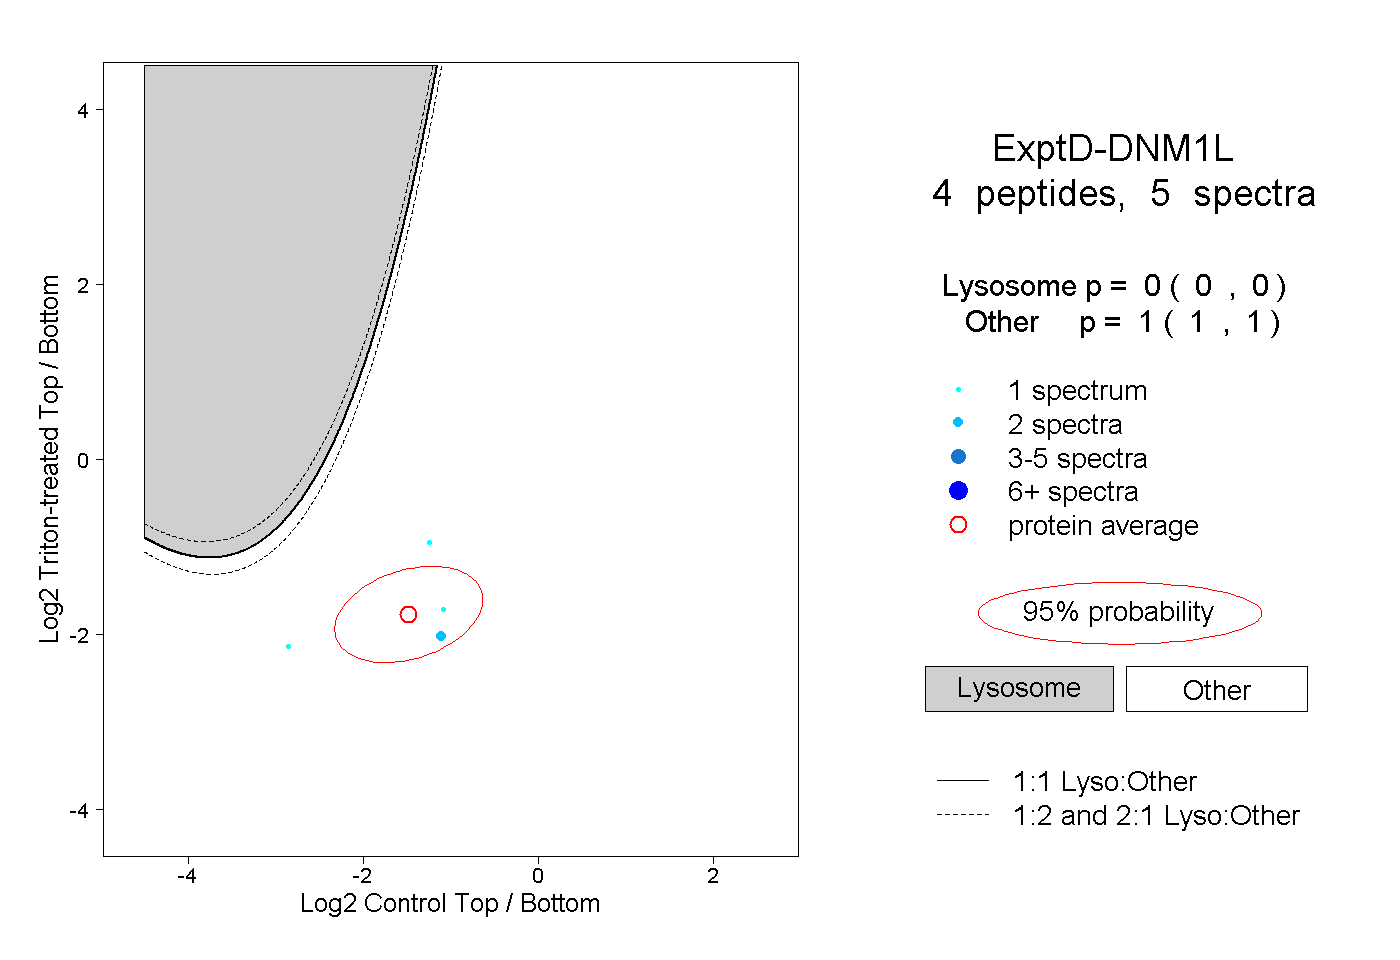 |
0.000 0.000 | 0.000 |
1.000 1.000 | 1.000 |