 20
20peptides
spectra
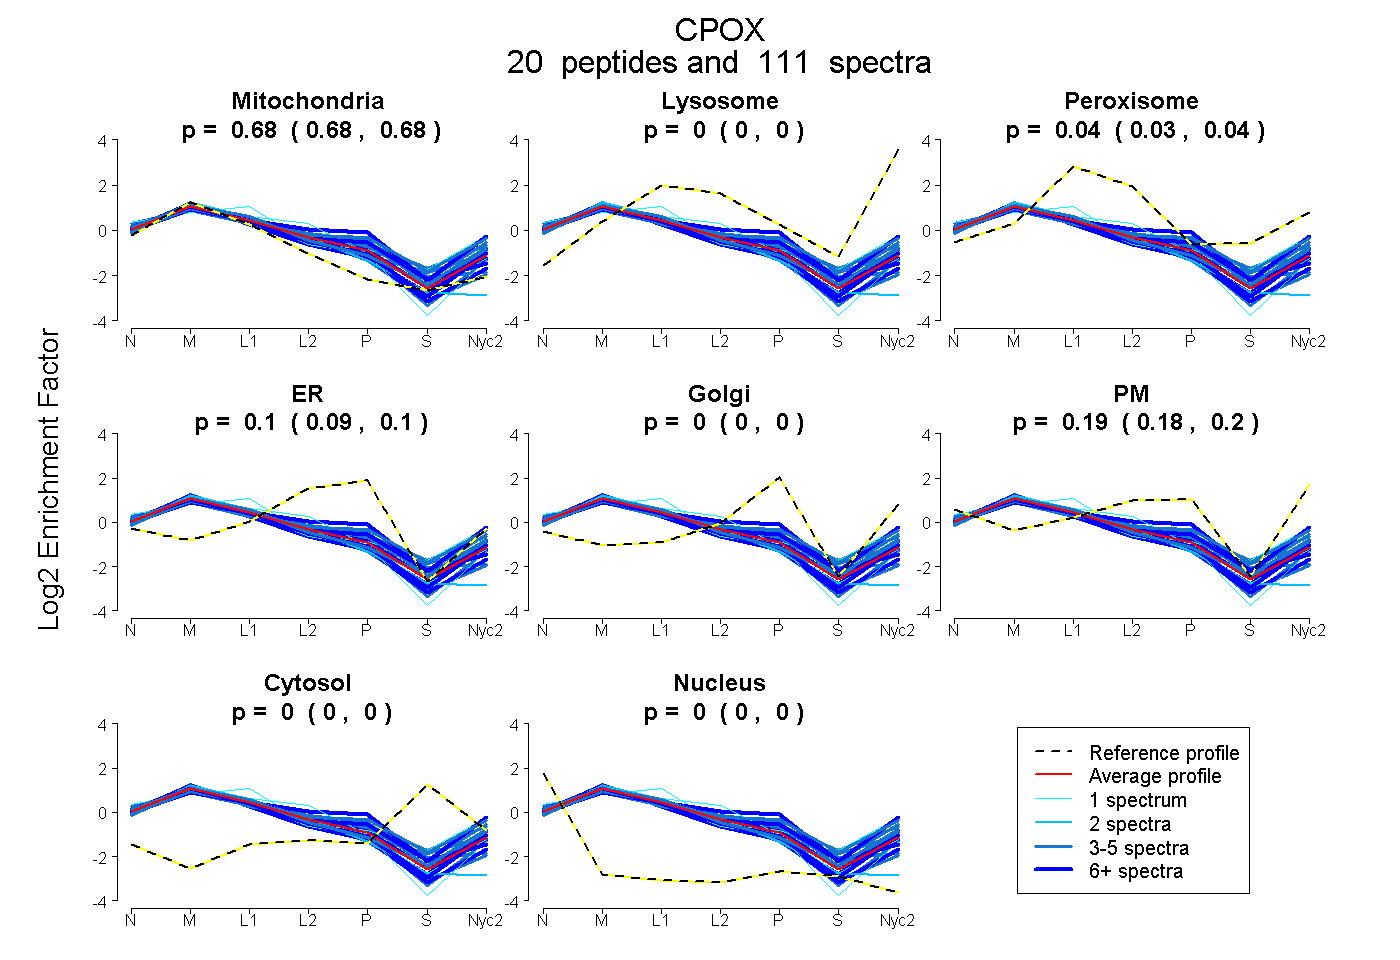
0.677 | 0.682
0.000 | 0.000
0.032 | 0.039
0.088 | 0.103
0.000 | 0.000
0.178 | 0.196
0.000 | 0.000
0.000 | 0.000
11peptides
spectra
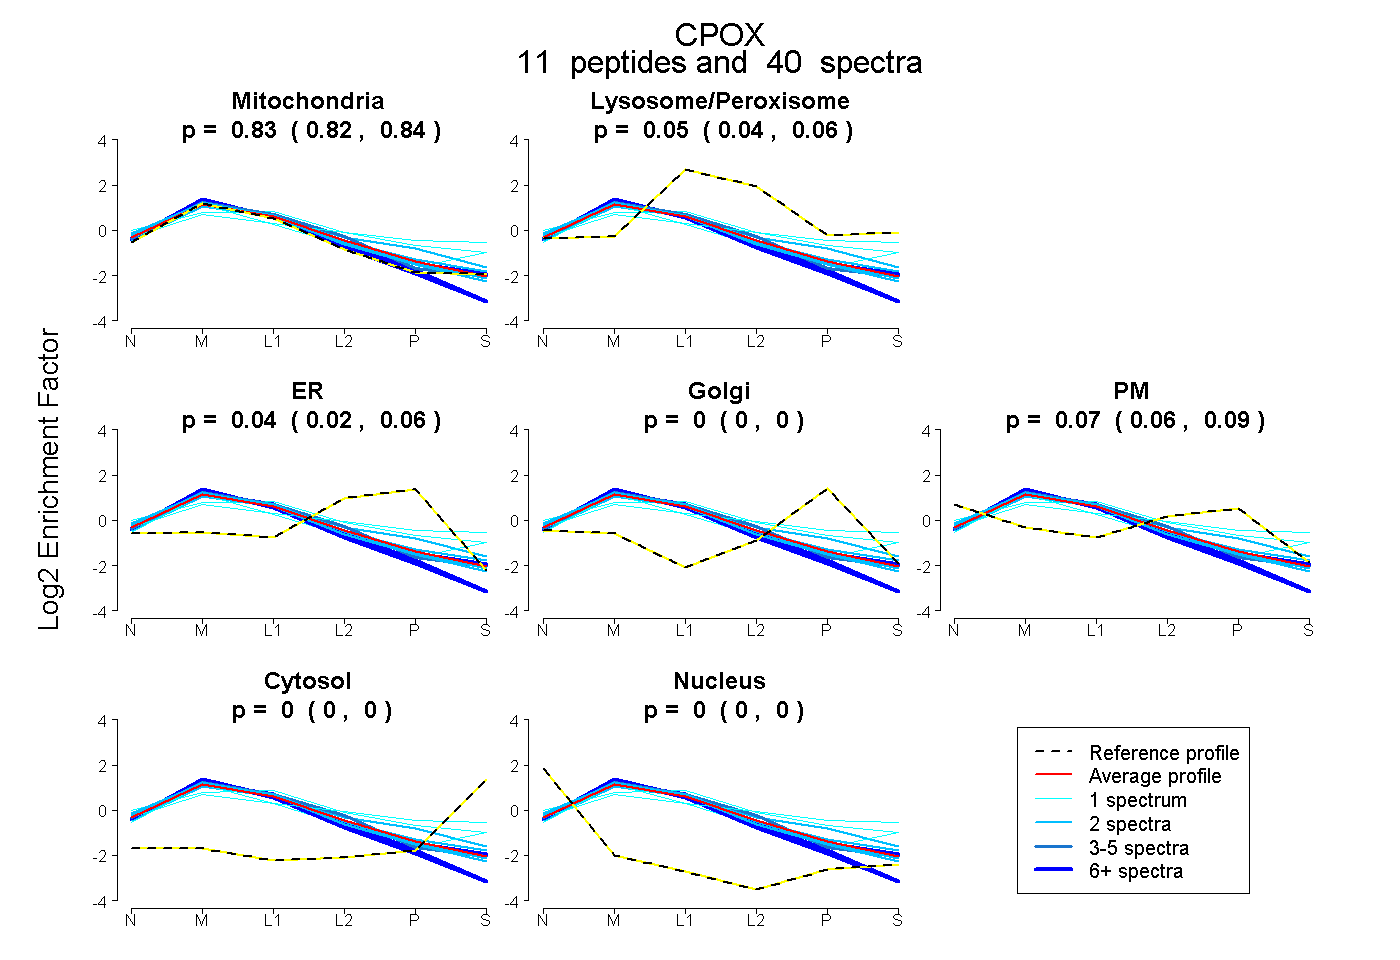
0.821 | 0.842
0.041 | 0.060
0.025 | 0.060
0.000 | 0.000
0.056 | 0.086
0.000 | 0.000
0.000 | 0.000
23peptides
spectra
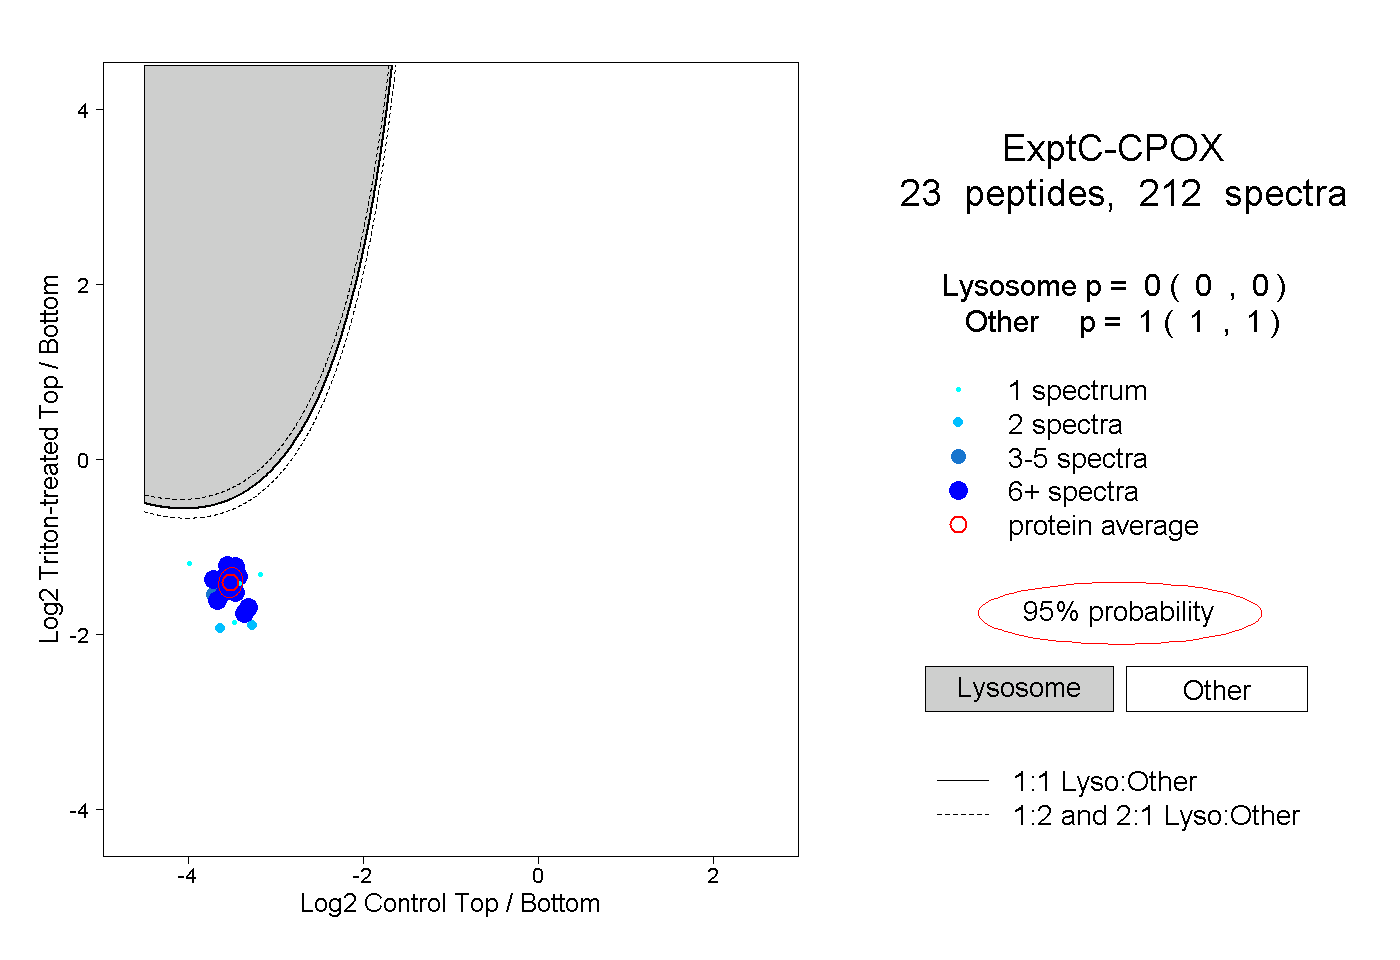
0.000 | 0.000
1.000 | 1.000
8peptides
spectra
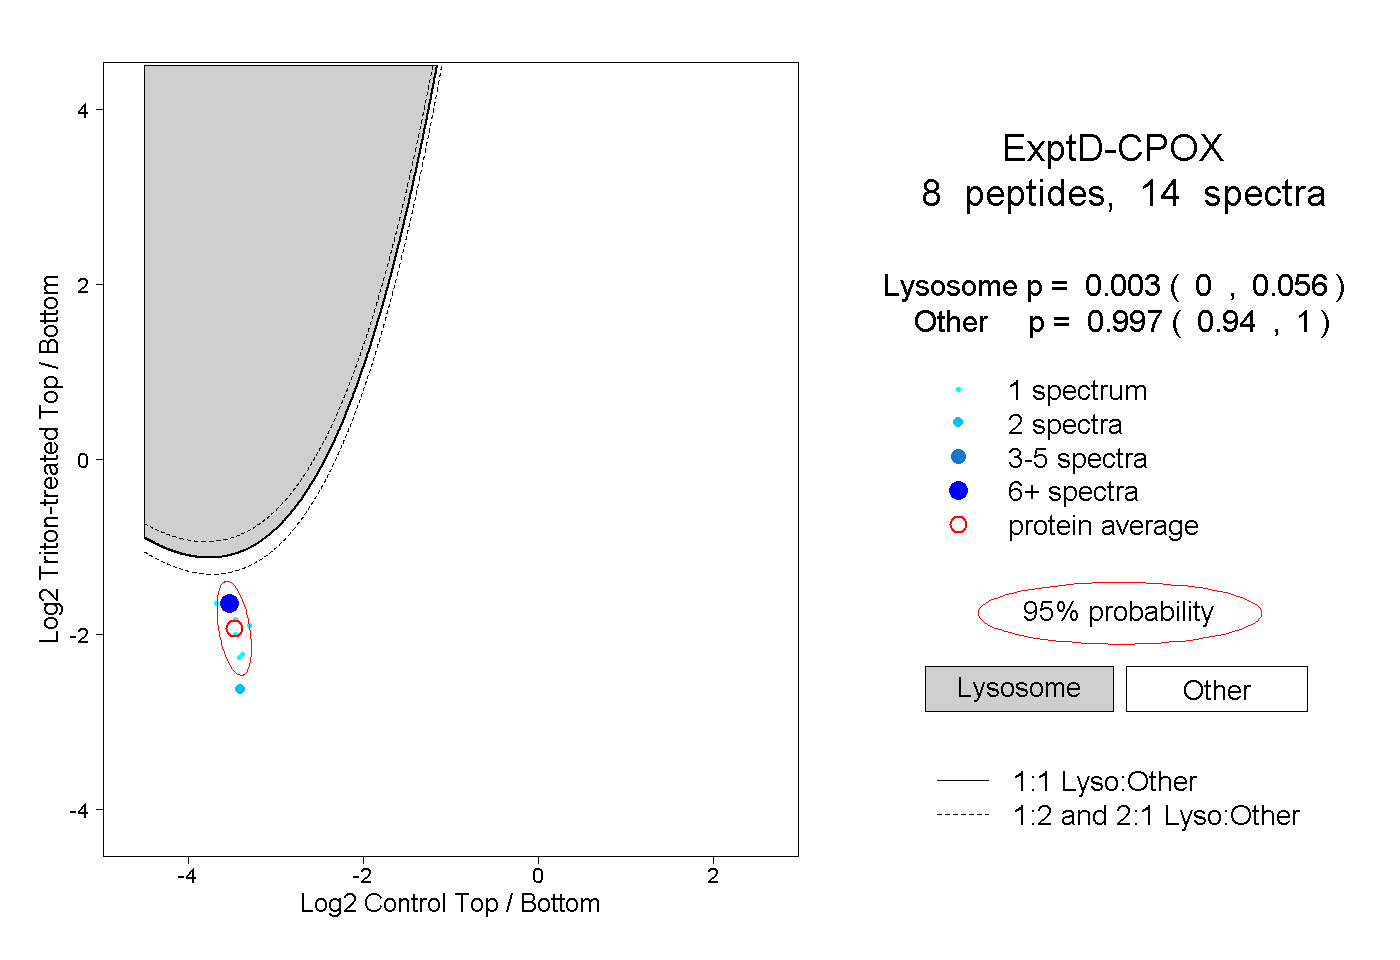
0.000 | 0.056
0.940 | 1.000