 16
16peptides
spectra
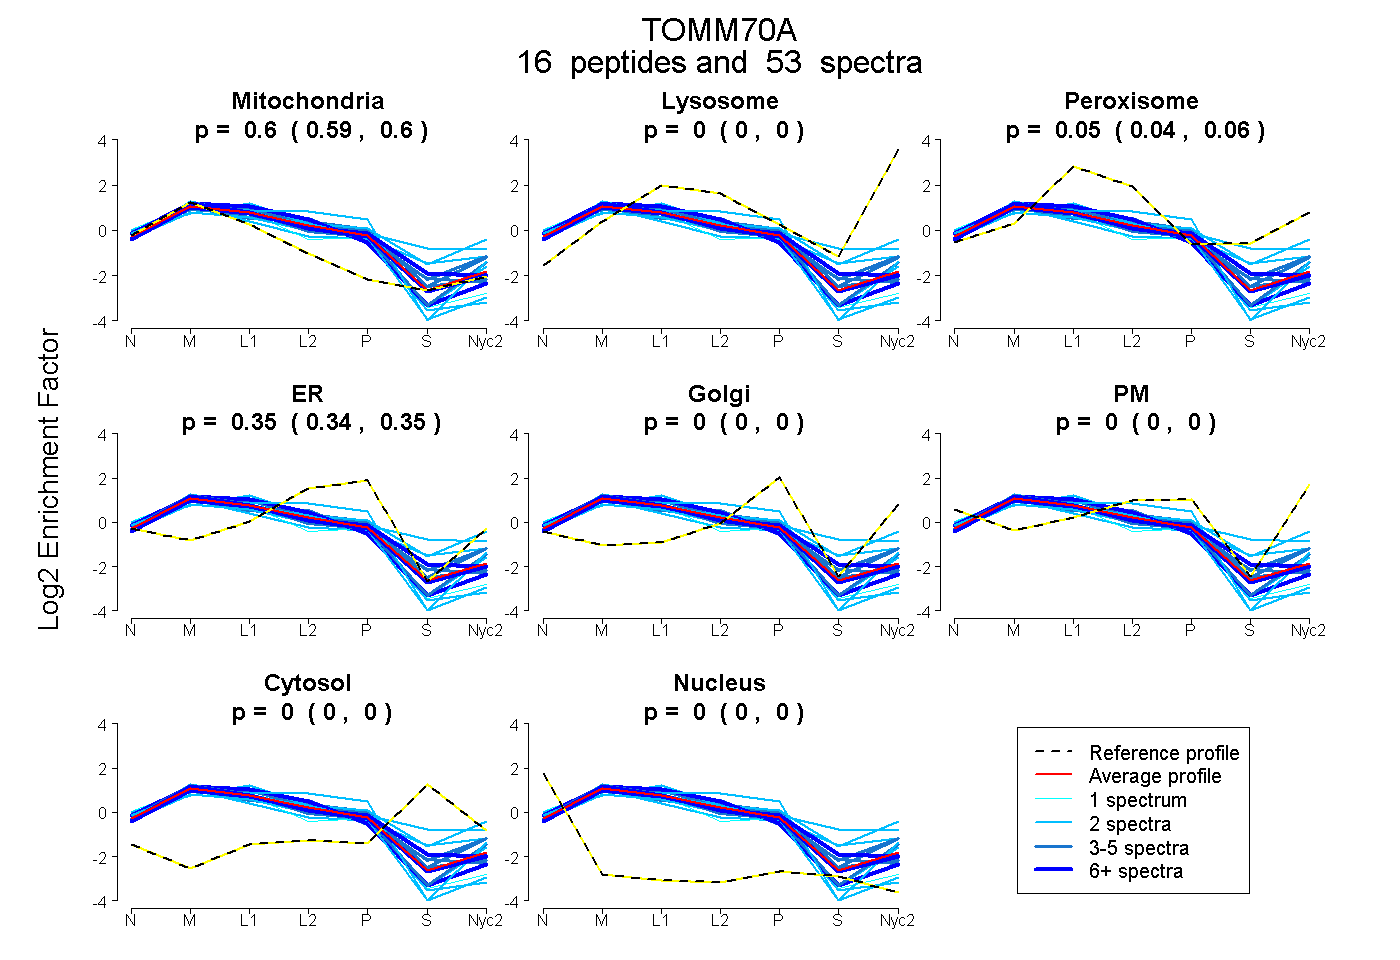
0.592 | 0.603
0.000 | 0.000
0.044 | 0.060
0.344 | 0.354
0.000 | 0.000
0.000 | 0.000
0.000 | 0.000
0.000 | 0.000
12peptides
spectra
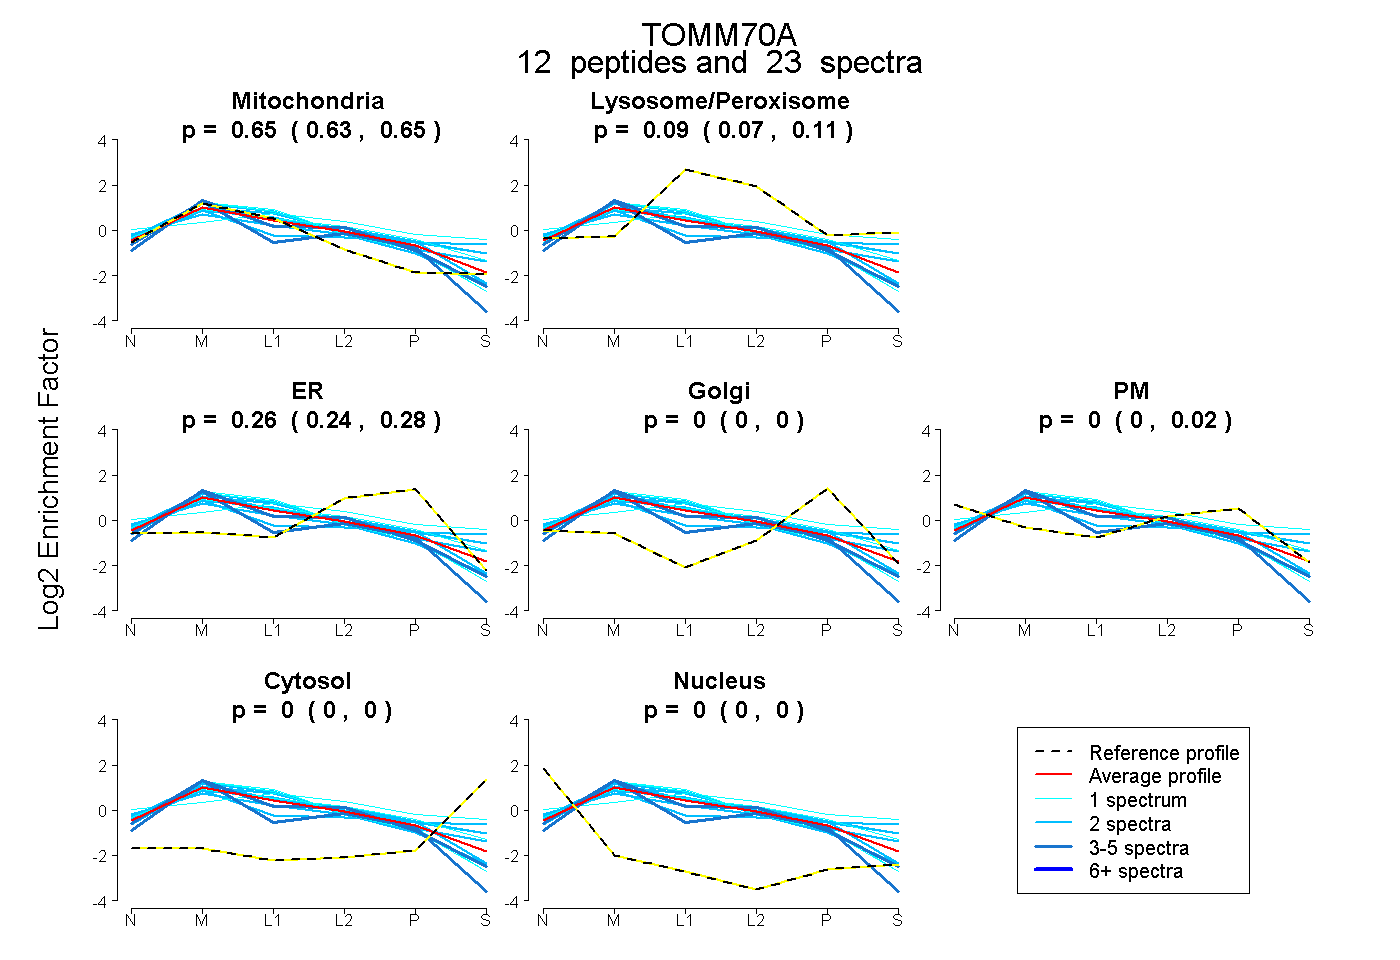
0.633 | 0.654
0.072 | 0.105
0.237 | 0.276
0.000 | 0.000
0.000 | 0.018
0.000 | 0.000
0.000 | 0.000
22peptides
spectra
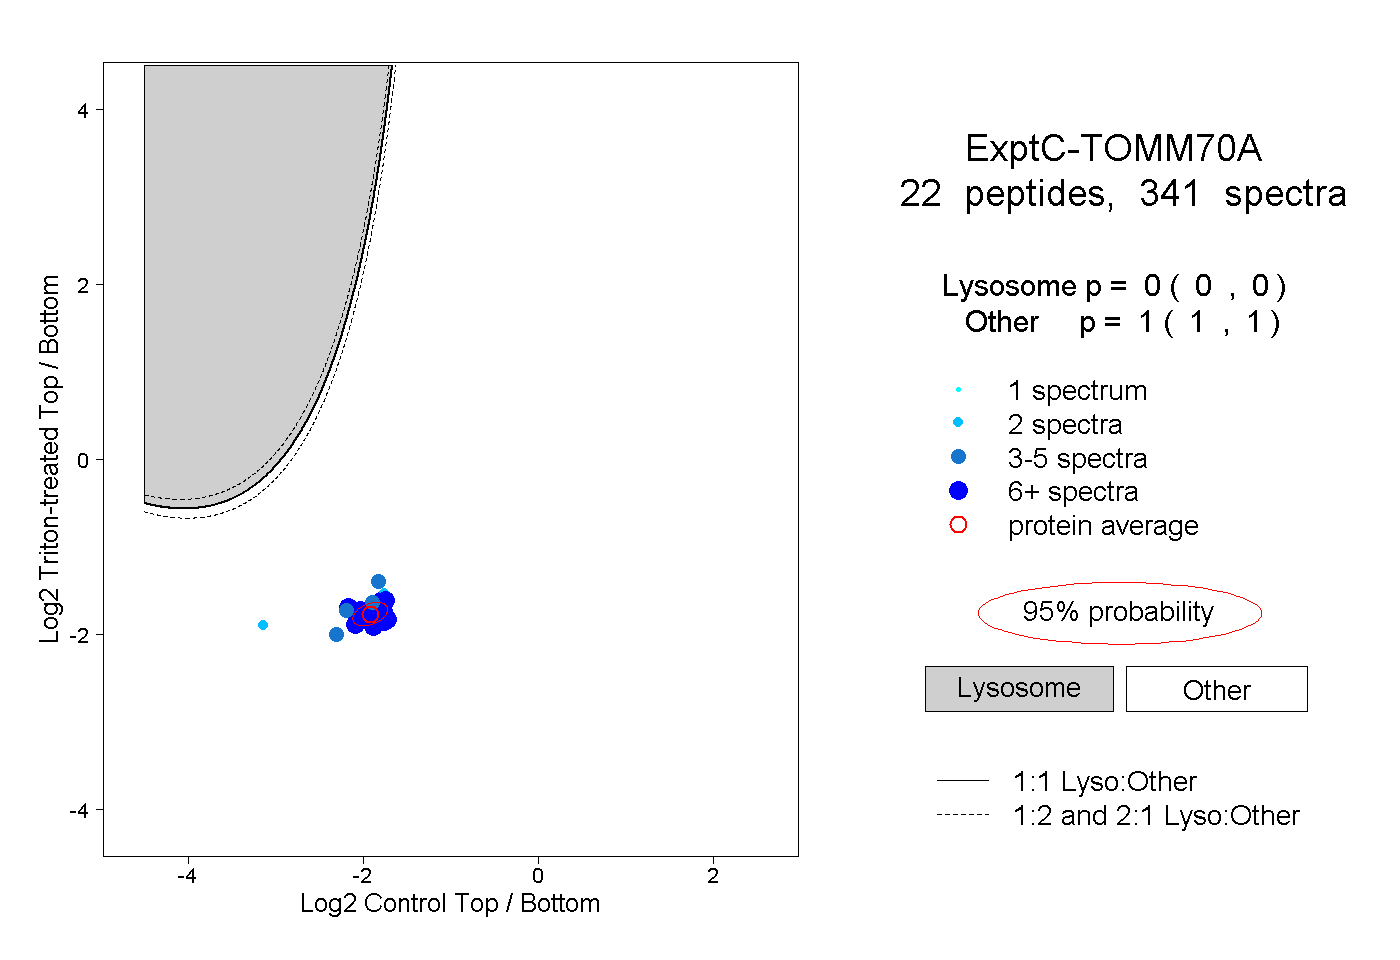
0.000 | 0.000
1.000 | 1.000
14peptides
spectra
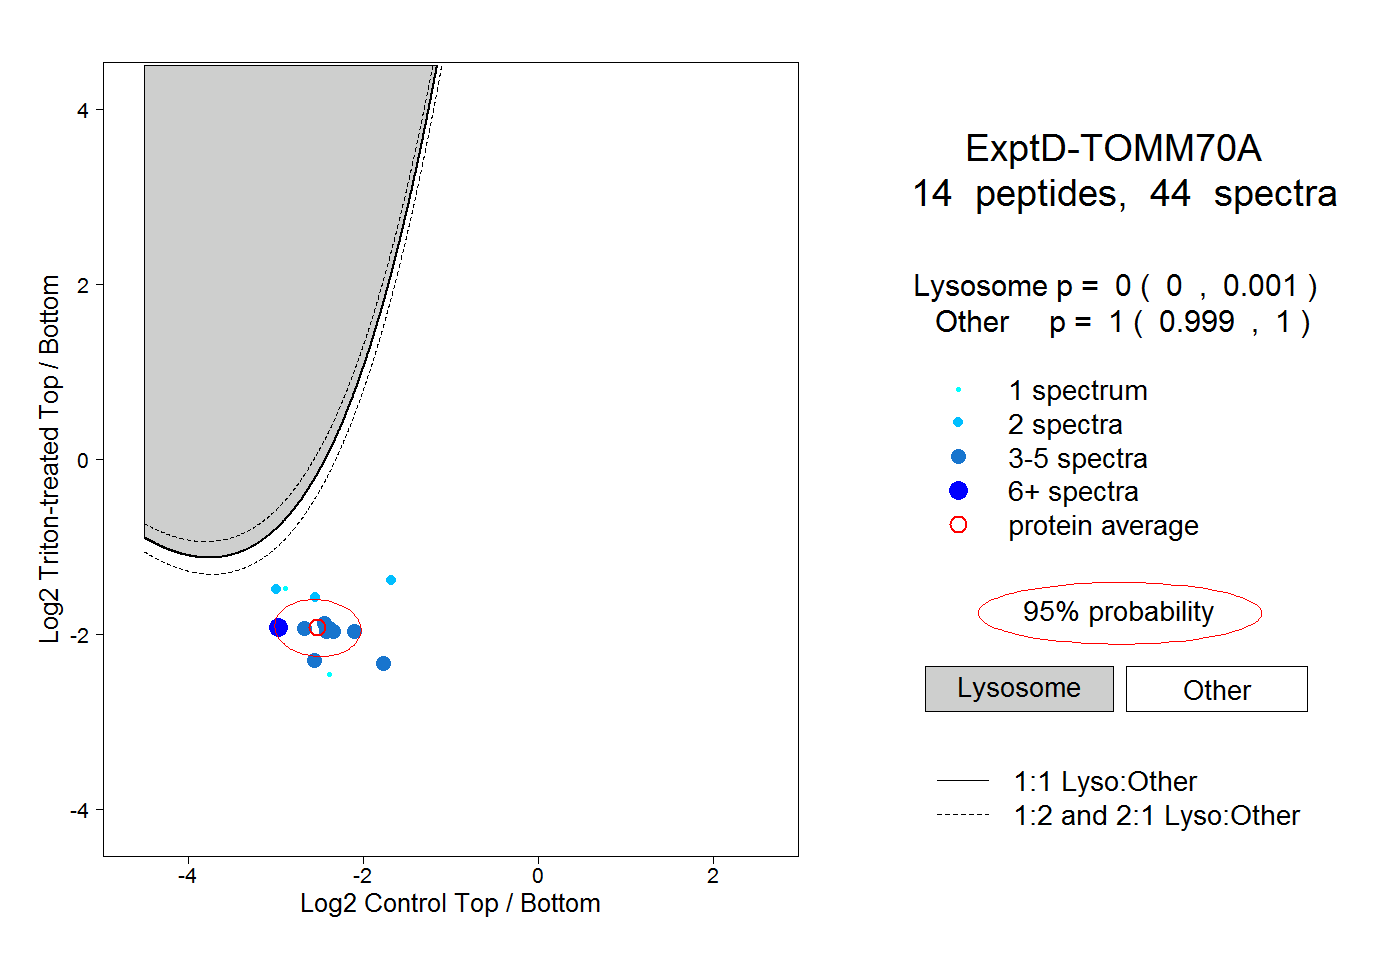
0.000 | 0.001
0.999 | 1.000