TOMM70A
[ENSRNOP00000002238]
Main page
| | | Plot |
Mito |
Lyso |
|
Perox |
ER |
Golgi |
PM |
Cytosol |
Nucleus |
|
| Expt A |
 16
16
peptides |
53
spectra |
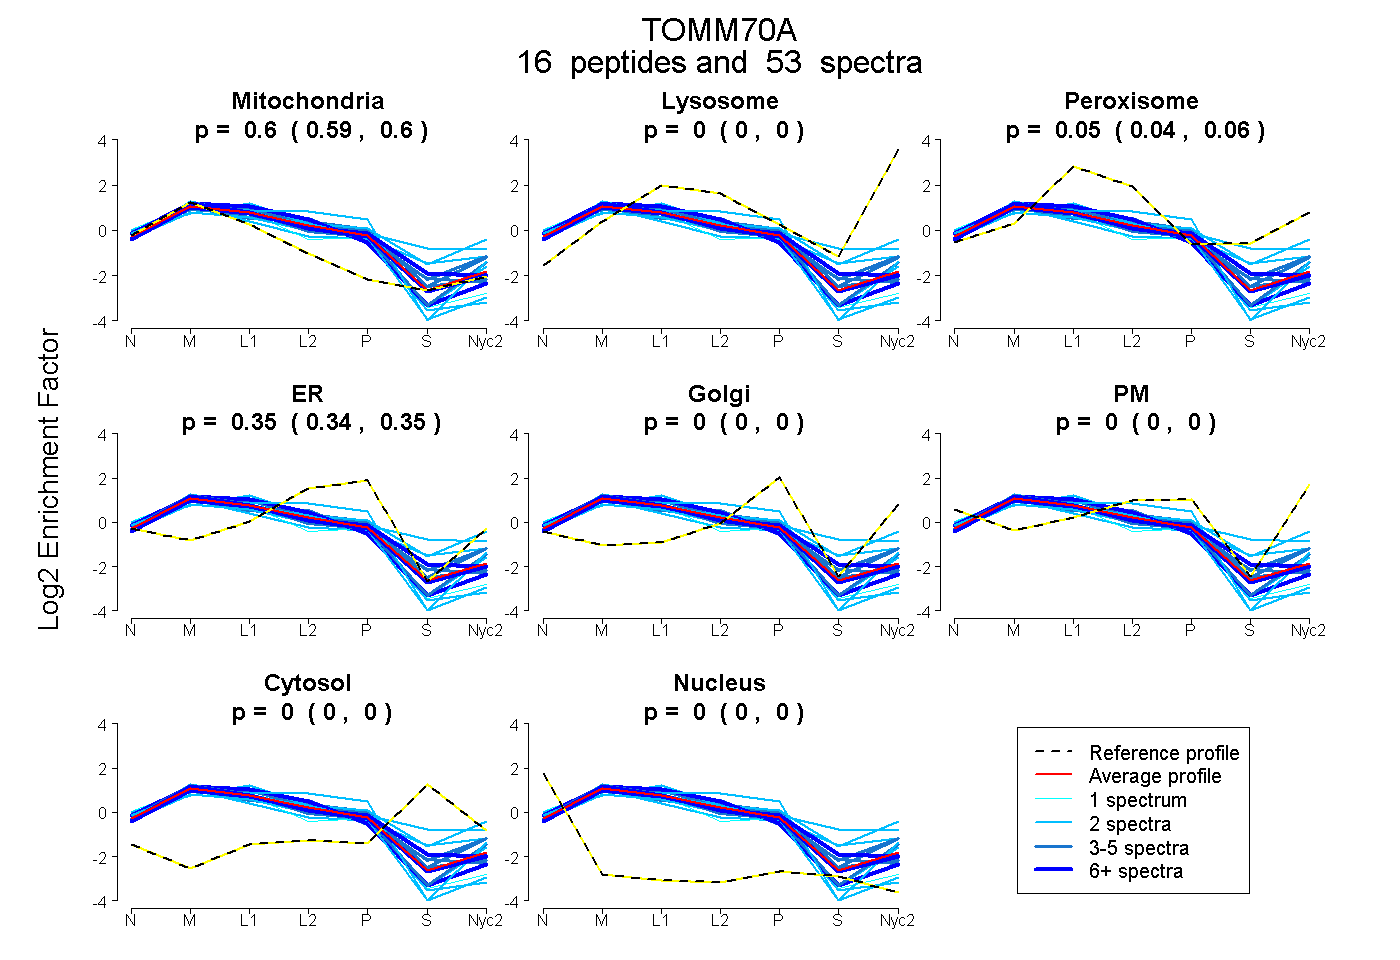 |
0.598
0.592 | 0.603 |
0.000
0.000 | 0.000 |
|
0.052
0.044 | 0.060 |
0.349
0.344 | 0.354 |
0.000
0.000 | 0.000 |
0.000
0.000 | 0.000 |
0.000
0.000 | 0.000 |
0.000
0.000 | 0.000 |
|
| | | Plot |
Mito |
|
Lyso or Perox |
|
ER |
Golgi |
PM |
Cytosol |
Nucleus |
|
| Expt B |
12
peptides |
23
spectra |
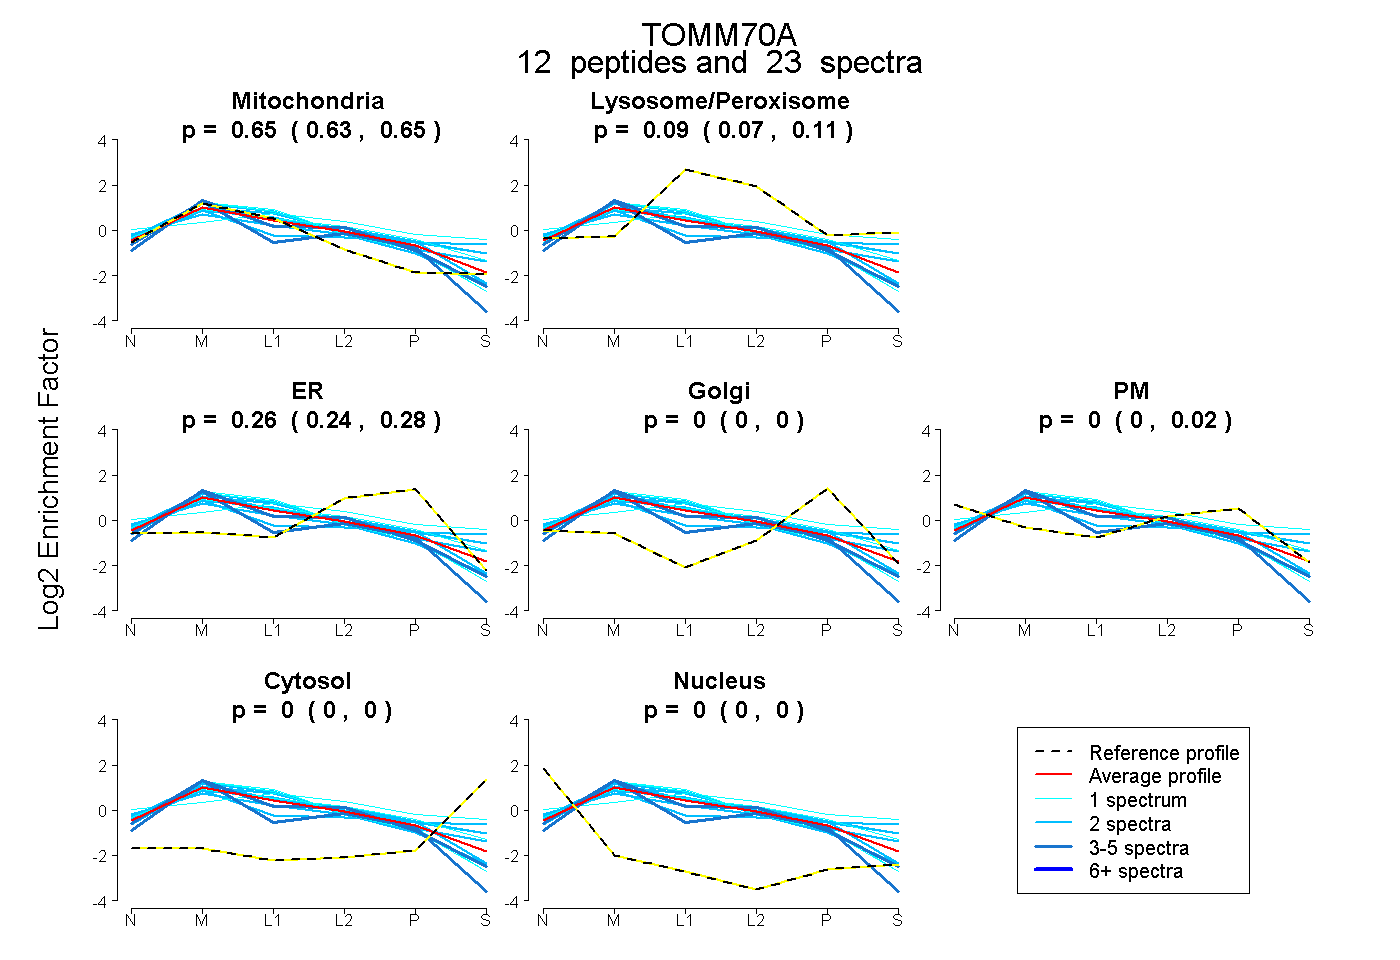 |
0.646
0.633 | 0.654 |
|
0.089
0.072 | 0.105 |
|
0.265
0.237 | 0.276 |
0.000
0.000 | 0.000 |
0.000
0.000 | 0.018 |
0.000
0.000 | 0.000 |
0.000
0.000 | 0.000 |
|
| 2 spectra, ENSGYLK |
0.622 |
|
0.235 |
|
0.032 |
0.082 |
0.030 |
0.000 |
0.000 |
|
| 2 spectra, FALAQAQK |
0.766 |
|
0.076 |
|
0.159 |
0.000 |
0.000 |
0.000 |
0.000 |
|
| 2 spectra, CFALYR |
0.385 |
|
0.246 |
|
0.000 |
0.081 |
0.174 |
0.114 |
0.000 |
|
| 2 spectra, ADEMYDK |
0.636 |
|
0.040 |
|
0.324 |
0.000 |
0.000 |
0.000 |
0.000 |
|
| 1 spectrum, EVAQDCTK |
0.179 |
|
0.421 |
|
0.000 |
0.000 |
0.307 |
0.093 |
0.000 |
|
| 2 spectra, AIEIDNK |
0.489 |
|
0.285 |
|
0.000 |
0.157 |
0.065 |
0.004 |
0.000 |
|
| 3 spectra, NADLSTFYQNR |
0.649 |
|
0.000 |
|
0.308 |
0.043 |
0.000 |
0.000 |
0.000 |
|
| 1 spectrum, GLLQLQWK |
0.770 |
|
0.025 |
|
0.204 |
0.000 |
0.000 |
0.000 |
0.000 |
|
| 2 spectra, AAAFEQLQK |
0.484 |
|
0.167 |
|
0.000 |
0.288 |
0.003 |
0.058 |
0.000 |
|
| 4 spectra, YMAEALLLR |
0.711 |
|
0.000 |
|
0.289 |
0.000 |
0.000 |
0.000 |
0.000 |
|
| 1 spectrum, IISECSK |
0.487 |
|
0.247 |
|
0.103 |
0.089 |
0.073 |
0.000 |
0.000 |
|
| 1 spectrum, GFEEVIK |
0.742 |
|
0.043 |
|
0.215 |
0.000 |
0.000 |
0.000 |
0.000 |
|
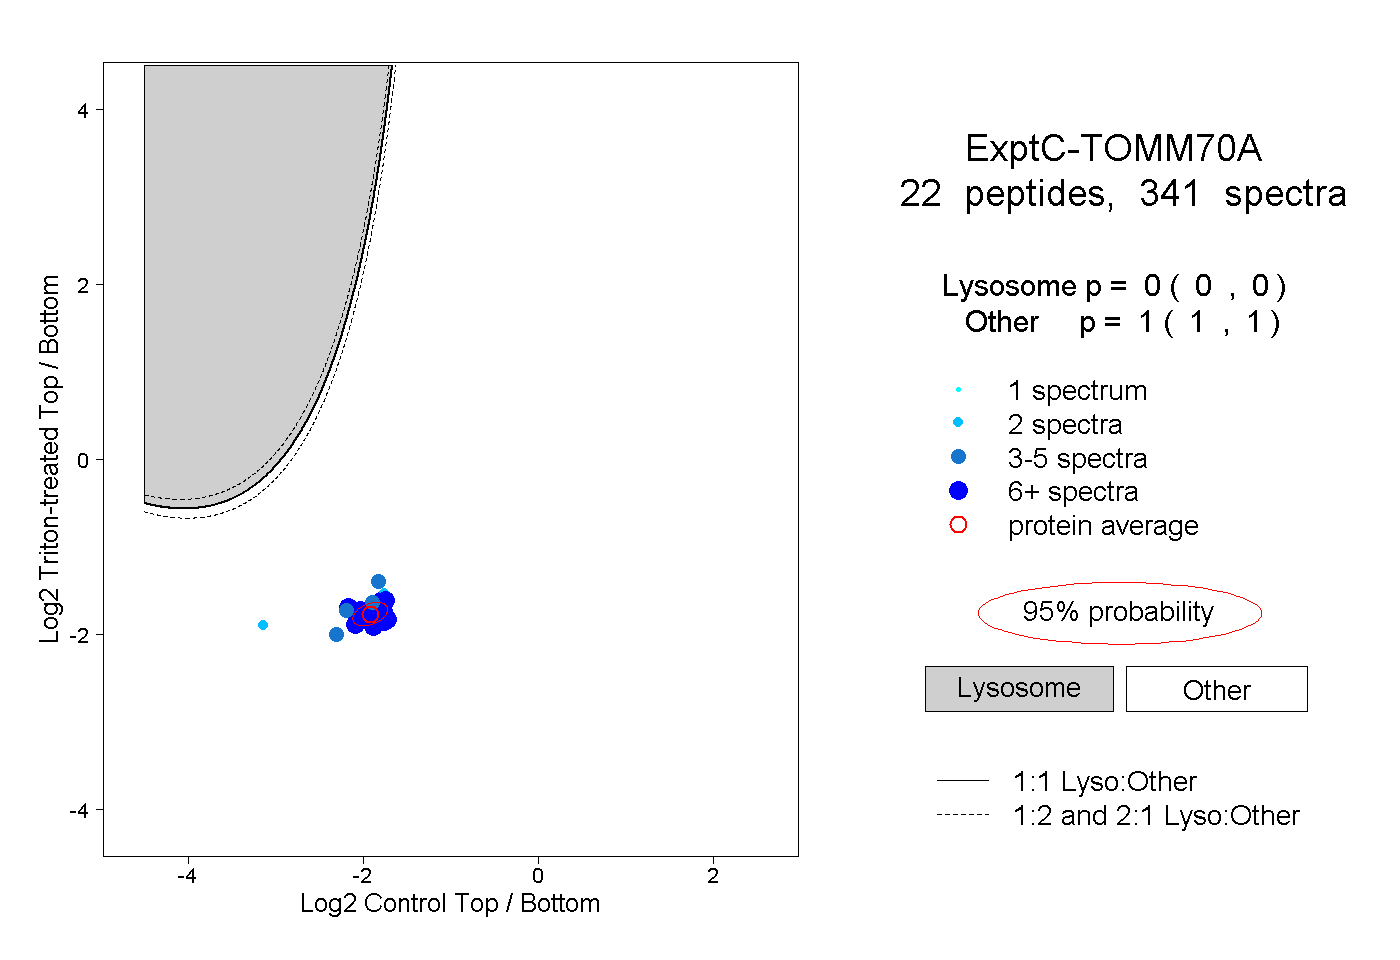
| | | Plot |
|
Lyso |
|
|
|
|
|
|
|
Other |
| Expt C |
22
peptides |
341
spectra |
 |
|
0.000
0.000 | 0.000 |
|
|
|
|
|
|
|
1.000
1.000 | 1.000 |
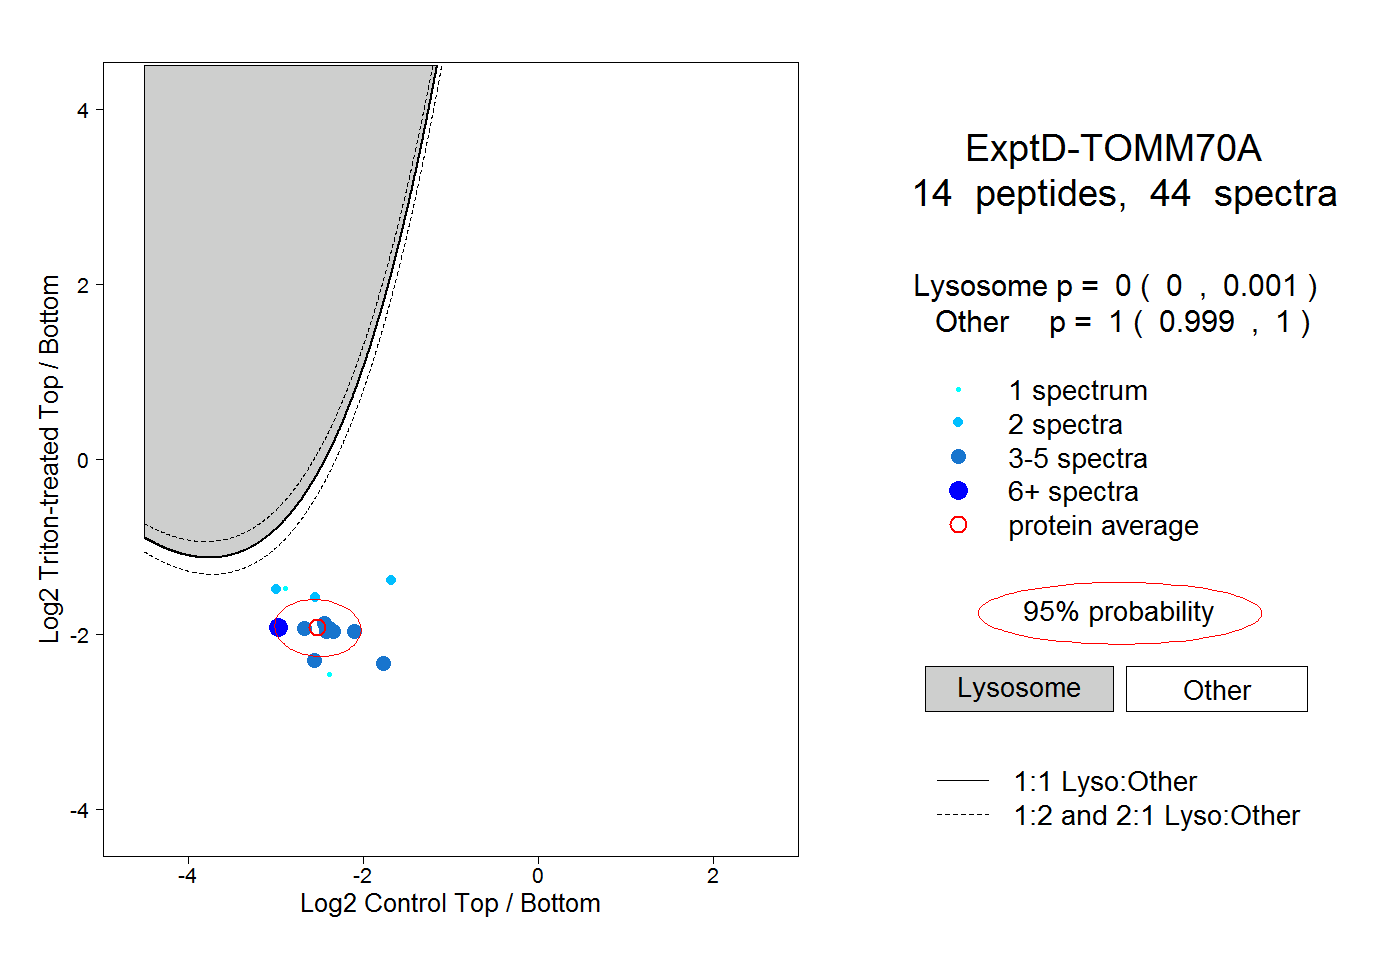
| | | Plot |
|
Lyso |
|
|
|
|
|
|
|
Other |
| Expt D |
14
peptides |
44
spectra |
 |
|
0.000
0.000 | 0.001 |
|
|
|
|
|
|
|
1.000
0.999 | 1.000 |