 16
16peptides
spectra
0.592 | 0.603
0.000 | 0.000
0.044 | 0.060
0.344 | 0.354
0.000 | 0.000
0.000 | 0.000
0.000 | 0.000
0.000 | 0.000
| Plot | Mito | Lyso | Perox | ER | Golgi | PM | Cytosol | Nucleus | |||||
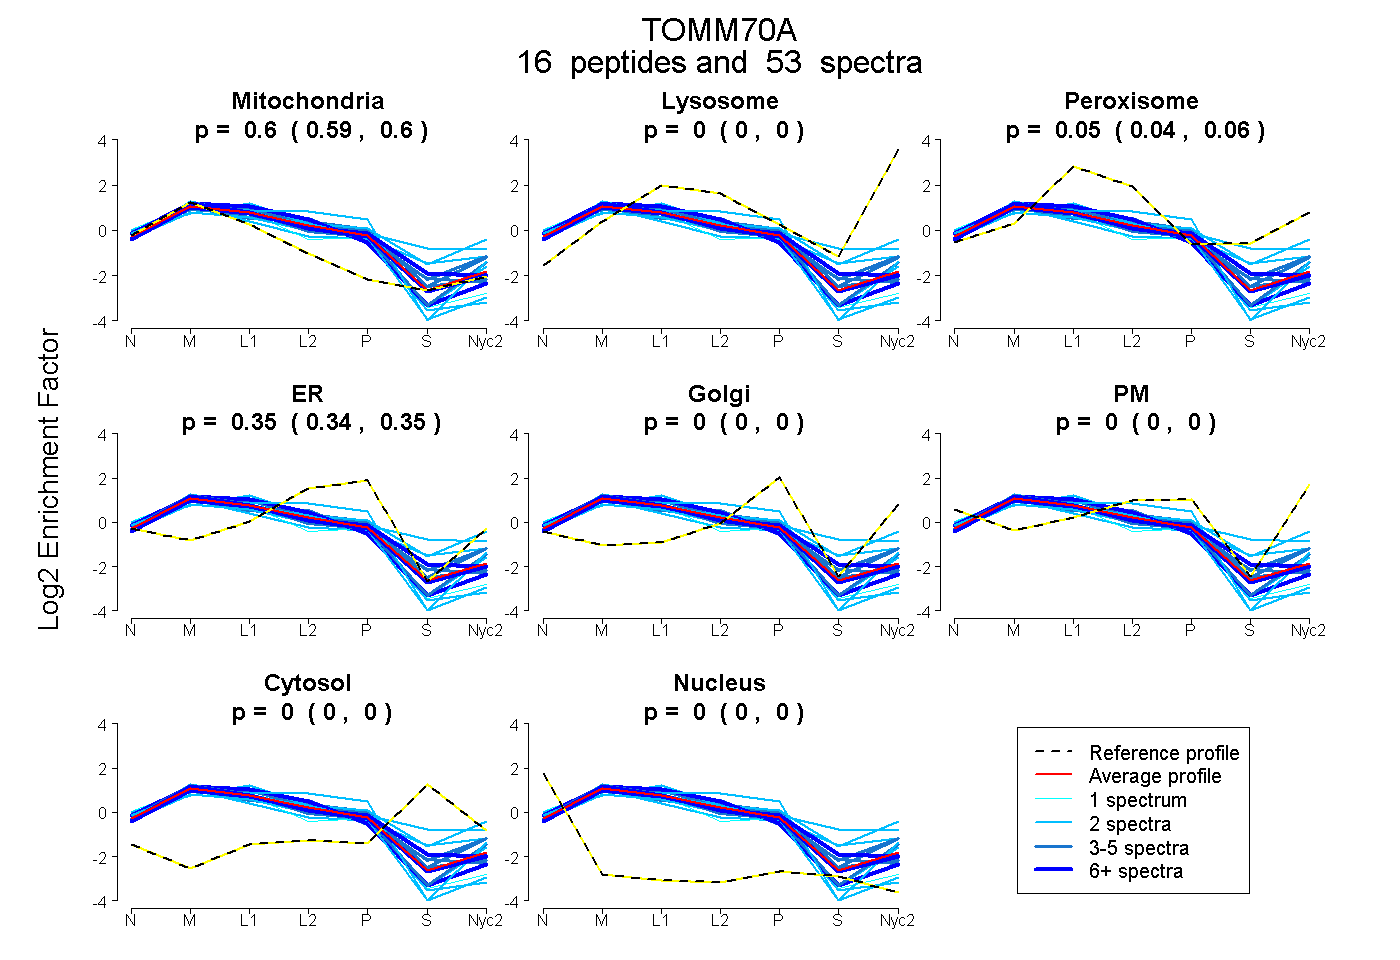
| Expt A |
16 peptides |
53 spectra |
|
0.598 0.592 | 0.603 |
0.000 0.000 | 0.000 |
0.052 0.044 | 0.060 |
0.349 0.344 | 0.354 |
0.000 0.000 | 0.000 |
0.000 0.000 | 0.000 |
0.000 0.000 | 0.000 |
0.000 0.000 | 0.000 |
| 2 spectra, GDASGLK | 0.332 | 0.000 | 0.387 | 0.095 | 0.186 | 0.000 | 0.000 | 0.000 | ||
| 4 spectra, CFALYR | 0.584 | 0.000 | 0.001 | 0.415 | 0.000 | 0.000 | 0.000 | 0.000 | ||
| 6 spectra, QYMEEENYDK | 0.578 | 0.000 | 0.109 | 0.313 | 0.000 | 0.000 | 0.000 | 0.000 | ||
| 2 spectra, QAYTANNSSQVQAAMK | 0.434 | 0.000 | 0.000 | 0.566 | 0.000 | 0.000 | 0.000 | 0.000 | ||
| 2 spectra, EIDAQGK | 0.365 | 0.000 | 0.311 | 0.049 | 0.151 | 0.000 | 0.123 | 0.000 | ||
| 2 spectra, AIEIDNK | 0.536 | 0.000 | 0.191 | 0.078 | 0.151 | 0.000 | 0.044 | 0.000 | ||
| 5 spectra, NADLSTFYQNR | 0.632 | 0.010 | 0.000 | 0.358 | 0.000 | 0.000 | 0.000 | 0.000 | ||
| 3 spectra, CIDLEPDNATTYVHK | 0.629 | 0.000 | 0.077 | 0.294 | 0.000 | 0.000 | 0.000 | 0.000 | ||
| 6 spectra, YMAEALLLR | 0.638 | 0.000 | 0.030 | 0.331 | 0.000 | 0.000 | 0.000 | 0.000 | ||
| 2 spectra, FALAQAQK | 0.630 | 0.000 | 0.003 | 0.367 | 0.000 | 0.000 | 0.000 | 0.000 | ||
| 4 spectra, ADEMYDK | 0.502 | 0.000 | 0.157 | 0.341 | 0.000 | 0.000 | 0.000 | 0.000 | ||
| 1 spectrum, AVELNPK | 0.736 | 0.000 | 0.000 | 0.264 | 0.000 | 0.000 | 0.000 | 0.000 | ||
| 7 spectra, GLLQLQWK | 0.668 | 0.000 | 0.006 | 0.326 | 0.000 | 0.000 | 0.000 | 0.000 | ||
| 2 spectra, AAAFEQLQK | 0.721 | 0.000 | 0.000 | 0.279 | 0.000 | 0.000 | 0.000 | 0.000 | ||
| 3 spectra, GFEEVIK | 0.540 | 0.000 | 0.157 | 0.294 | 0.008 | 0.000 | 0.000 | 0.000 | ||
| 2 spectra, IISECSK | 0.696 | 0.000 | 0.000 | 0.304 | 0.000 | 0.000 | 0.000 | 0.000 |
| Plot | Mito | Lyso or Perox | ER | Golgi | PM | Cytosol | Nucleus | ||||||
| Expt B |
12 peptides |
23 spectra |
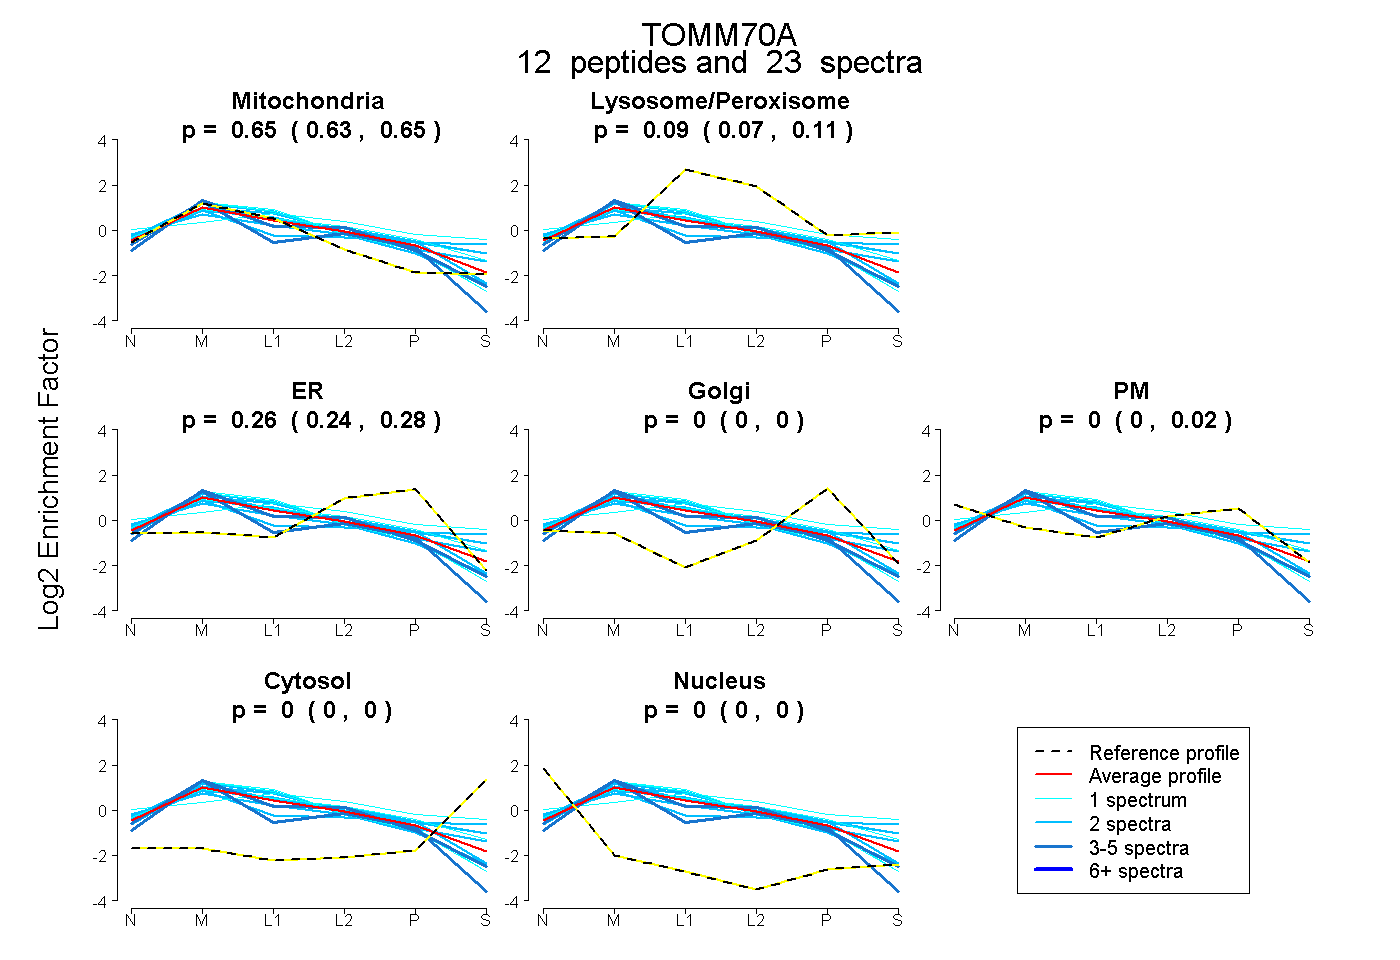 |
0.646 0.633 | 0.654 |
0.089 0.072 | 0.105 |
0.265 0.237 | 0.276 |
0.000 0.000 | 0.000 |
0.000 0.000 | 0.018 |
0.000 0.000 | 0.000 |
0.000 0.000 | 0.000 |
|||
| Plot | Lyso | Other | |||||||||||
| Expt C |
22 peptides |
341 spectra |
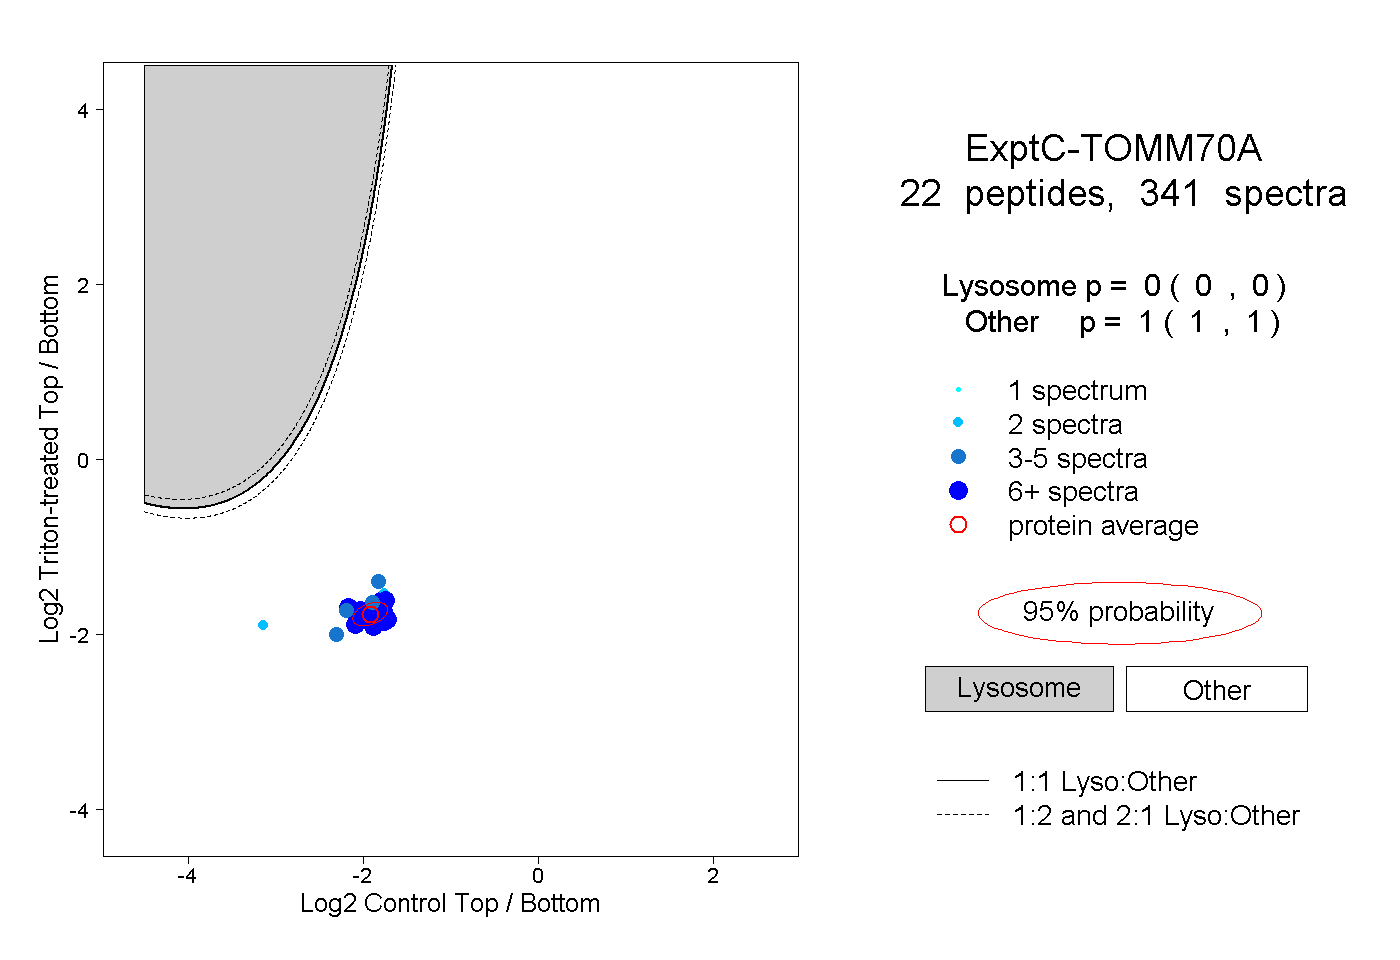 |
0.000 0.000 | 0.000 |
1.000 1.000 | 1.000 |
||||||||
| Plot | Lyso | Other | |||||||||||
| Expt D |
14 peptides |
44 spectra |
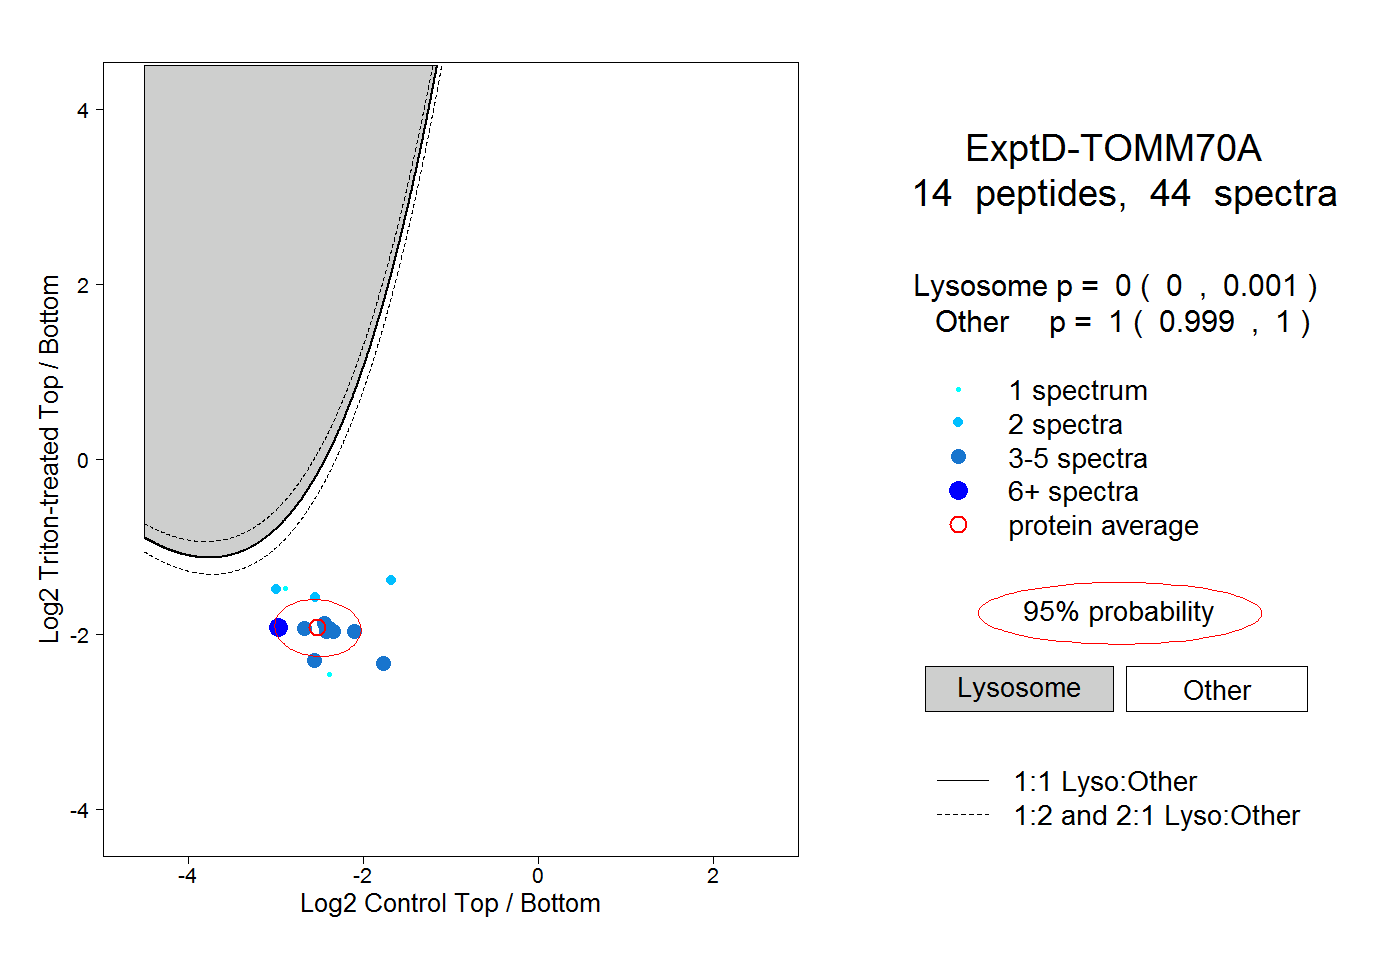 |
0.000 0.000 | 0.001 |
1.000 0.999 | 1.000 |