 4
4peptides
spectra
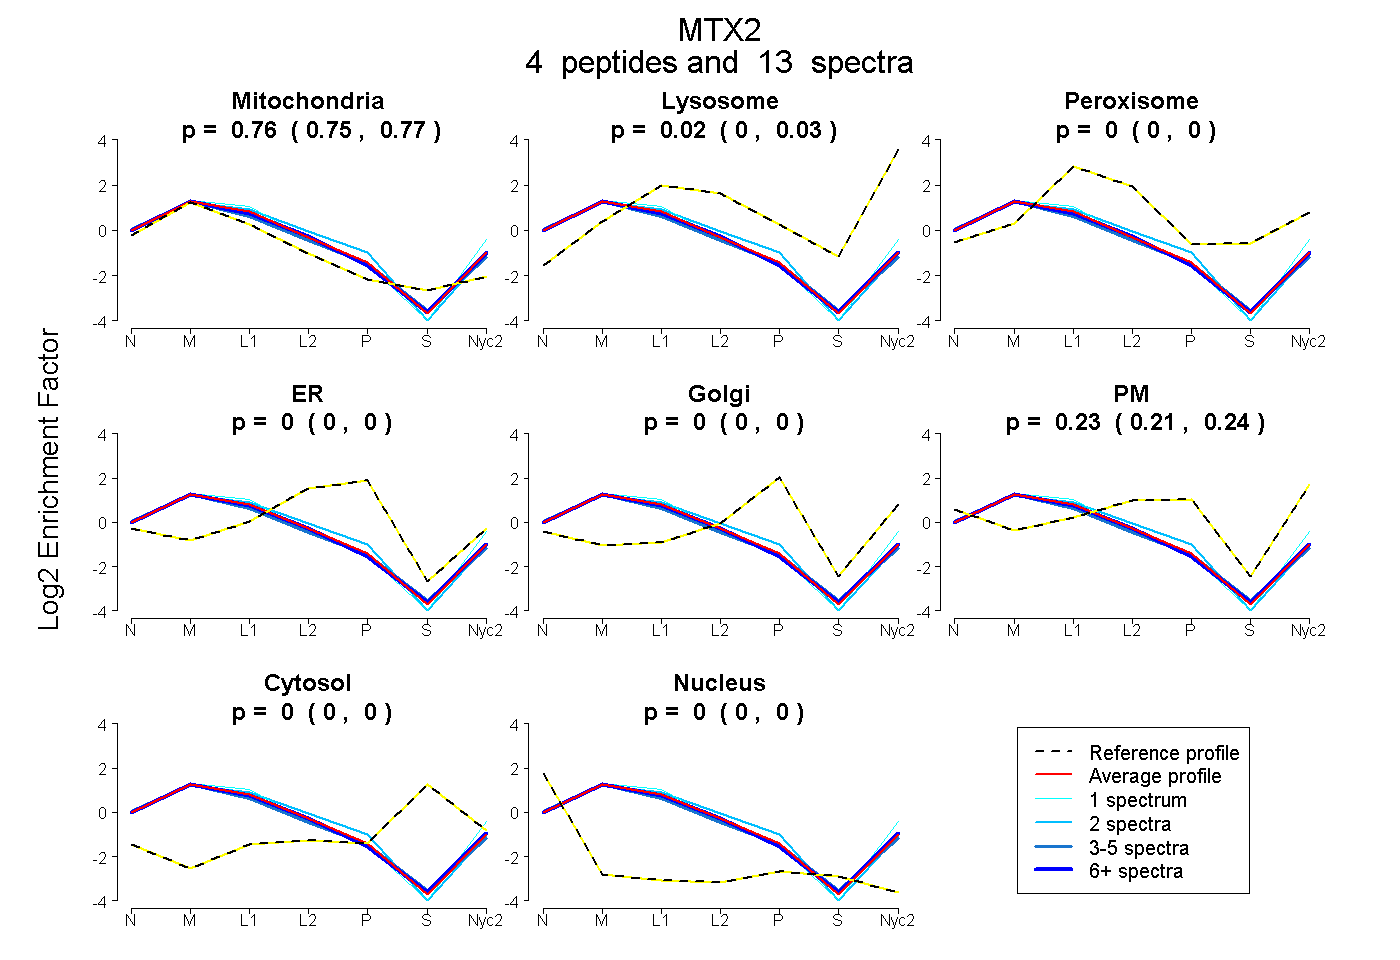
0.746 | 0.765
0.001 | 0.028
0.000 | 0.000
0.000 | 0.000
0.000 | 0.000
0.211 | 0.242
0.000 | 0.000
0.000 | 0.000
2peptides
spectra
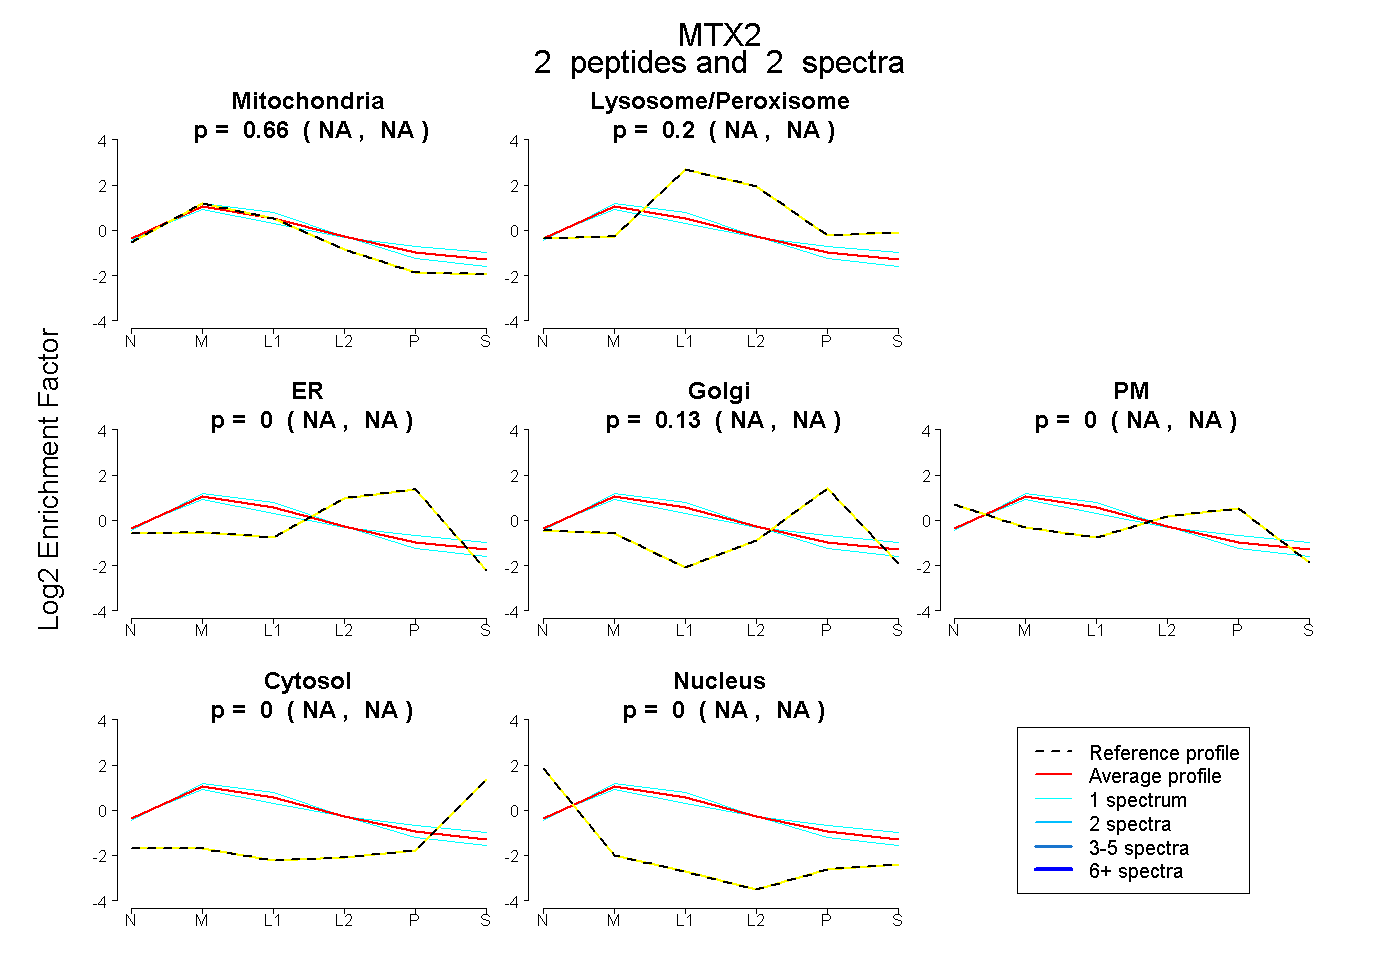
NA | NA
NA | NA
NA | NA
NA | NA
NA | NA
NA | NA
NA | NA
8peptides
spectra
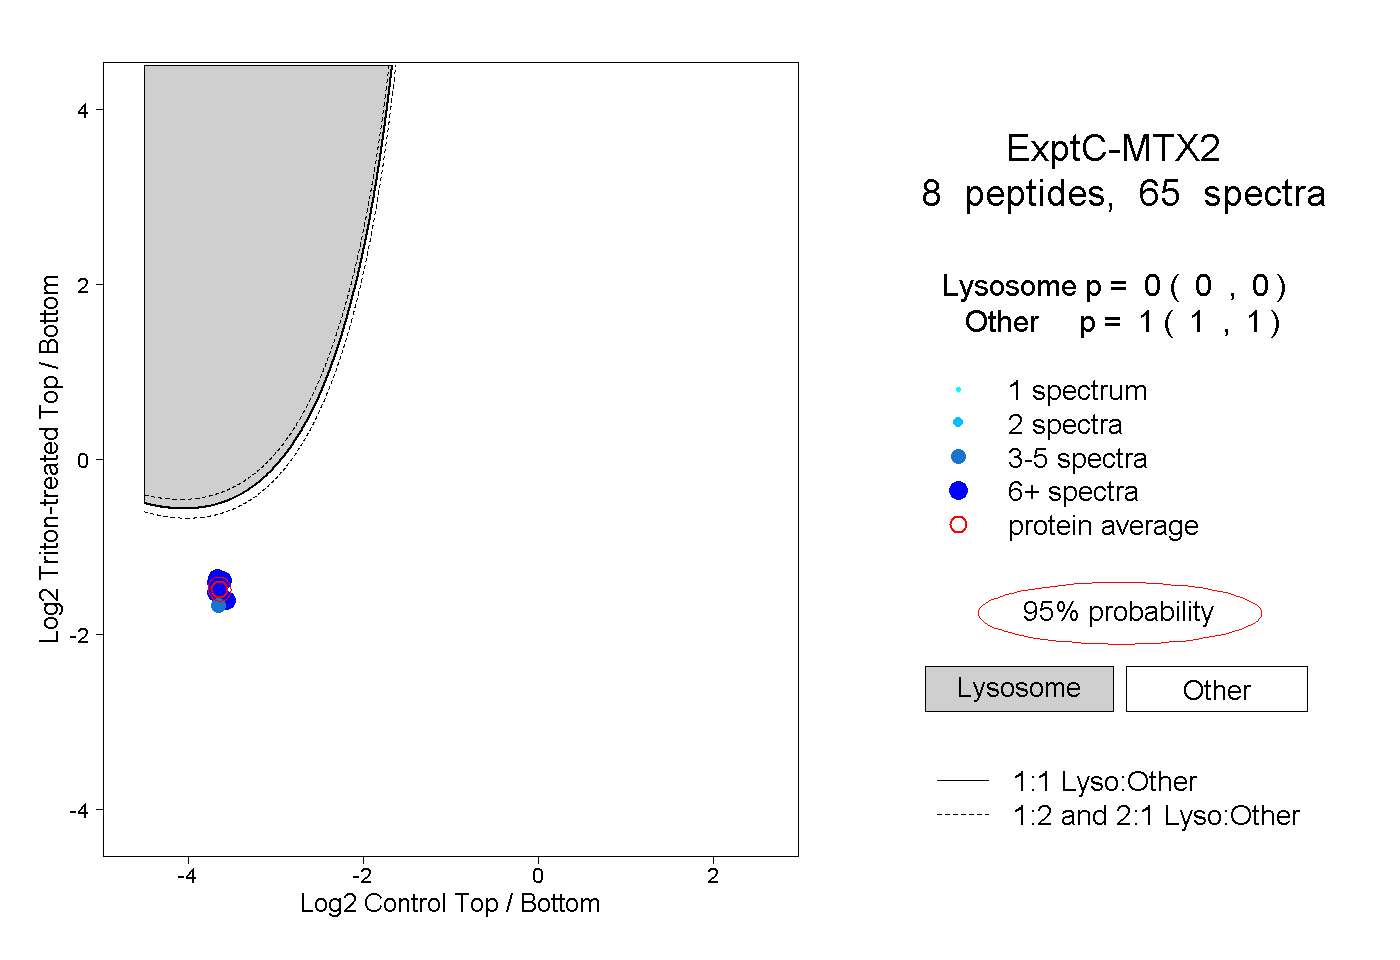
0.000 | 0.000
1.000 | 1.000
4peptides
spectra
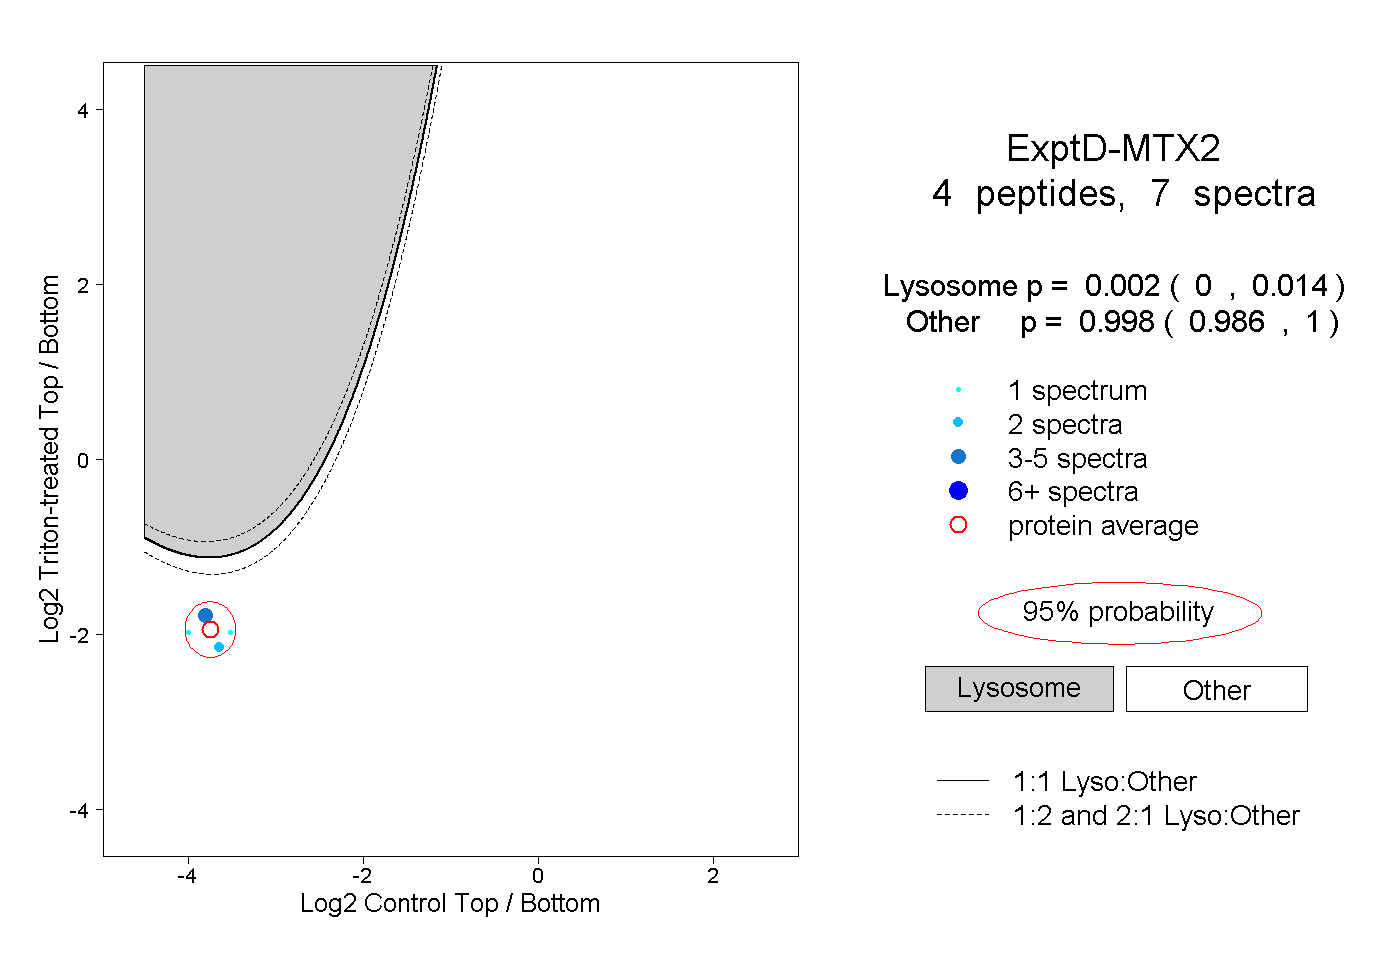
0.000 | 0.014
0.986 | 1.000