MTX2
[ENSRNOP00000002134]
Main page
| | | Plot |
Mito |
Lyso |
|
Perox |
ER |
Golgi |
PM |
Cytosol |
Nucleus |
|
| Expt A |
 4
4
peptides |
13
spectra |
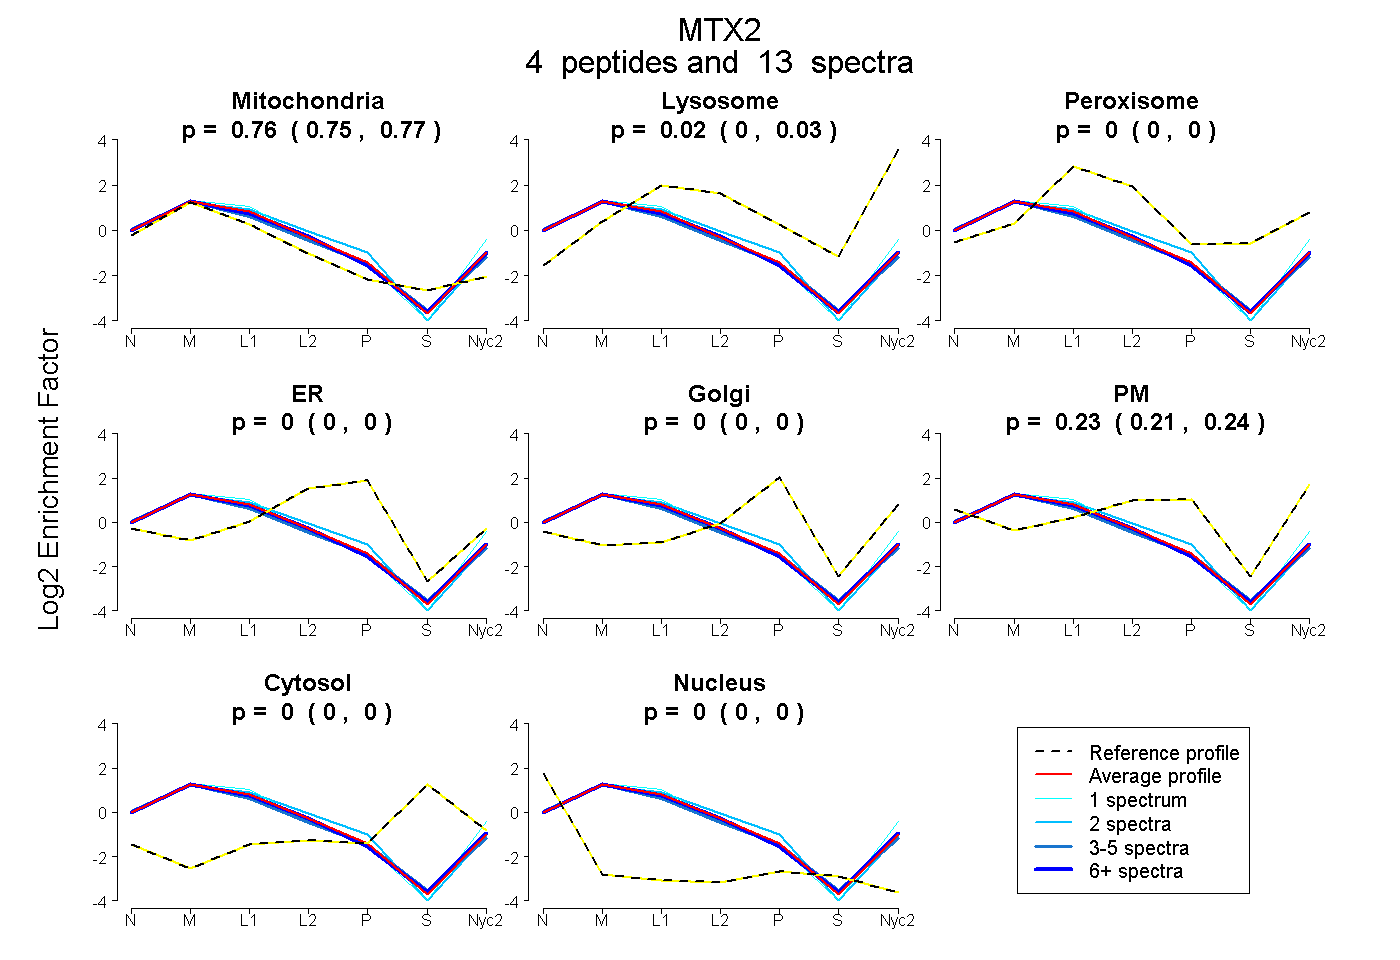 |
0.756
0.746 | 0.765 |
0.016
0.001 | 0.028 |
|
0.000
0.000 | 0.000 |
0.000
0.000 | 0.000 |
0.000
0.000 | 0.000 |
0.228
0.211 | 0.242 |
0.000
0.000 | 0.000 |
0.000
0.000 | 0.000 |
|
| | | Plot |
Mito |
|
Lyso or Perox |
|
ER |
Golgi |
PM |
Cytosol |
Nucleus |
|
| Expt B |
2
peptides |
2
spectra |
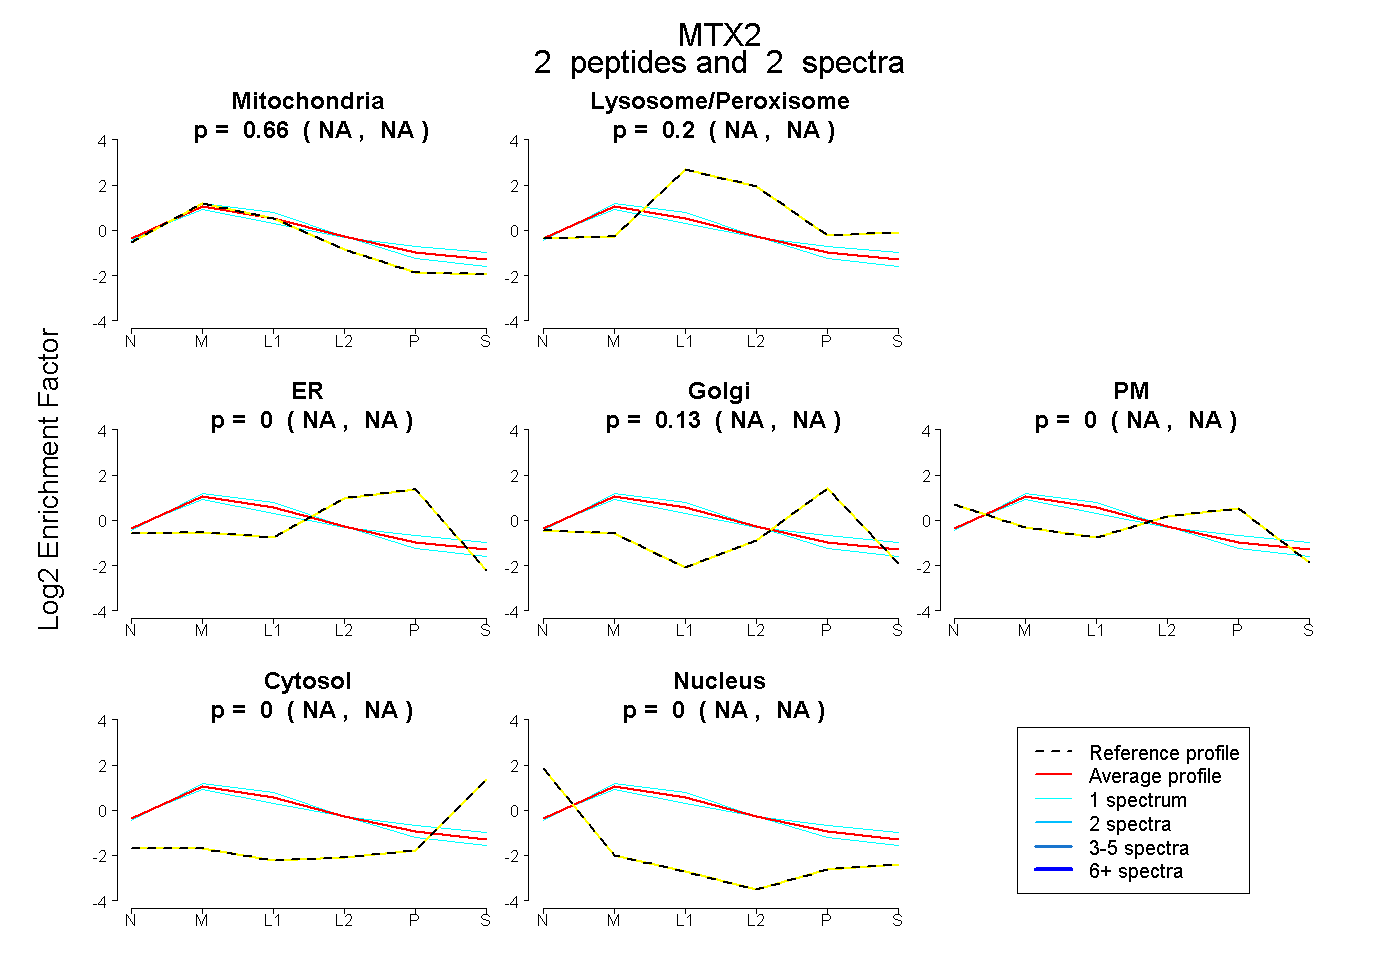 |
0.664
NA | NA |
|
0.204
NA | NA |
|
0.000
NA | NA |
0.132
NA | NA |
0.000
NA | NA |
0.000
NA | NA |
0.000
NA | NA |
|
| | | Plot |
|
Lyso |
|
|
|
|
|
|
|
Other |
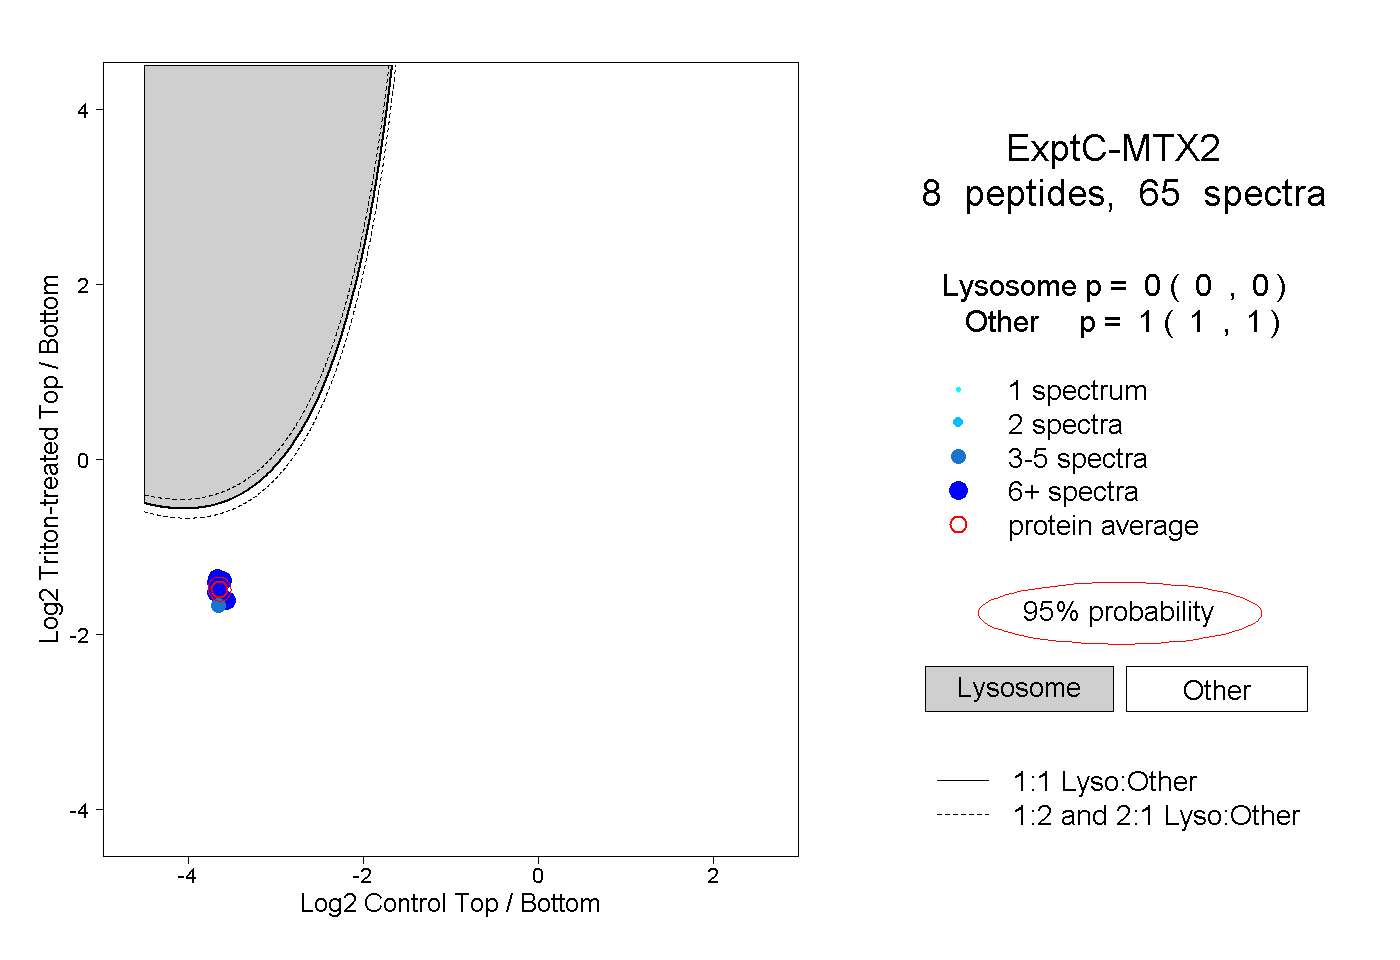
| Expt C |
8
peptides |
65
spectra |
 |
|
0.000
0.000 | 0.000 |
|
|
|
|
|
|
|
1.000
1.000 | 1.000 |
| 3 spectra, QCEVK |
|
0.000 |
|
|
|
|
|
|
|
1.000 |
| 6 spectra, CCQALSQR |
|
0.000 |
|
|
|
|
|
|
|
1.000 |
| 7 spectra, AIGWGNK |
|
0.000 |
|
|
|
|
|
|
|
1.000 |
| 12 spectra, TLDQVLEDVDR |
|
0.000 |
|
|
|
|
|
|
|
1.000 |
| 11 spectra, ANAEYMSPSGK |
|
0.000 |
|
|
|
|
|
|
|
1.000 |
| 11 spectra, IEQDYFEDR |
|
0.000 |
|
|
|
|
|
|
|
1.000 |
| 7 spectra, NYSNLLAFCR |
|
0.000 |
|
|
|
|
|
|
|
1.000 |
| 8 spectra, LGTQPYFFDK |
|
0.000 |
|
|
|
|
|
|
|
1.000 |
| | | Plot |
|
Lyso |
|
|
|
|
|
|
|
Other |
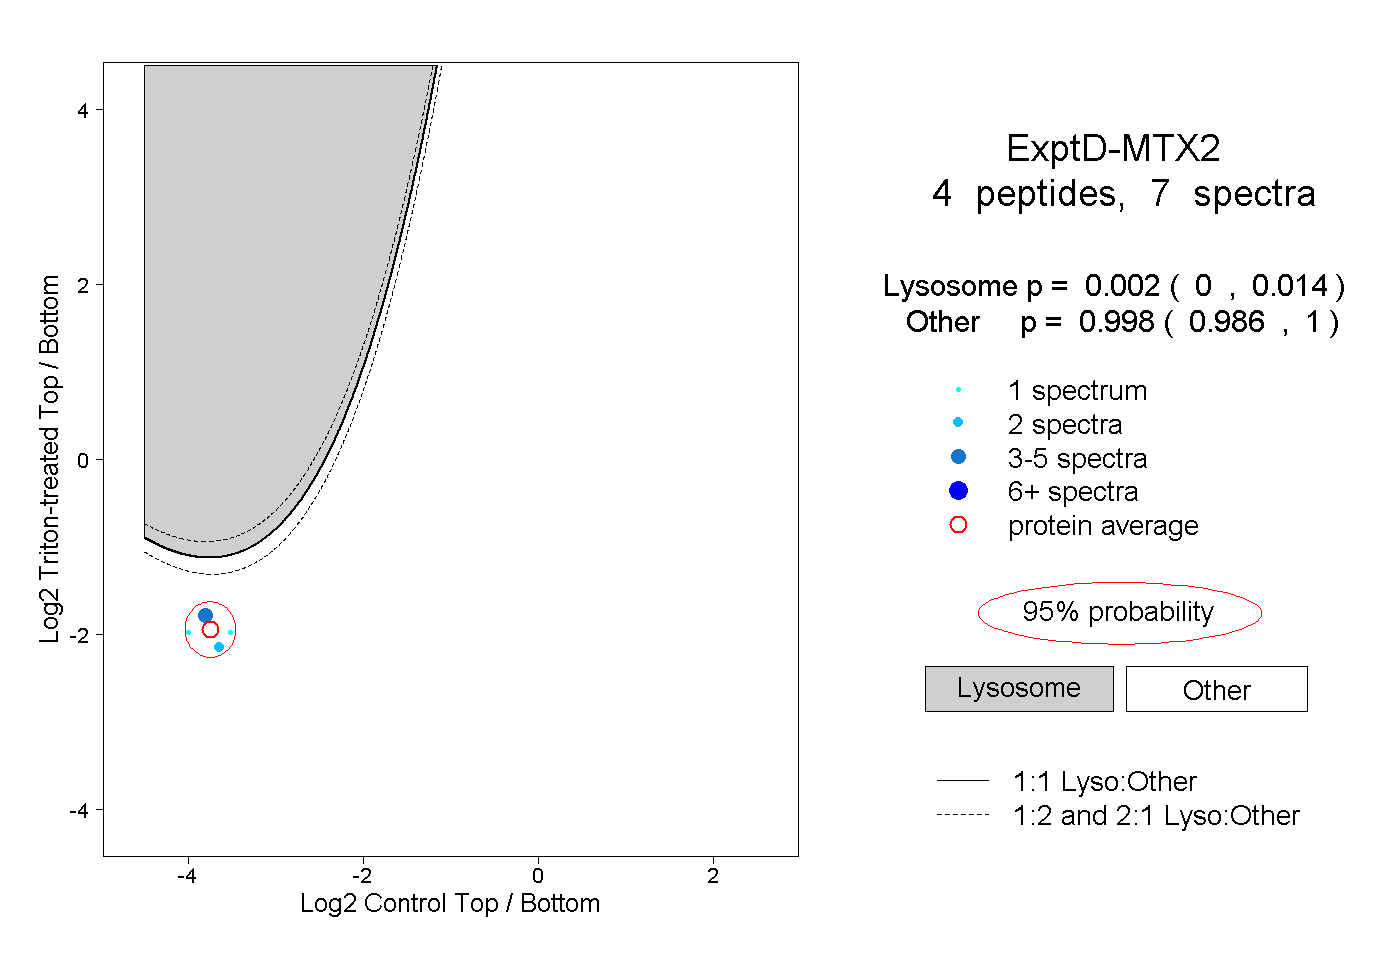
| Expt D |
4
peptides |
7
spectra |
 |
|
0.002
0.000 | 0.014 |
|
|
|
|
|
|
|
0.998
0.986 | 1.000 |