 4
4peptides
spectra
0.746 | 0.765
0.001 | 0.028
0.000 | 0.000
0.000 | 0.000
0.000 | 0.000
0.211 | 0.242
0.000 | 0.000
0.000 | 0.000
| Plot | Mito | Lyso | Perox | ER | Golgi | PM | Cytosol | Nucleus | |||||
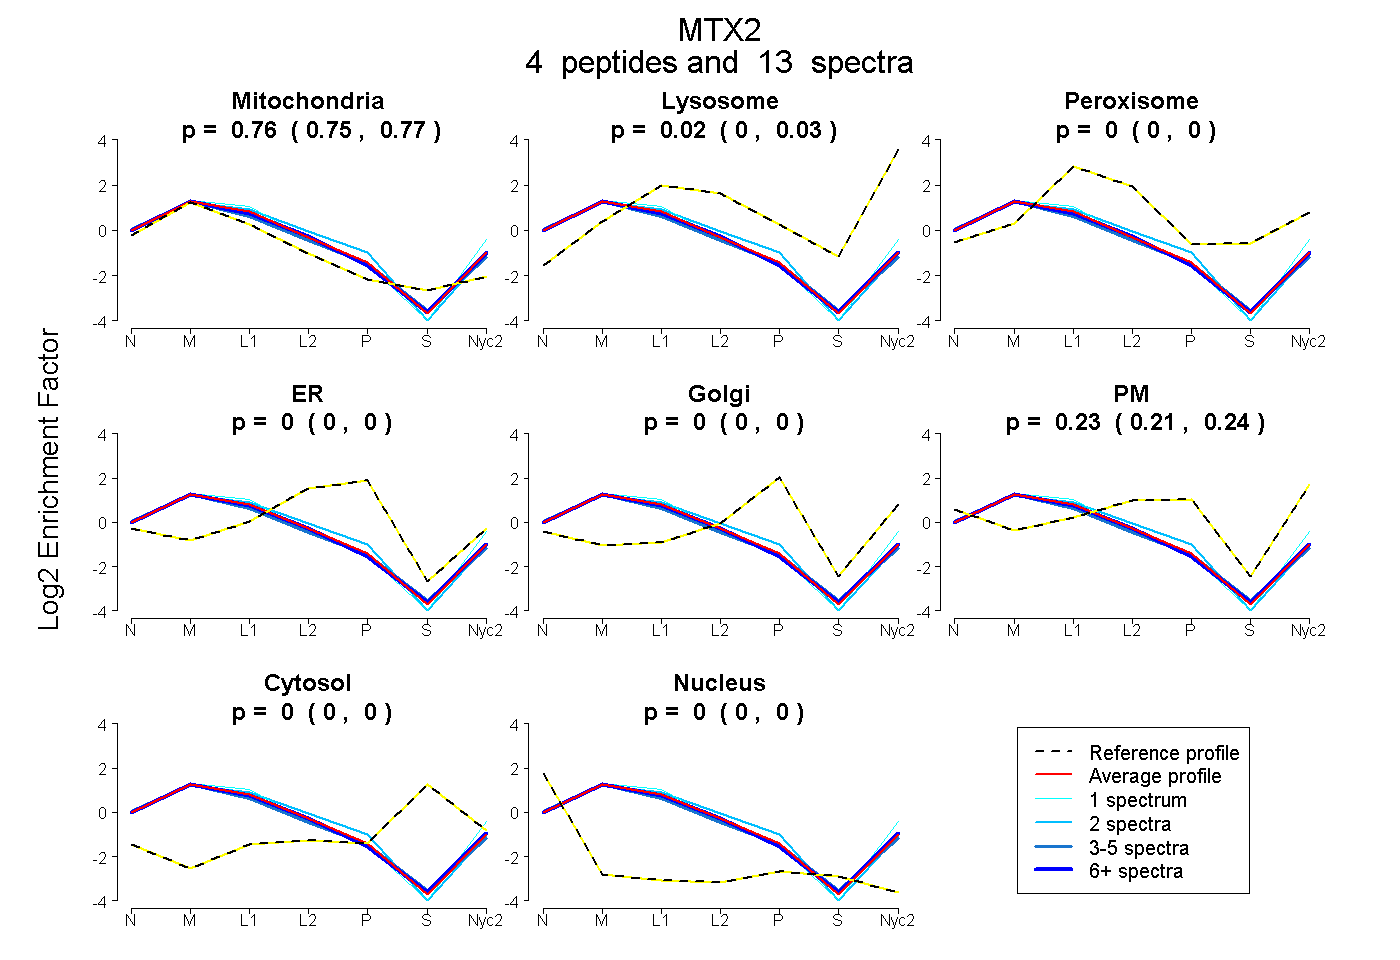
| Expt A |
4 peptides |
13 spectra |
|
0.756 0.746 | 0.765 |
0.016 0.001 | 0.028 |
0.000 0.000 | 0.000 |
0.000 0.000 | 0.000 |
0.000 0.000 | 0.000 |
0.228 0.211 | 0.242 |
0.000 0.000 | 0.000 |
0.000 0.000 | 0.000 |
| 7 spectra, TLDQVLEDVDR | 0.770 | 0.028 | 0.000 | 0.000 | 0.000 | 0.202 | 0.000 | 0.000 | ||
| 1 spectrum, GHSLSDGLDEVQK | 0.712 | 0.081 | 0.000 | 0.000 | 0.000 | 0.207 | 0.000 | 0.000 | ||
| 2 spectra, ANAEYMSPSGK | 0.686 | 0.000 | 0.000 | 0.109 | 0.000 | 0.205 | 0.000 | 0.000 | ||
| 3 spectra, IEQDYFEDR | 0.789 | 0.000 | 0.000 | 0.000 | 0.000 | 0.211 | 0.000 | 0.000 |
| Plot | Mito | Lyso or Perox | ER | Golgi | PM | Cytosol | Nucleus | ||||||
| Expt B |
2 peptides |
2 spectra |
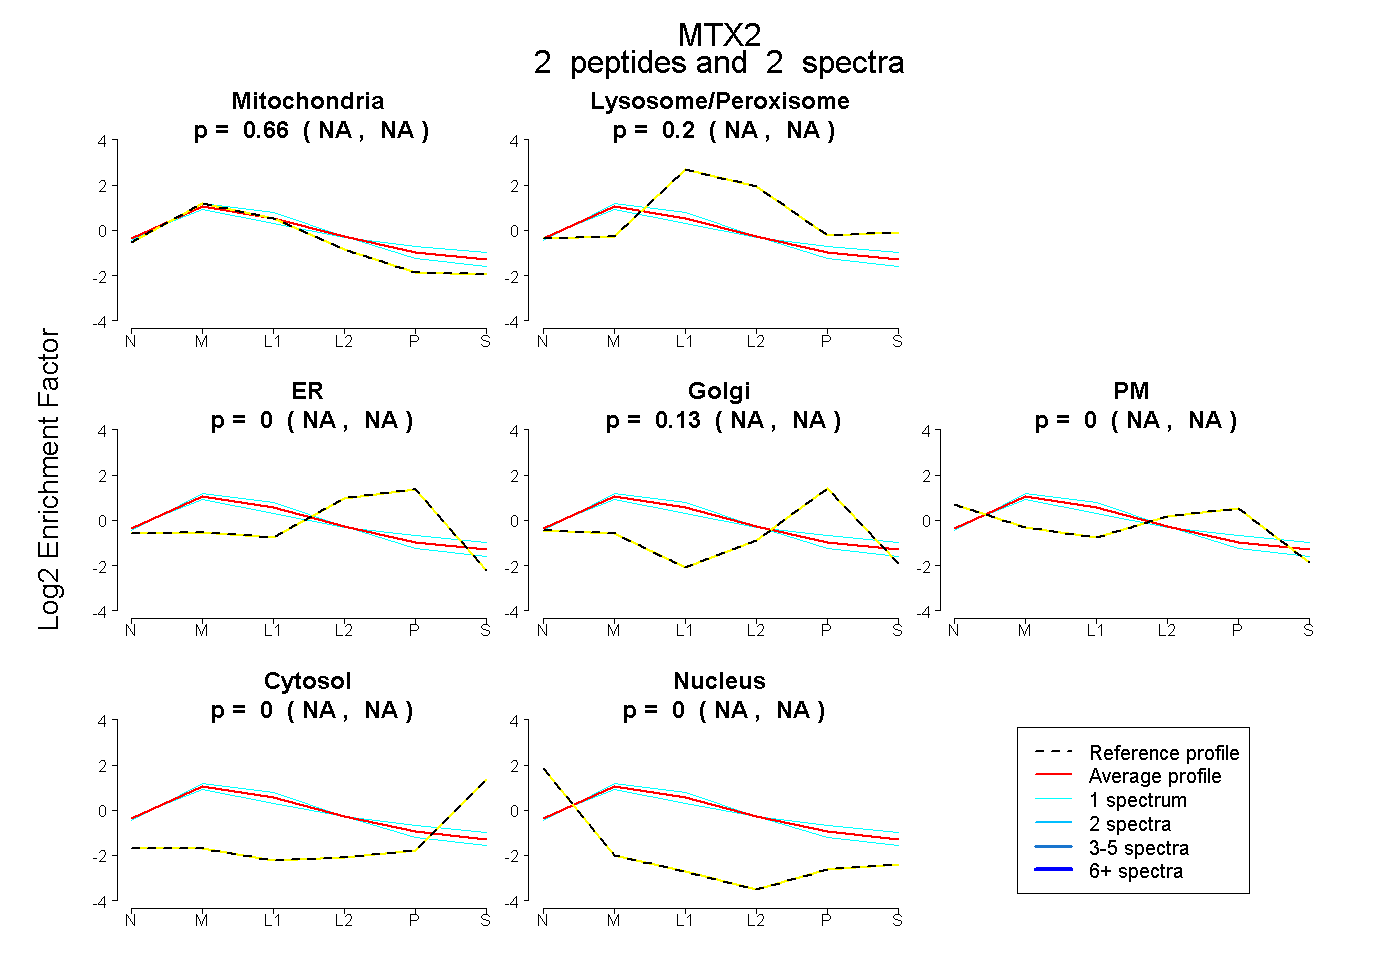 |
0.664 NA | NA |
0.204 NA | NA |
0.000 NA | NA |
0.132 NA | NA |
0.000 NA | NA |
0.000 NA | NA |
0.000 NA | NA |
|||
| Plot | Lyso | Other | |||||||||||
| Expt C |
8 peptides |
65 spectra |
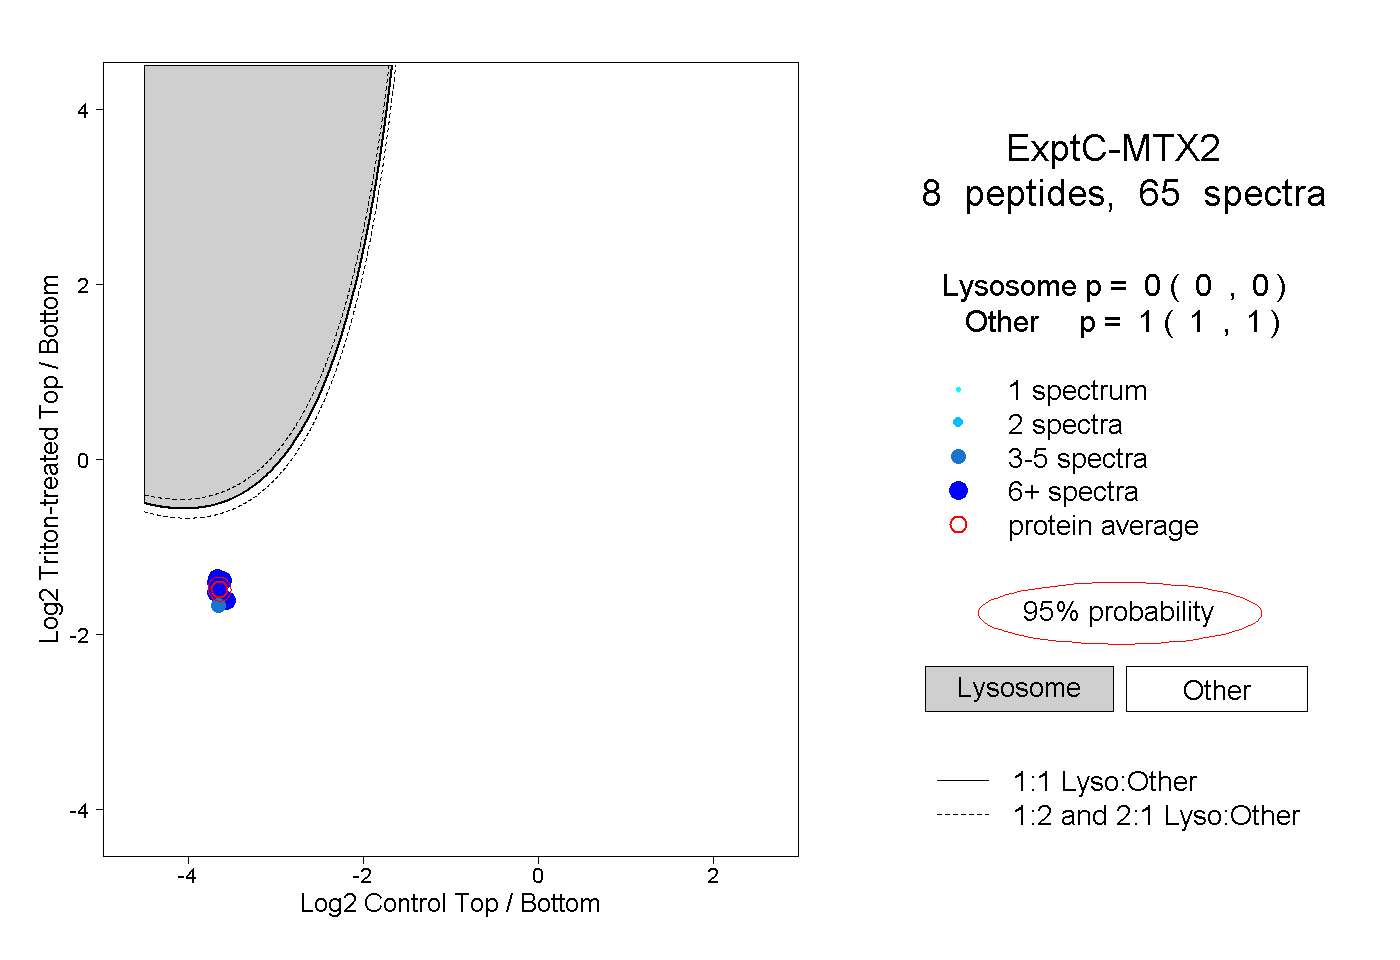 |
0.000 0.000 | 0.000 |
1.000 1.000 | 1.000 |
||||||||
| Plot | Lyso | Other | |||||||||||
| Expt D |
4 peptides |
7 spectra |
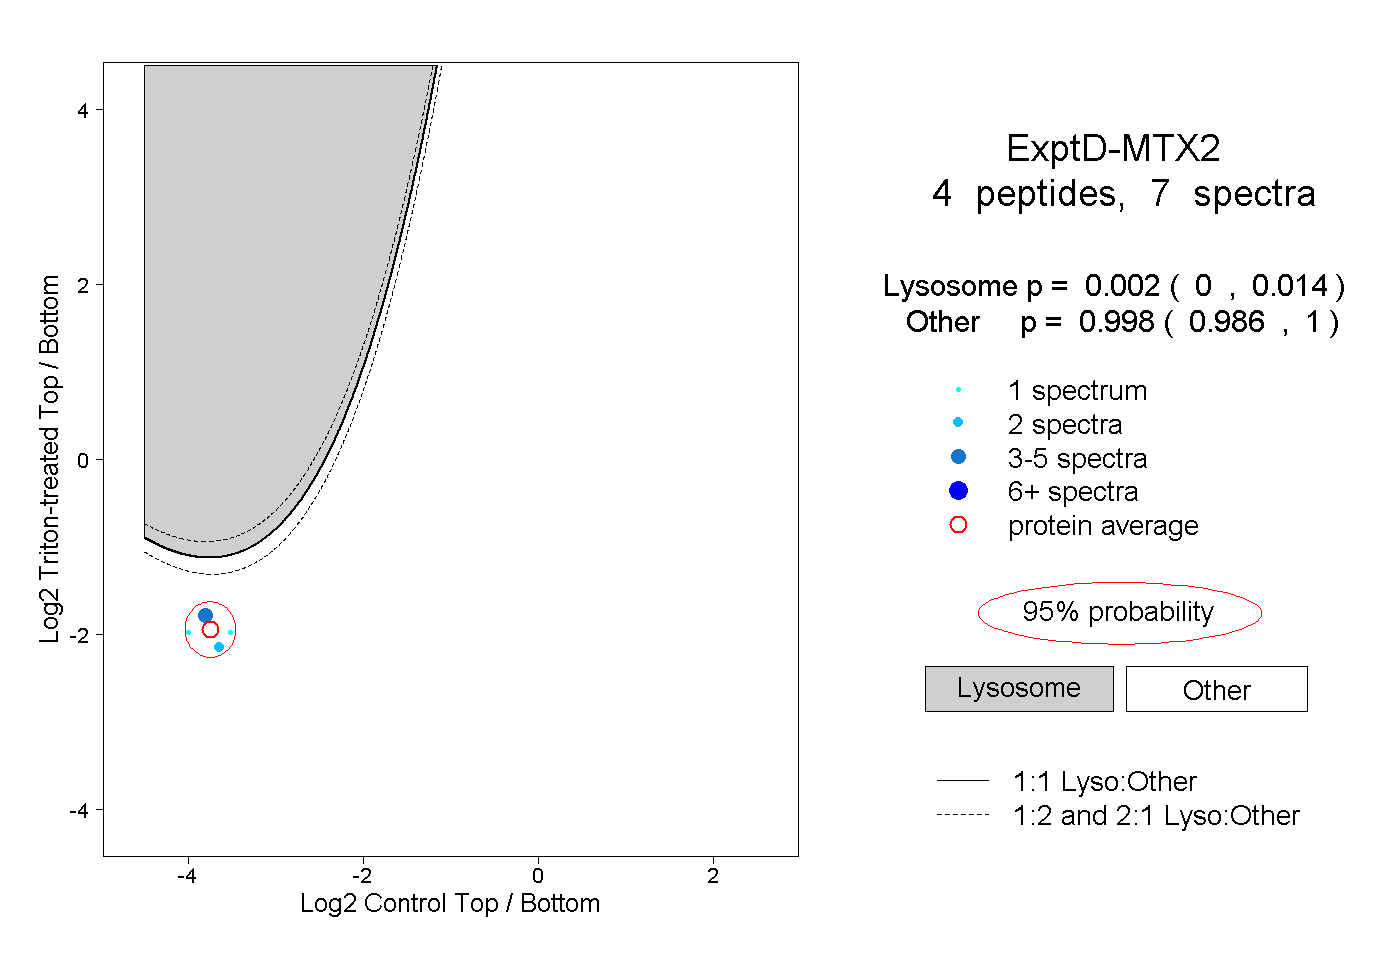 |
0.002 0.000 | 0.014 |
0.998 0.986 | 1.000 |