 12
12peptides
spectra
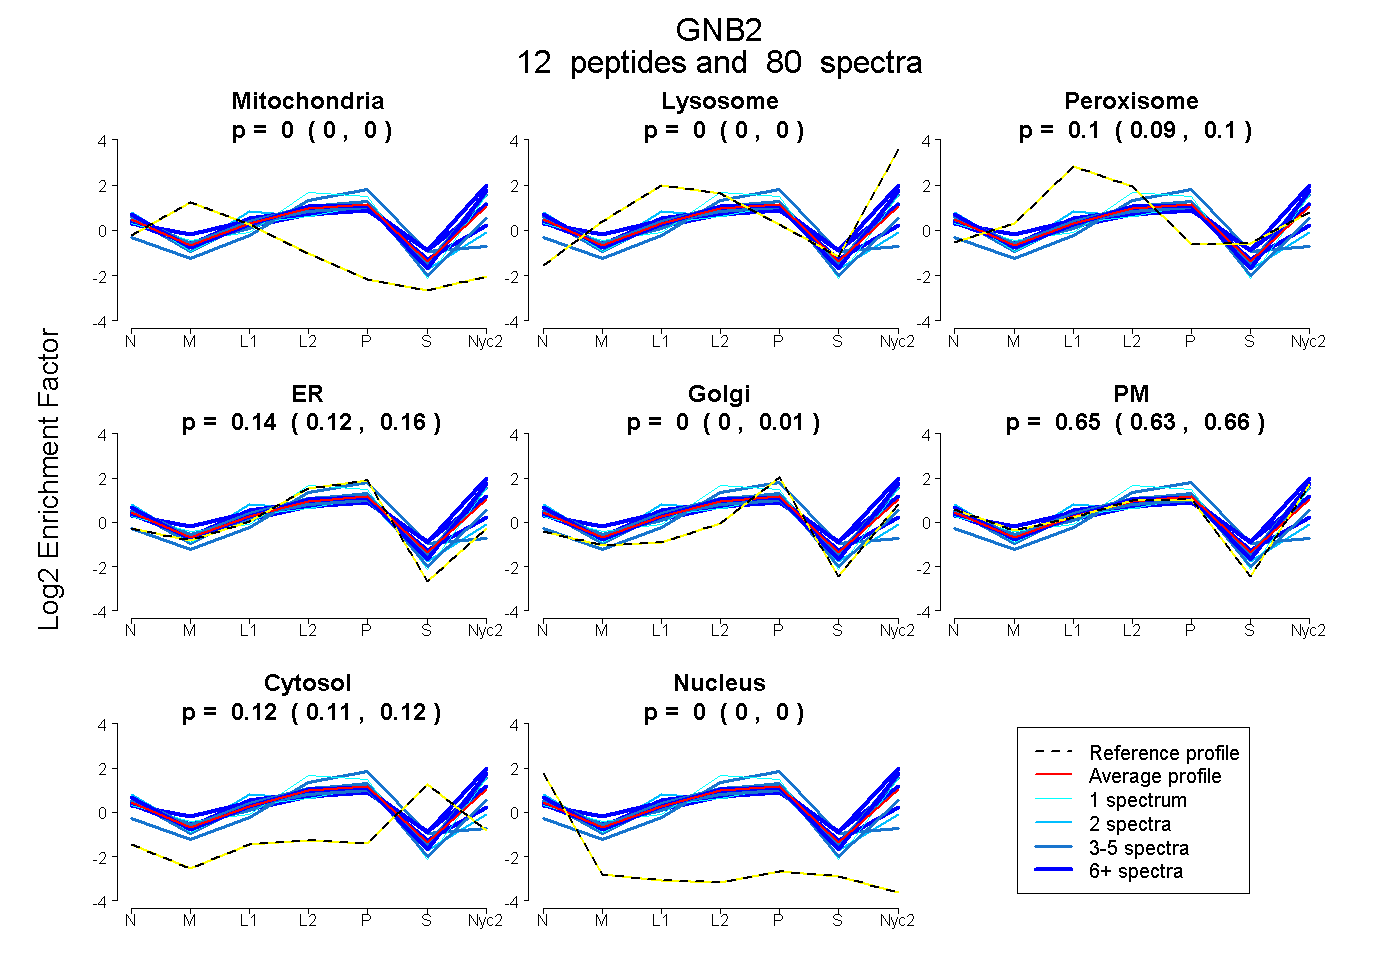
0.000 | 0.000
0.000 | 0.000
0.092 | 0.101
0.119 | 0.156
0.000 | 0.010
0.625 | 0.663
0.112 | 0.119
0.000 | 0.000
6peptides
spectra
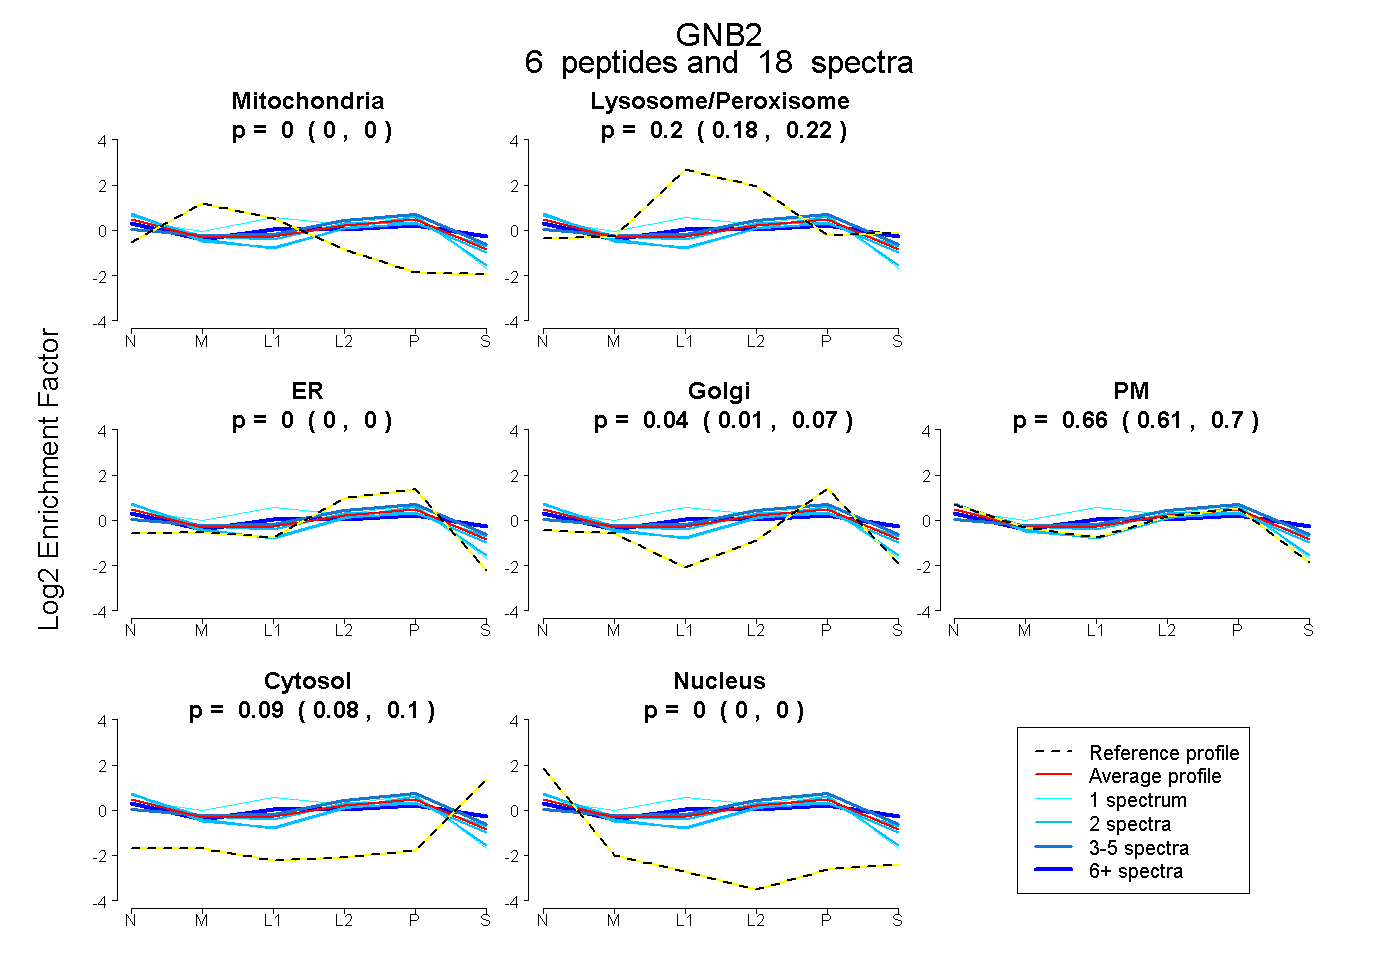
0.000 | 0.000
0.183 | 0.223
0.000 | 0.000
0.011 | 0.073
0.614 | 0.699
0.075 | 0.102
0.000 | 0.000
9peptides
spectra
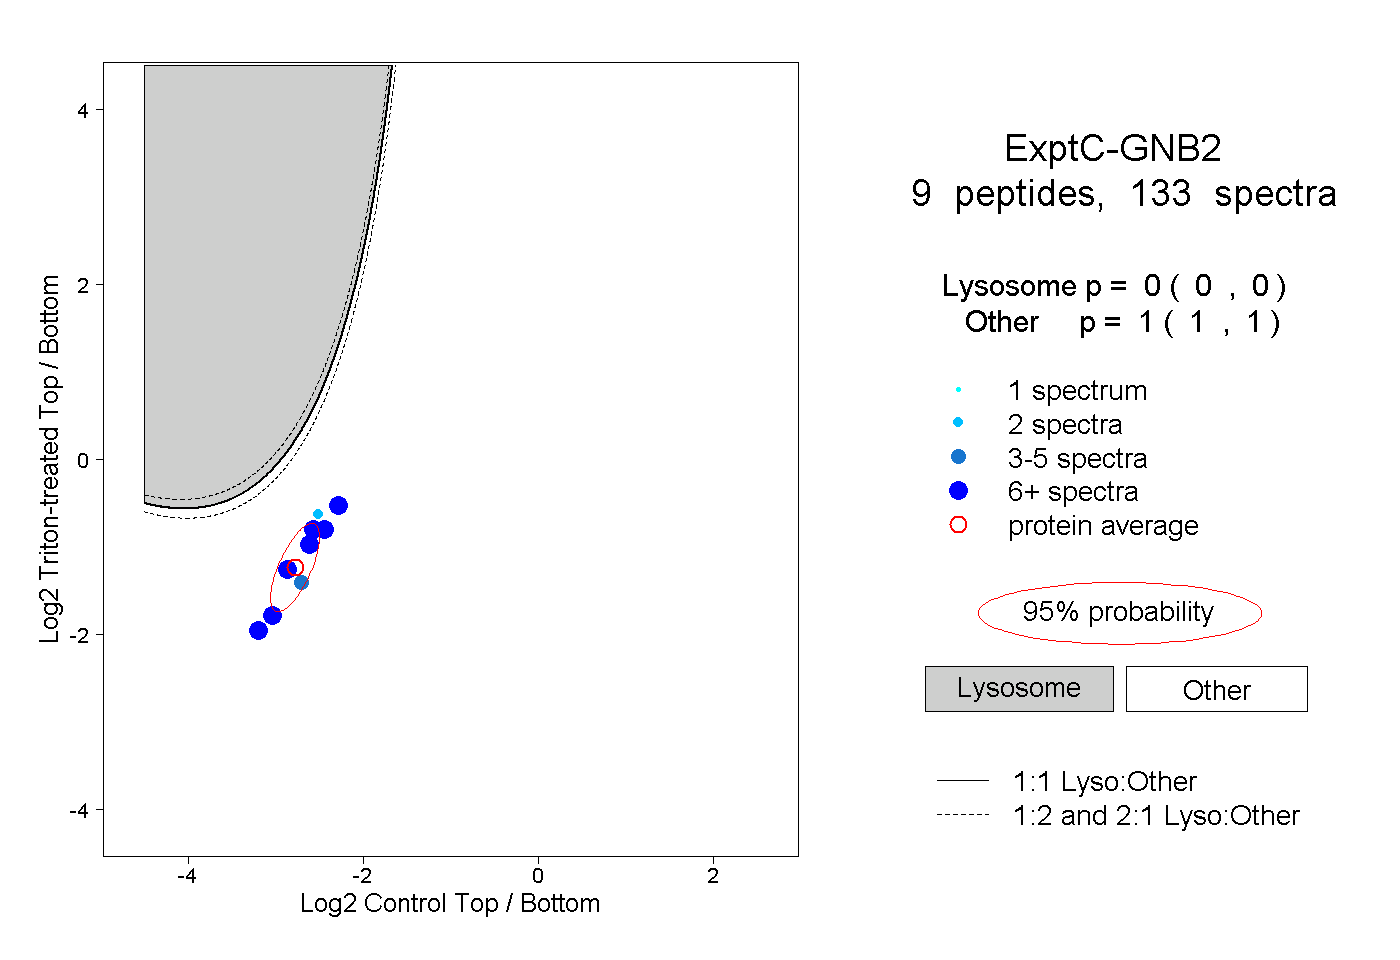
0.000 | 0.000
1.000 | 1.000