 12
12peptides
spectra
0.000 | 0.000
0.000 | 0.000
0.092 | 0.101
0.119 | 0.156
0.000 | 0.010
0.625 | 0.663
0.112 | 0.119
0.000 | 0.000
| Plot | Mito | Lyso | Perox | ER | Golgi | PM | Cytosol | Nucleus | |||||
| Expt A |
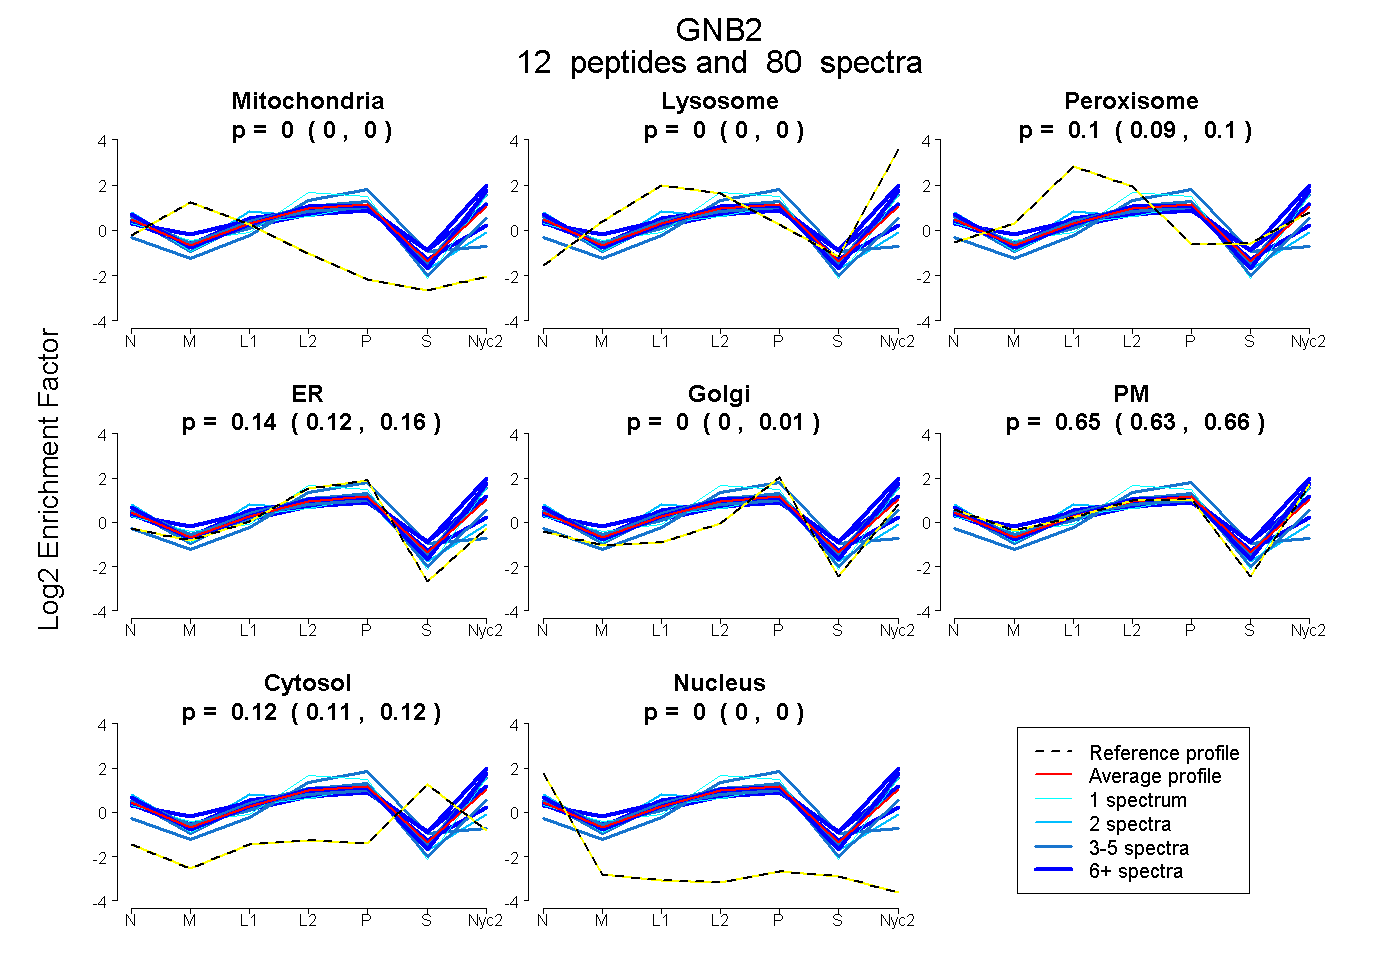
12 peptides |
80 spectra |
|
0.000 0.000 | 0.000 |
0.000 0.000 | 0.000 |
0.096 0.092 | 0.101 |
0.141 0.119 | 0.156 |
0.000 0.000 | 0.010 |
0.647 0.625 | 0.663 |
0.116 0.112 | 0.119 |
0.000 0.000 | 0.000 |
| 27 spectra, AGVLAGHDNR | 0.000 | 0.000 | 0.117 | 0.000 | 0.000 | 0.690 | 0.193 | 0.000 | ||
| 10 spectra, IYAMHWGTDSR | 0.000 | 0.224 | 0.013 | 0.000 | 0.000 | 0.632 | 0.131 | 0.000 | ||
| 5 spectra, QEAEQLR | 0.000 | 0.048 | 0.029 | 0.000 | 0.000 | 0.820 | 0.104 | 0.000 | ||
| 2 spectra, ADQELLMYSHDNIICGITSVAFSR | 0.000 | 0.000 | 0.246 | 0.367 | 0.000 | 0.267 | 0.000 | 0.120 | ||
| 3 spectra, TFVSGACDASIK | 0.000 | 0.000 | 0.102 | 0.361 | 0.000 | 0.487 | 0.011 | 0.039 | ||
| 3 spectra, ACGDSTLTQITAGLDPVGR | 0.000 | 0.000 | 0.080 | 0.141 | 0.000 | 0.679 | 0.101 | 0.000 | ||
| 7 spectra, ELPGHTGYLSCCR | 0.039 | 0.000 | 0.198 | 0.336 | 0.000 | 0.319 | 0.108 | 0.000 | ||
| 12 spectra, VHAIPLR | 0.000 | 0.035 | 0.015 | 0.000 | 0.000 | 0.884 | 0.067 | 0.000 | ||
| 5 spectra, LLVSASQDGK | 0.000 | 0.068 | 0.026 | 0.000 | 0.000 | 0.817 | 0.089 | 0.000 | ||
| 4 spectra, EEAEQLR | 0.000 | 0.000 | 0.000 | 0.781 | 0.000 | 0.000 | 0.219 | 0.000 | ||
| 1 spectrum, SELEQLR | 0.000 | 0.072 | 0.000 | 0.268 | 0.000 | 0.660 | 0.000 | 0.000 | ||
| 1 spectrum, LIIWDSYTTNK | 0.000 | 0.029 | 0.000 | 0.000 | 0.000 | 0.866 | 0.105 | 0.000 |
| Plot | Mito | Lyso or Perox | ER | Golgi | PM | Cytosol | Nucleus | ||||||
| Expt B |
6 peptides |
18 spectra |
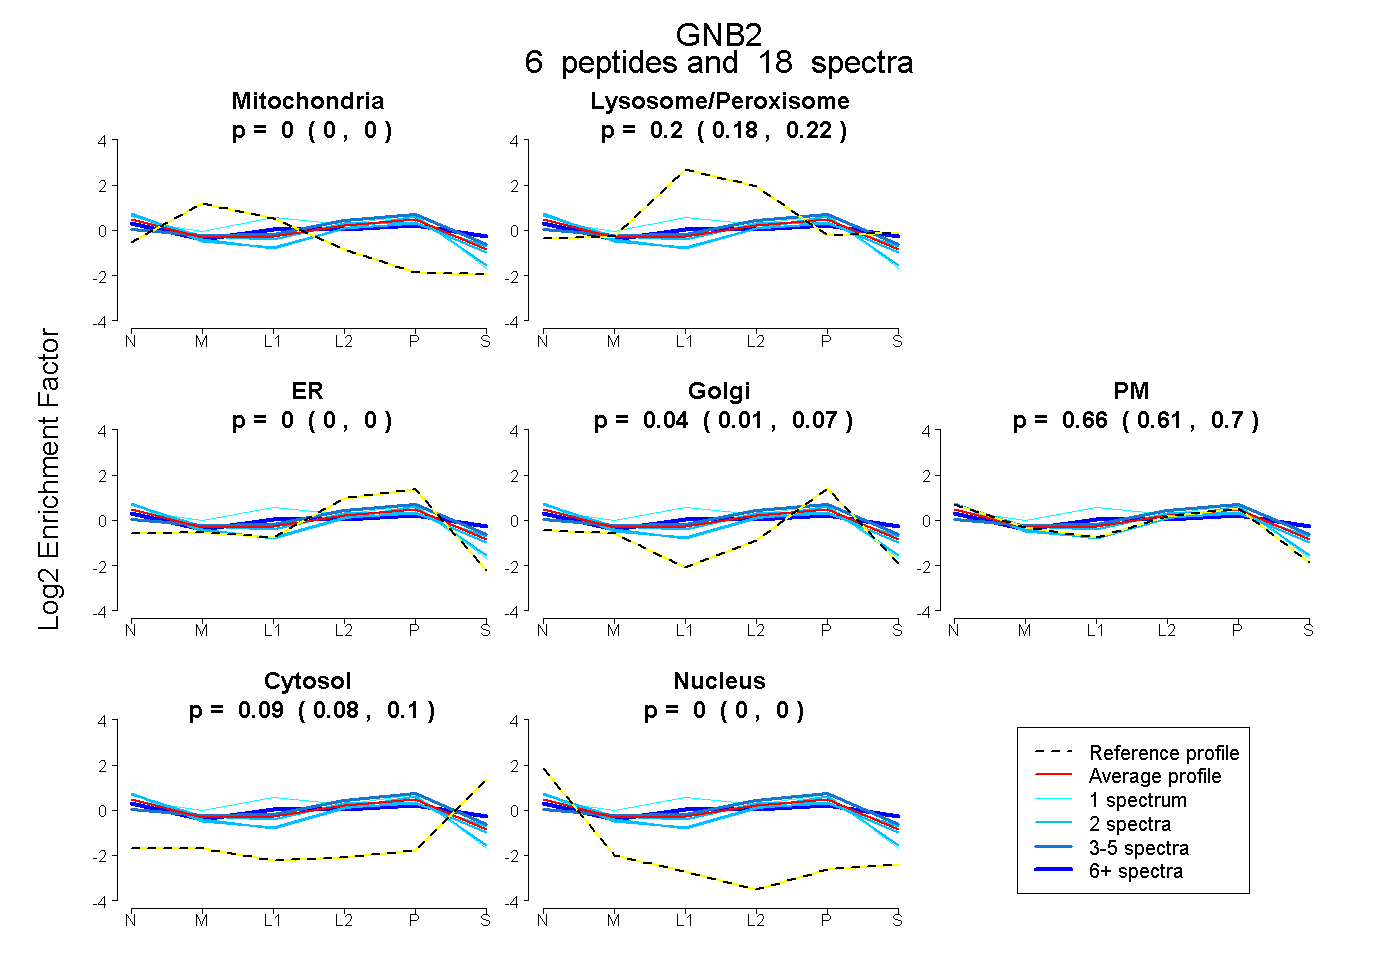 |
0.000 0.000 | 0.000 |
0.204 0.183 | 0.223 |
0.000 0.000 | 0.000 |
0.044 0.011 | 0.073 |
0.662 0.614 | 0.699 |
0.090 0.075 | 0.102 |
0.000 0.000 | 0.000 |
|||
| Plot | Lyso | Other | |||||||||||
| Expt C |
9 peptides |
133 spectra |
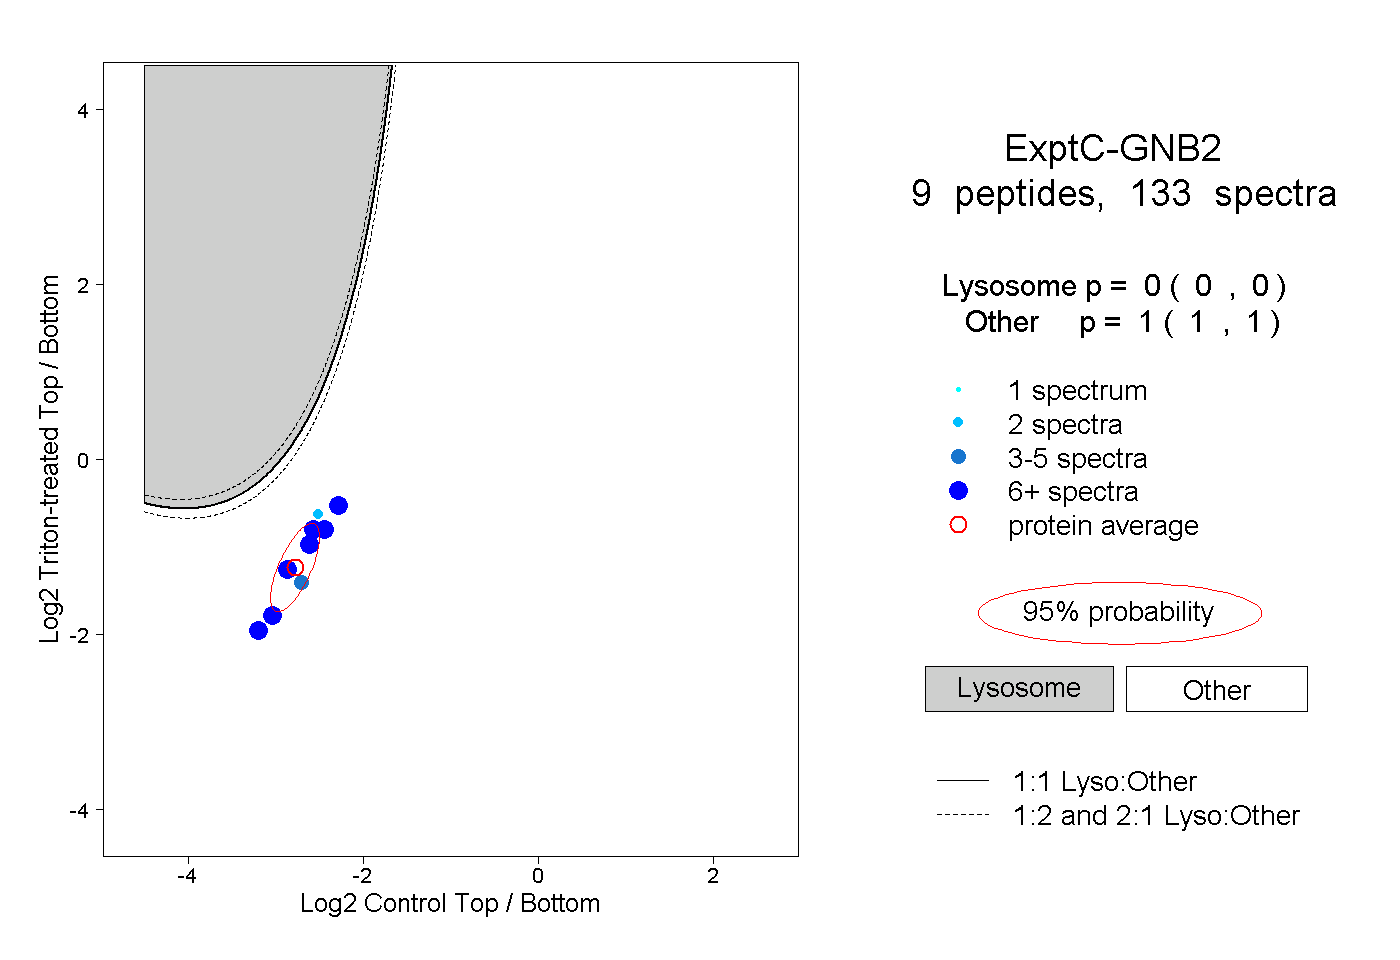 |
0.000 0.000 | 0.000 |
1.000 1.000 | 1.000 |