GNB2
[ENSRNOP00000001911]
Main page
| | | Plot |
Mito |
Lyso |
|
Perox |
ER |
Golgi |
PM |
Cytosol |
Nucleus |
|
| Expt A |
 12
12
peptides |
80
spectra |
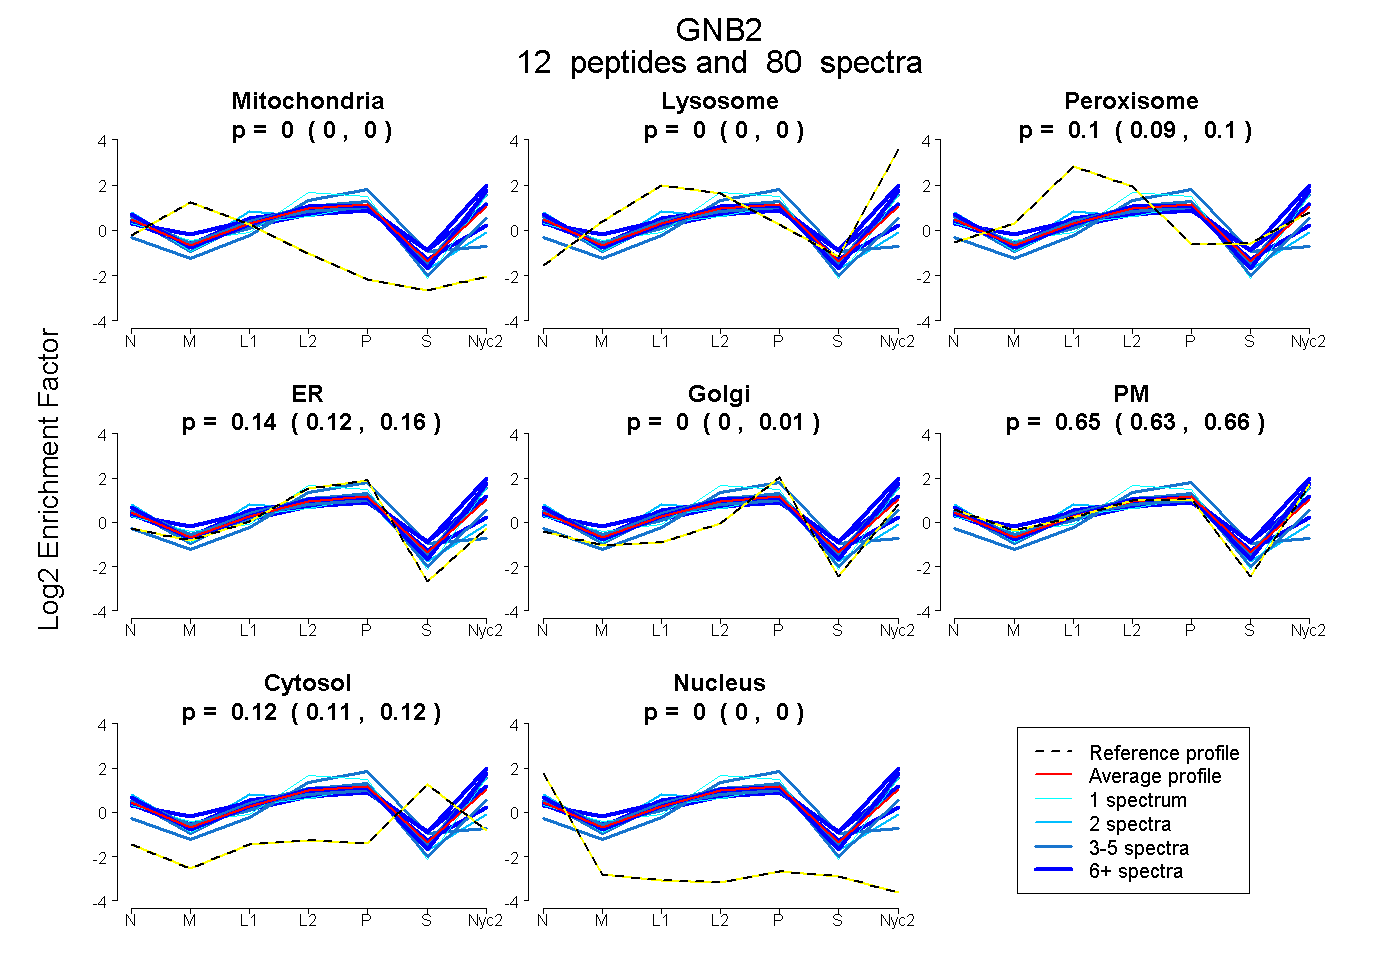 |
0.000
0.000 | 0.000 |
0.000
0.000 | 0.000 |
|
0.096
0.092 | 0.101 |
0.141
0.119 | 0.156 |
0.000
0.000 | 0.010 |
0.647
0.625 | 0.663 |
0.116
0.112 | 0.119 |
0.000
0.000 | 0.000 |
|
| | | Plot |
Mito |
|
Lyso or Perox |
|
ER |
Golgi |
PM |
Cytosol |
Nucleus |
|
| Expt B |
6
peptides |
18
spectra |
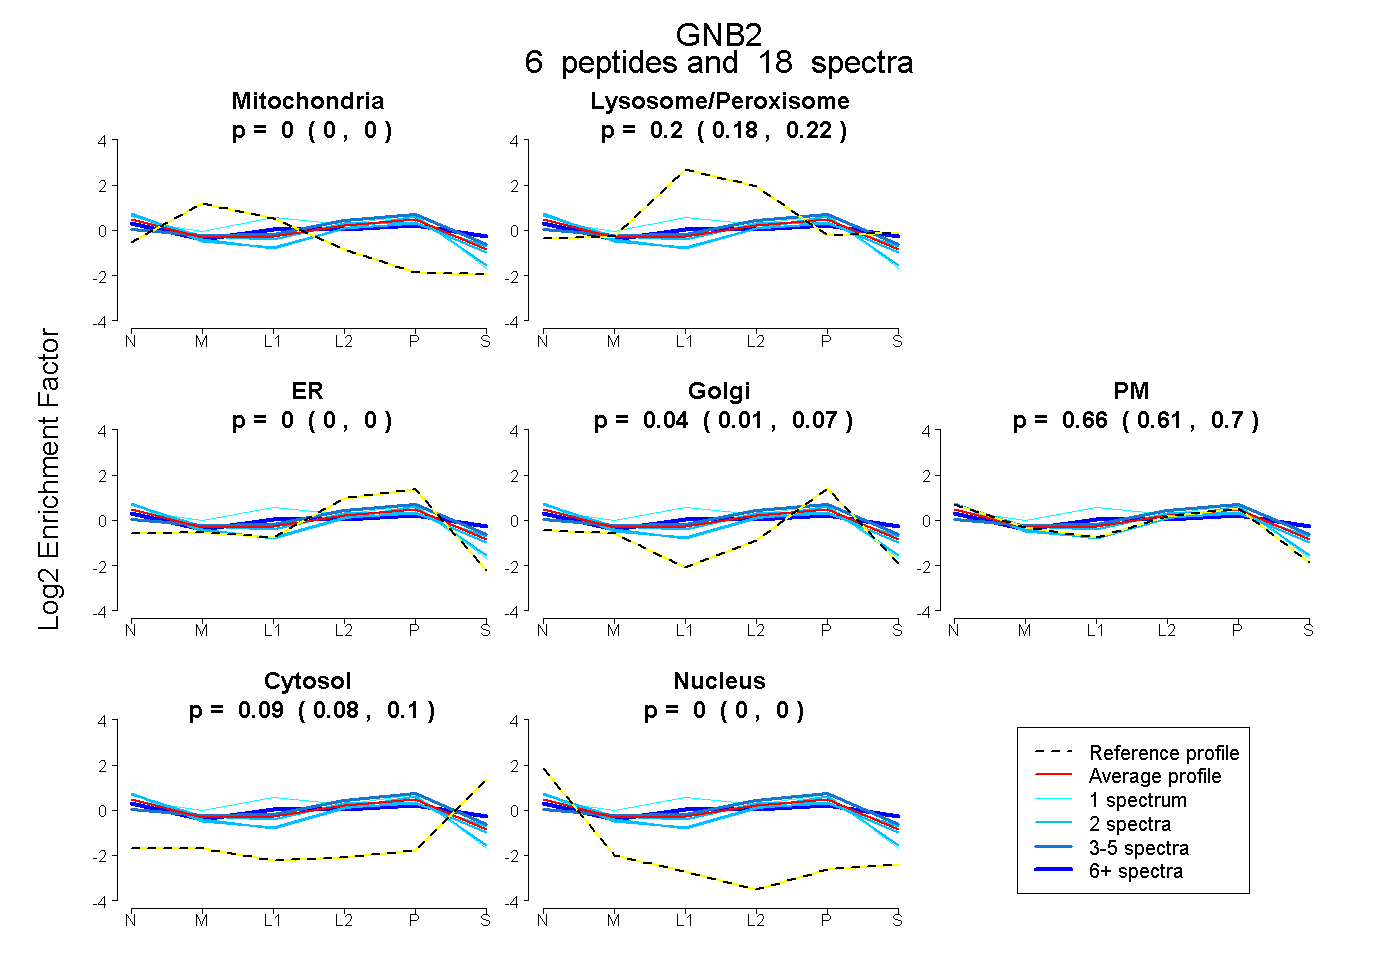 |
0.000
0.000 | 0.000 |
|
0.204
0.183 | 0.223 |
|
0.000
0.000 | 0.000 |
0.044
0.011 | 0.073 |
0.662
0.614 | 0.699 |
0.090
0.075 | 0.102 |
0.000
0.000 | 0.000 |
|
| 2 spectra, TFVSGACDASIK |
0.000 |
|
0.165 |
|
0.000 |
0.000 |
0.762 |
0.073 |
0.000 |
|
| 7 spectra, AGVLAGHDNR |
0.000 |
|
0.293 |
|
0.000 |
0.000 |
0.517 |
0.190 |
0.000 |
|
| 4 spectra, VHAIPLR |
0.000 |
|
0.363 |
|
0.000 |
0.348 |
0.241 |
0.048 |
0.000 |
|
| 2 spectra, LLVSASQDGK |
0.000 |
|
0.016 |
|
0.000 |
0.013 |
0.942 |
0.029 |
0.000 |
|
| 1 spectrum, QEAEQLR |
0.054 |
|
0.251 |
|
0.045 |
0.007 |
0.643 |
0.000 |
0.000 |
|
| 2 spectra, LIIWDSYTTNK |
0.000 |
|
0.098 |
|
0.000 |
0.000 |
0.757 |
0.145 |
0.000 |
|
| | | Plot |
|
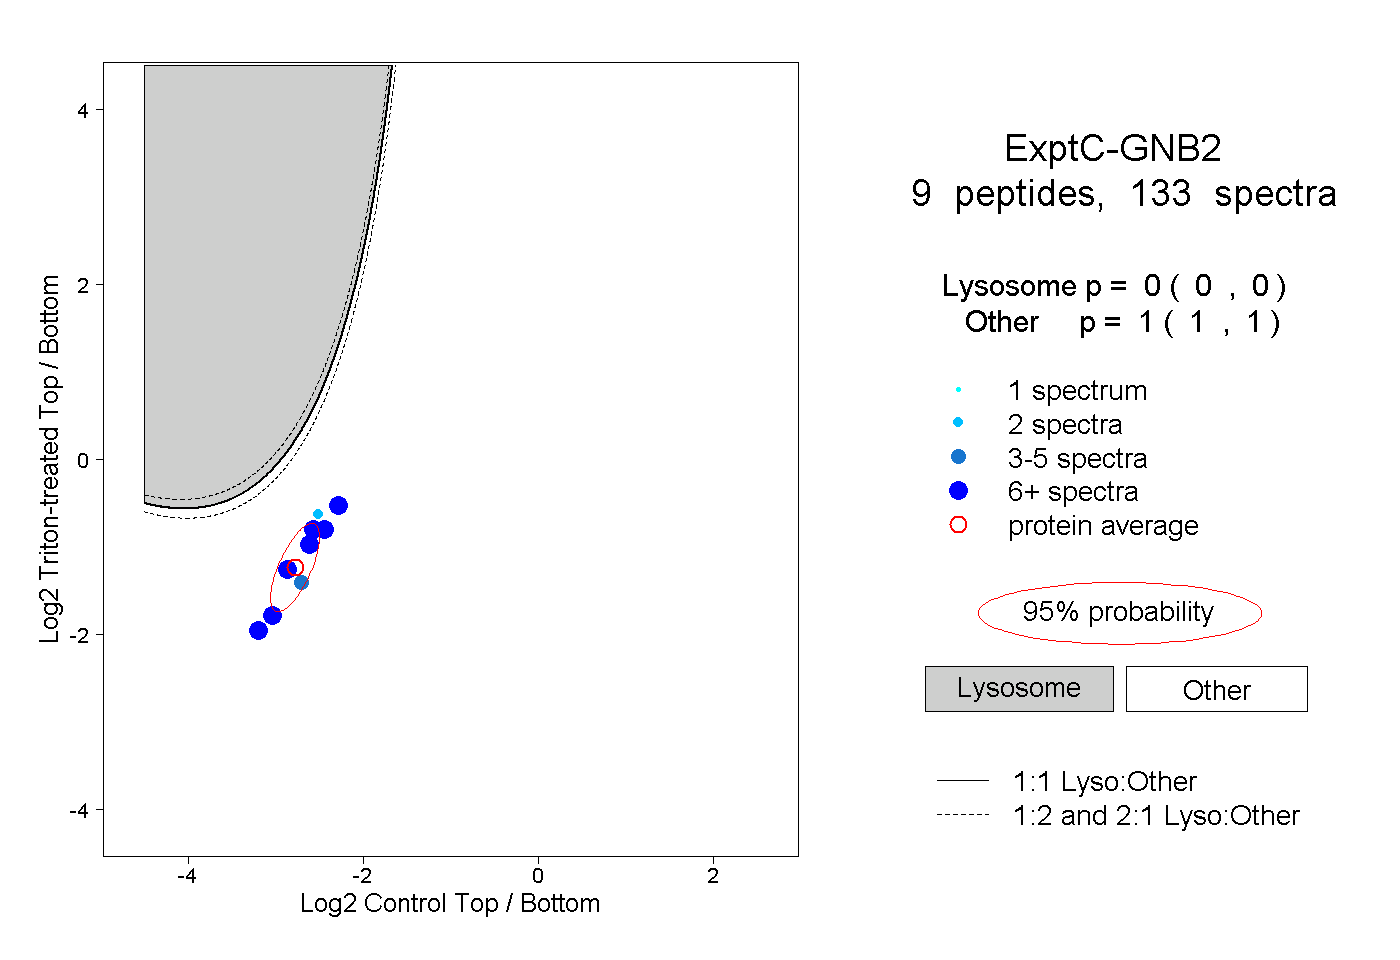
Lyso |
|
|
|
|
|
|
|
Other |
| Expt C |
9
peptides |
133
spectra |
 |
|
0.000
0.000 | 0.000 |
|
|
|
|
|
|
|
1.000
1.000 | 1.000 |