 6
6peptides
spectra
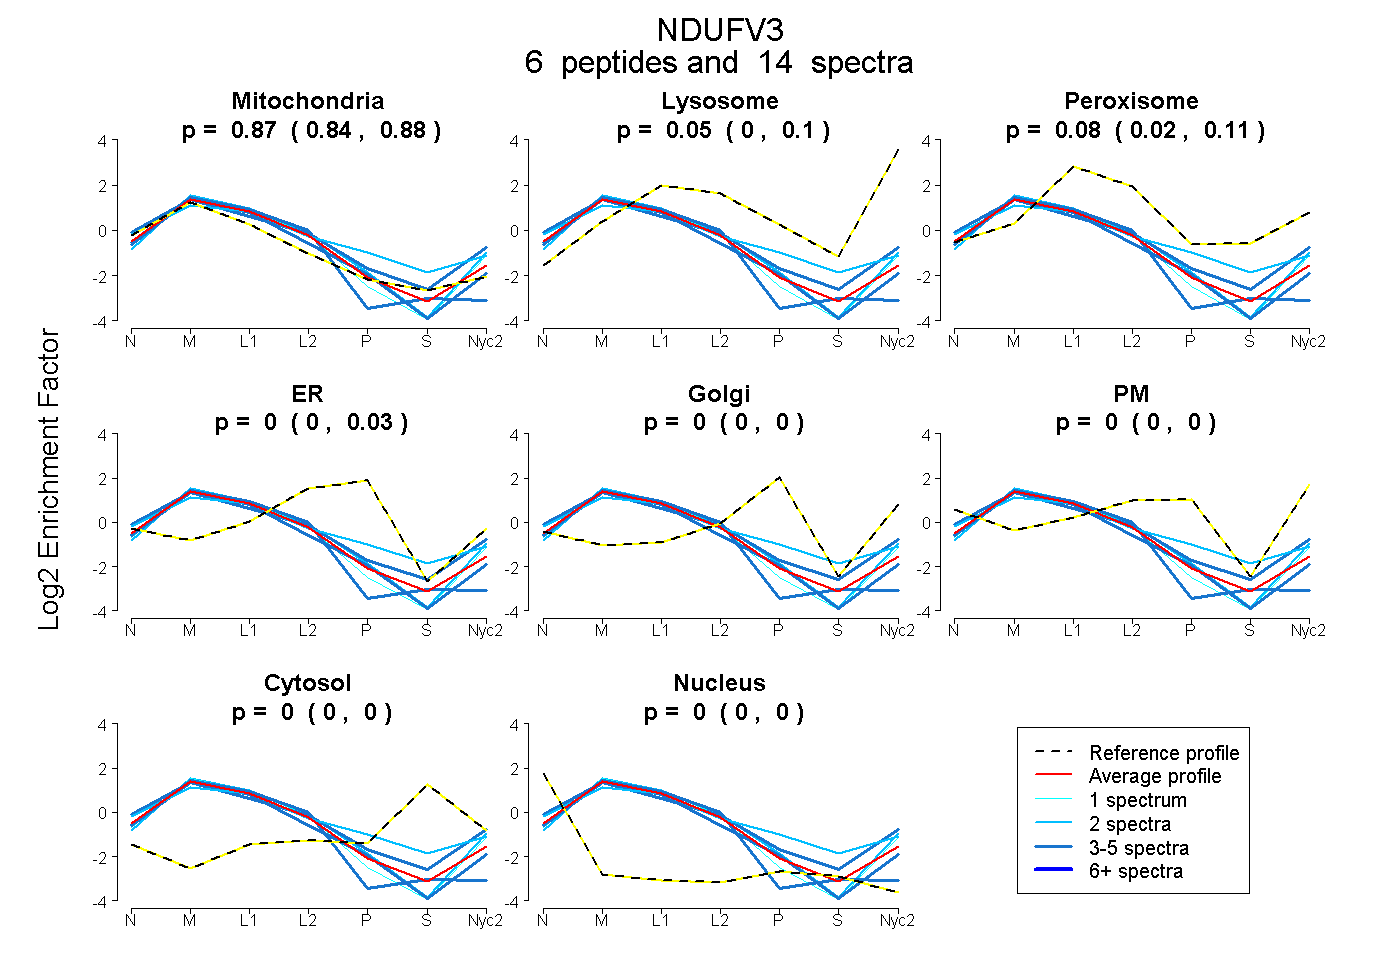
0.842 | 0.882
0.005 | 0.100
0.025 | 0.115
0.000 | 0.025
0.000 | 0.000
0.000 | 0.000
0.000 | 0.000
0.000 | 0.000
6peptides
spectra
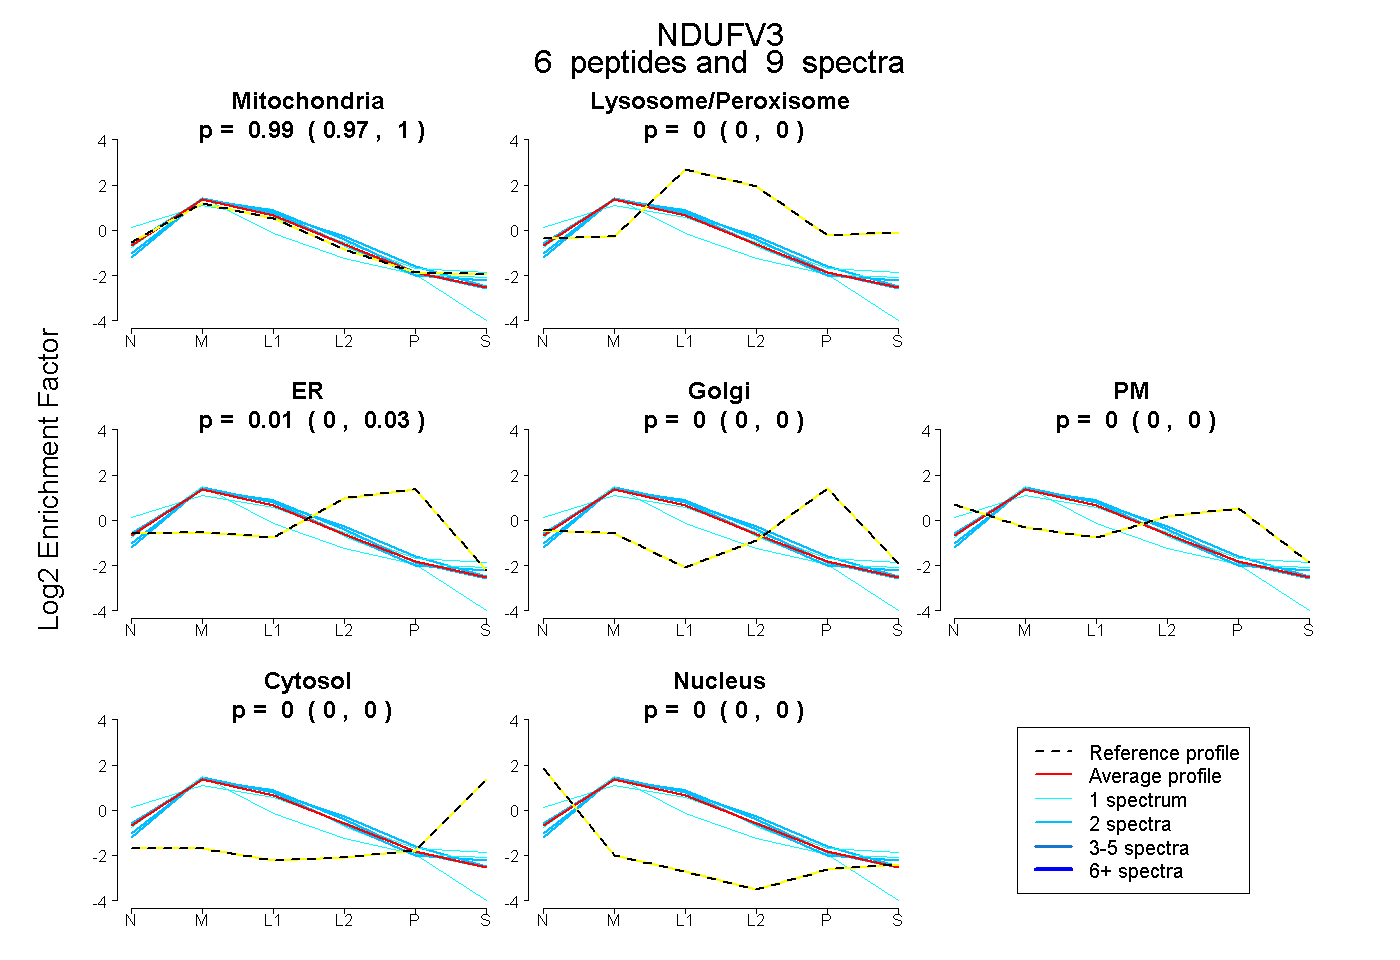
0.972 | 0.999
0.000 | 0.000
0.000 | 0.026
0.000 | 0.000
0.000 | 0.000
0.000 | 0.000
0.000 | 0.000
16peptides
spectra
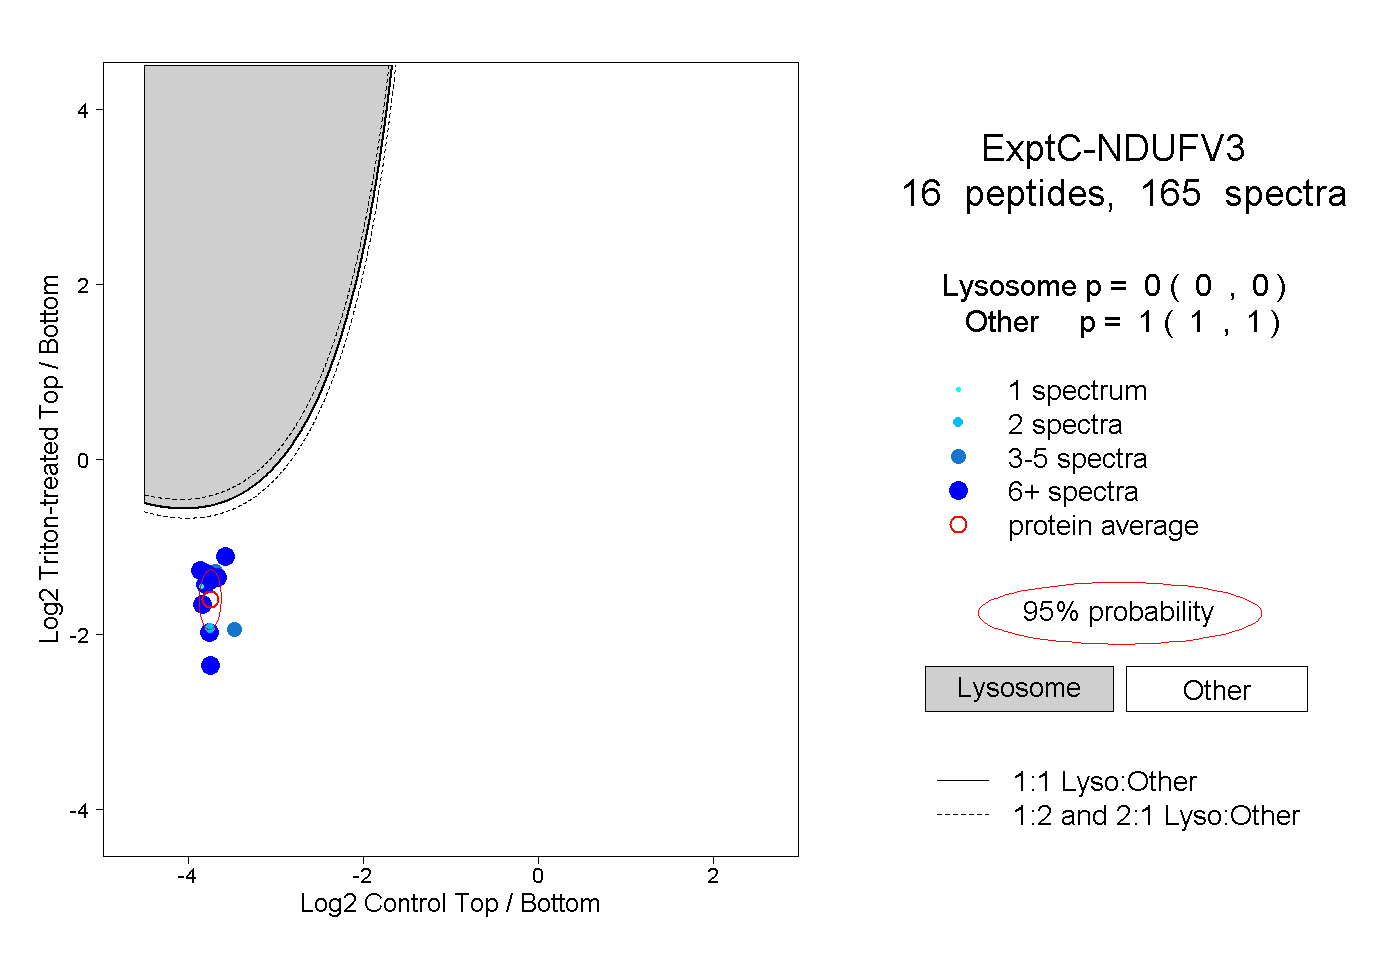
0.000 | 0.000
1.000 | 1.000
6peptides
spectra
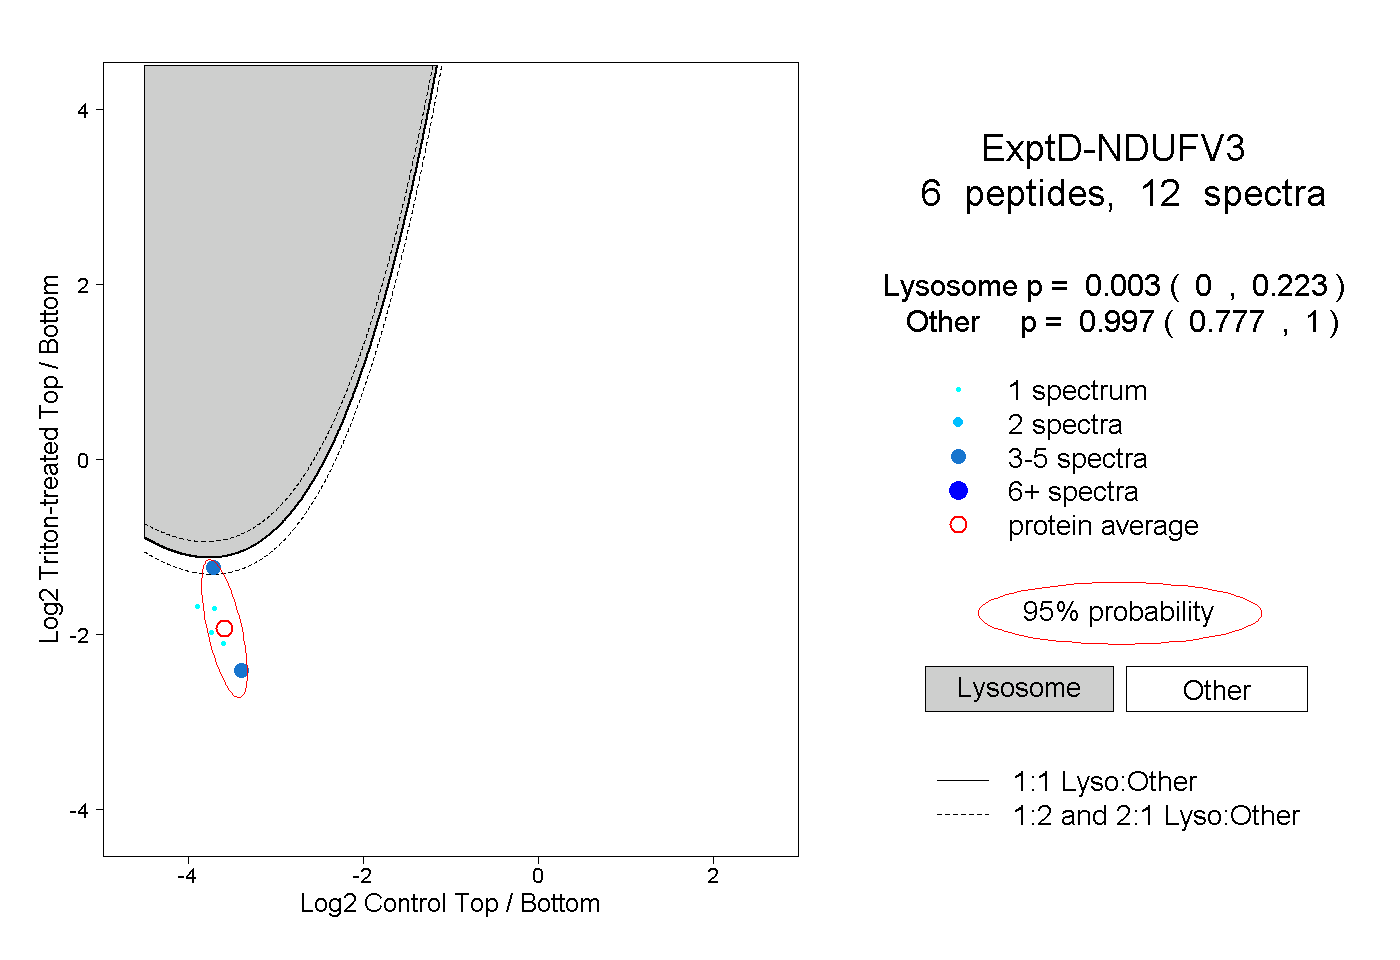
0.000 | 0.223
0.777 | 1.000