NDUFV3
[ENSRNOP00000001564]
Main page
| | | Plot |
Mito |
Lyso |
|
Perox |
ER |
Golgi |
PM |
Cytosol |
Nucleus |
|
| Expt A |
 6
6
peptides |
14
spectra |
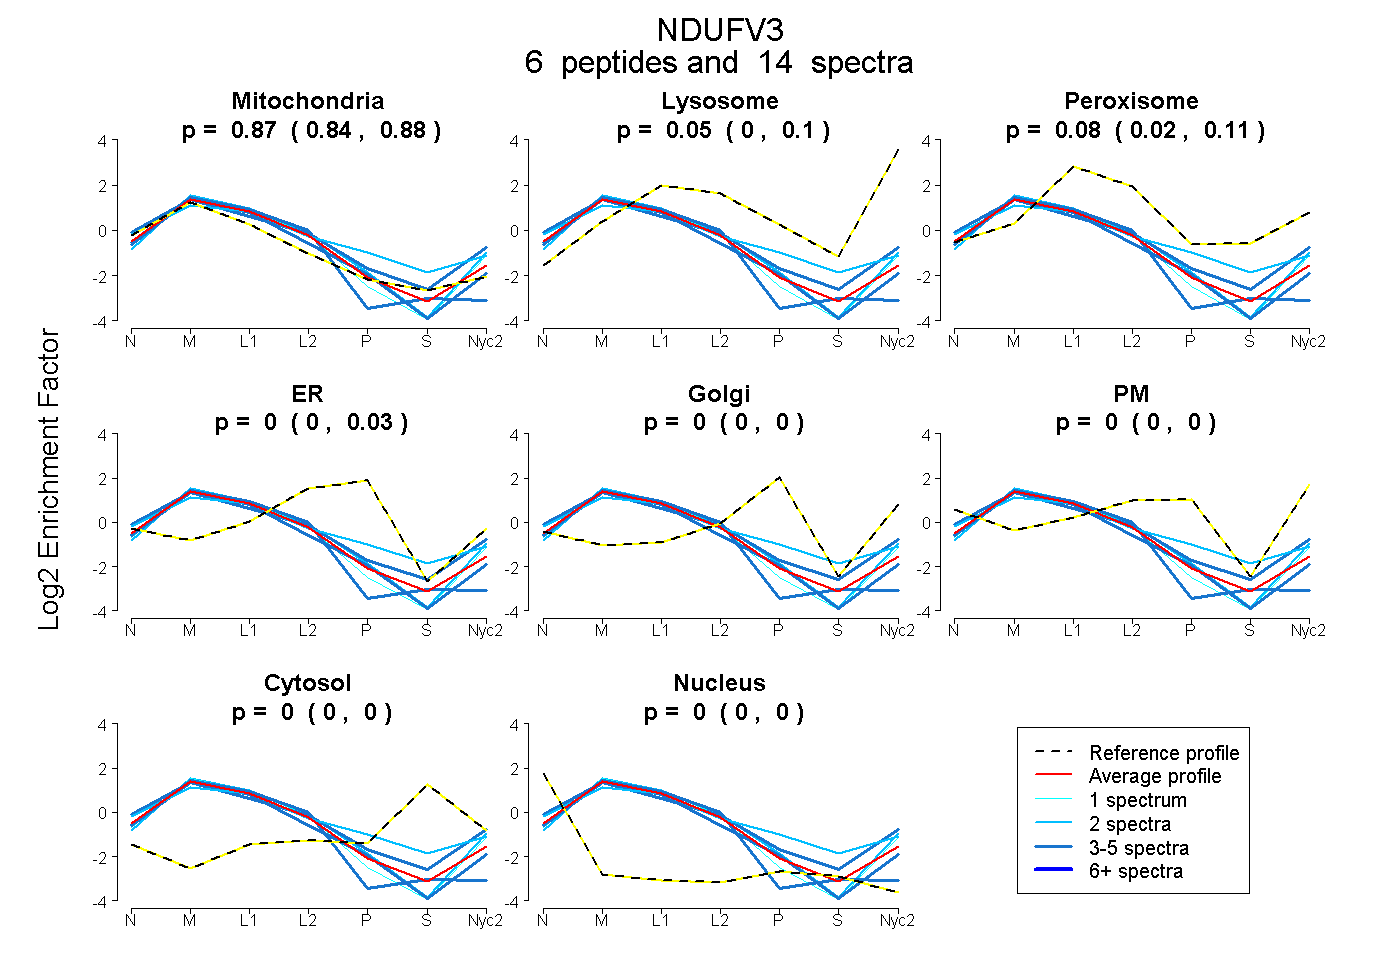 |
0.867
0.842 | 0.882 |
0.055
0.005 | 0.100 |
|
0.078
0.025 | 0.115 |
0.000
0.000 | 0.025 |
0.000
0.000 | 0.000 |
0.000
0.000 | 0.000 |
0.000
0.000 | 0.000 |
0.000
0.000 | 0.000 |
|
| | | Plot |
Mito |
|
Lyso or Perox |
|
ER |
Golgi |
PM |
Cytosol |
Nucleus |
|
| Expt B |
6
peptides |
9
spectra |
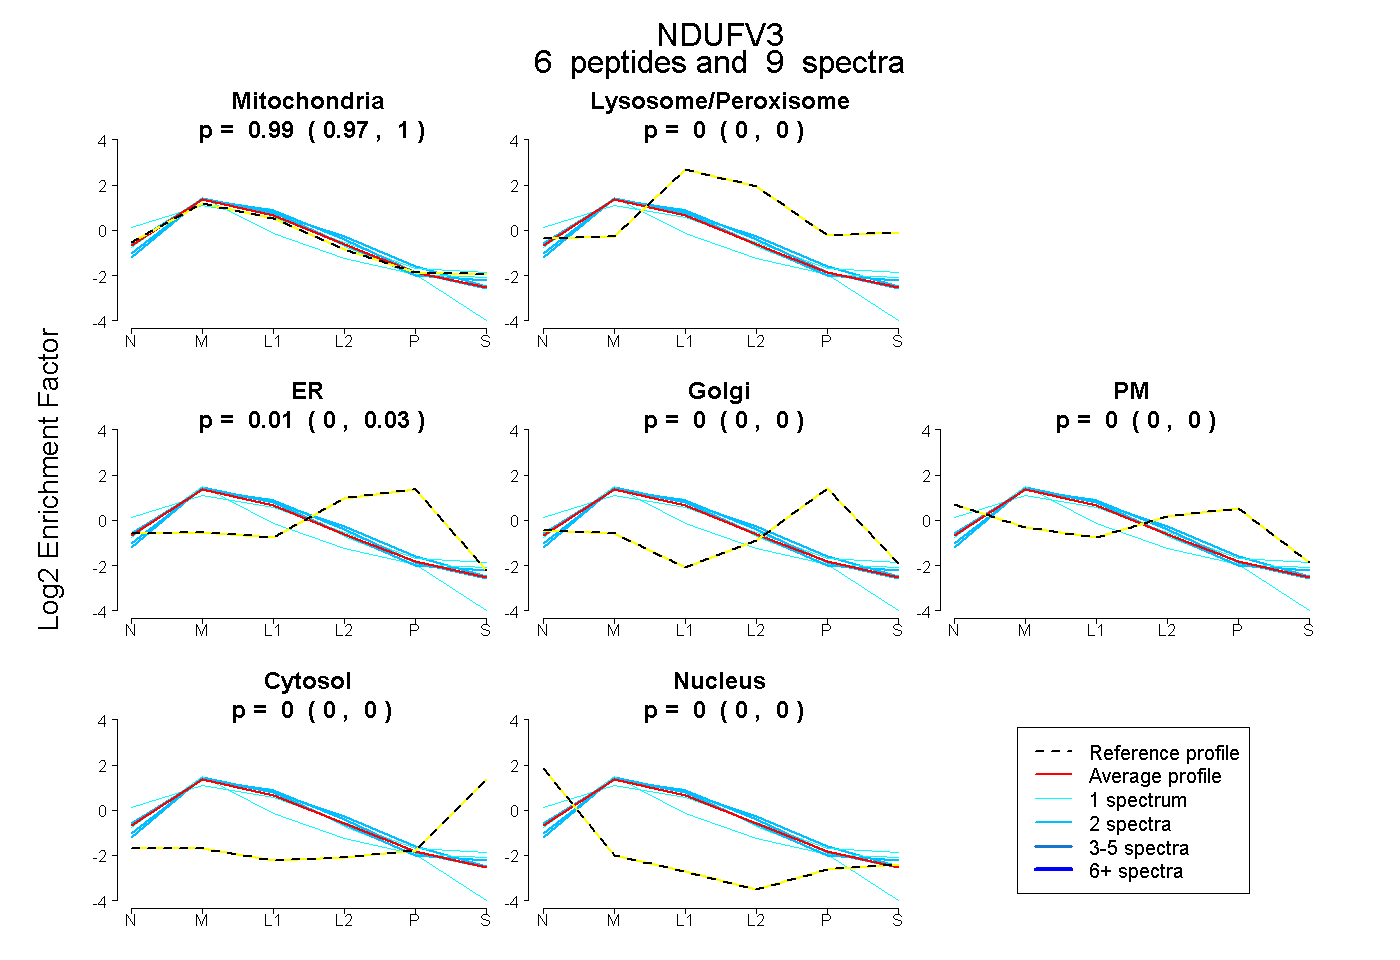 |
0.986
0.972 | 0.999 |
|
0.000
0.000 | 0.000 |
|
0.014
0.000 | 0.026 |
0.000
0.000 | 0.000 |
0.000
0.000 | 0.000 |
0.000
0.000 | 0.000 |
0.000
0.000 | 0.000 |
|
| 1 spectrum, LPQPSSGR |
0.921 |
|
0.000 |
|
0.000 |
0.000 |
0.000 |
0.000 |
0.079 |
|
| 2 spectra, TVPVEEK |
0.969 |
|
0.031 |
|
0.000 |
0.000 |
0.000 |
0.000 |
0.000 |
|
| 2 spectra, TASPLVR |
1.000 |
|
0.000 |
|
0.000 |
0.000 |
0.000 |
0.000 |
0.000 |
|
| 1 spectrum, ITVFAK |
0.973 |
|
0.027 |
|
0.000 |
0.000 |
0.000 |
0.000 |
0.000 |
|
| 1 spectrum, GPELEWK |
0.819 |
|
0.066 |
|
0.000 |
0.000 |
0.088 |
0.000 |
0.027 |
|
| 2 spectra, DVVGAEER |
0.918 |
|
0.019 |
|
0.063 |
0.000 |
0.000 |
0.000 |
0.000 |
|
| | | Plot |
|
Lyso |
|
|
|
|
|
|
|
Other |
| Expt C |
16
peptides |
165
spectra |
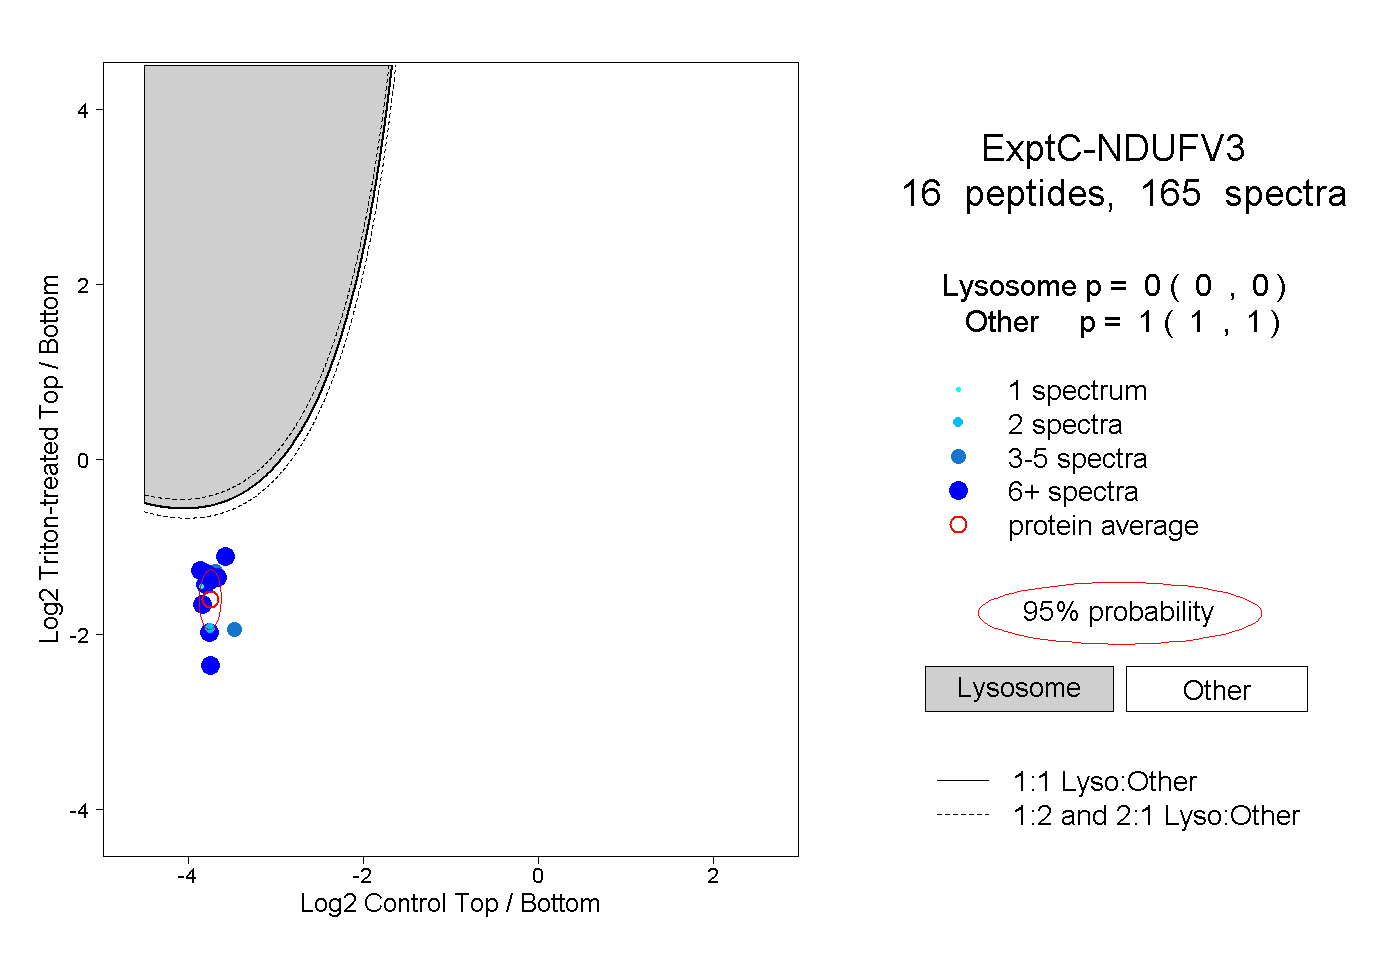 |
|
0.000
0.000 | 0.000 |
|
|
|
|
|
|
|
1.000
1.000 | 1.000 |
| | | Plot |
|
Lyso |
|
|
|
|
|
|
|
Other |
| Expt D |
6
peptides |
12
spectra |
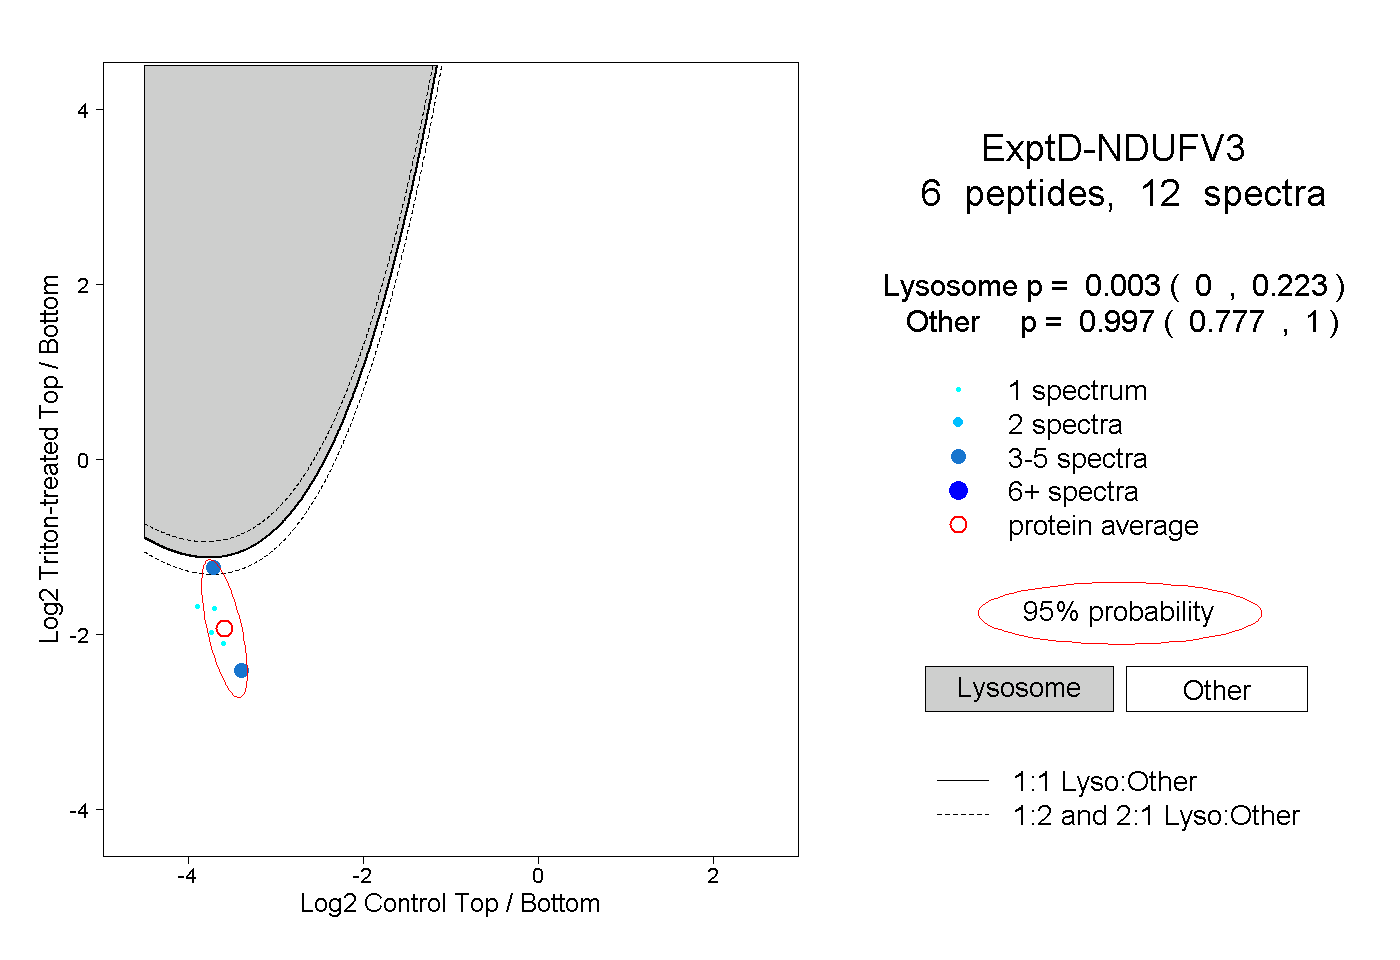 |
|
0.003
0.000 | 0.223 |
|
|
|
|
|
|
|
0.997
0.777 | 1.000 |