 6
6peptides
spectra
0.842 | 0.882
0.005 | 0.100
0.025 | 0.115
0.000 | 0.025
0.000 | 0.000
0.000 | 0.000
0.000 | 0.000
0.000 | 0.000
| Plot | Mito | Lyso | Perox | ER | Golgi | PM | Cytosol | Nucleus | |||||
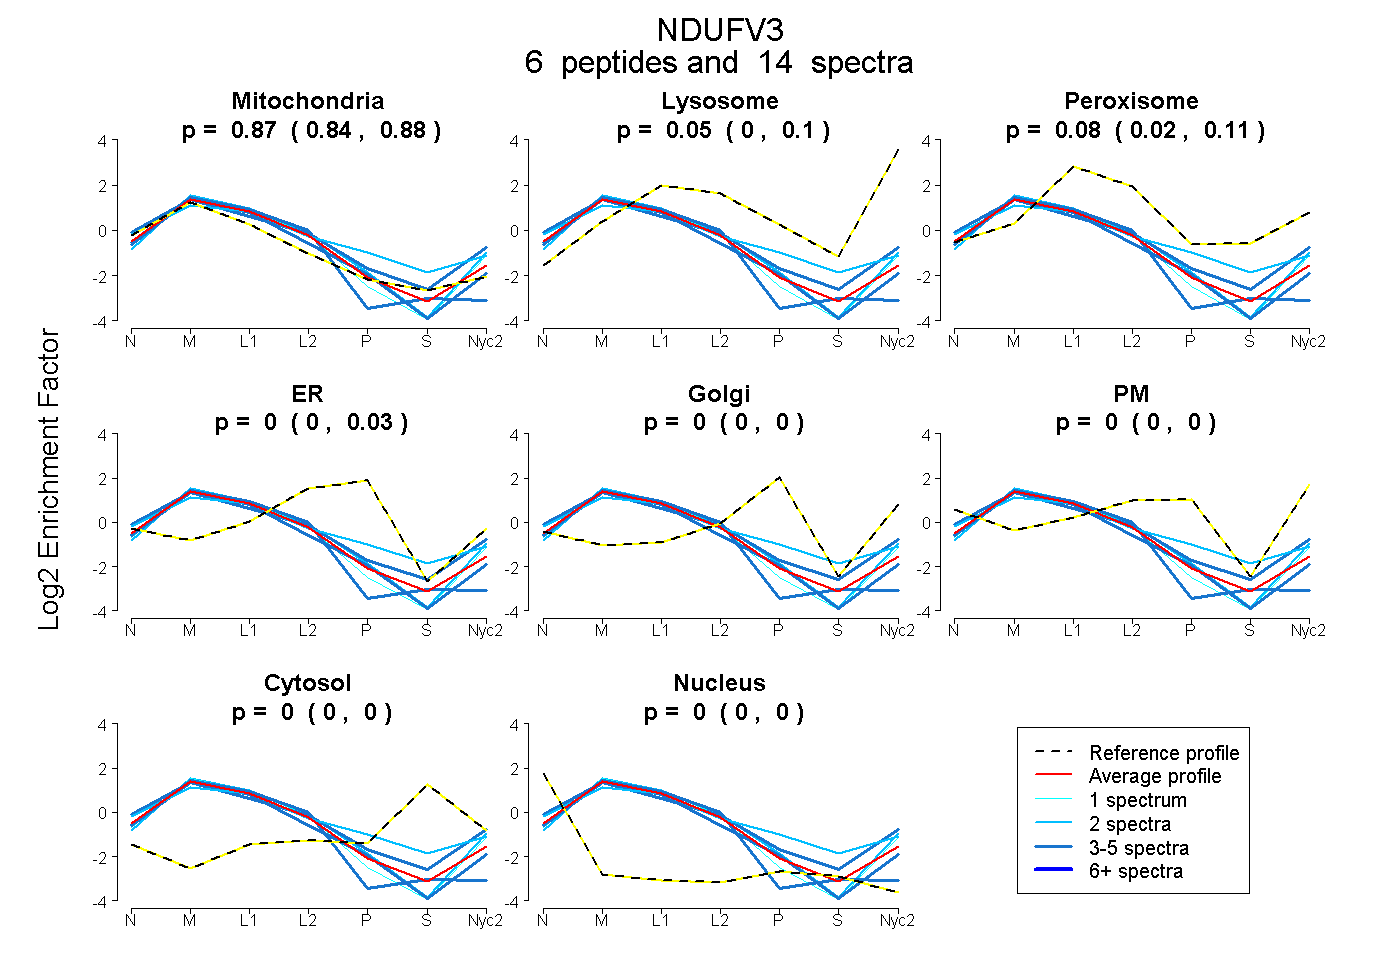
| Expt A |
6 peptides |
14 spectra |
|
0.867 0.842 | 0.882 |
0.055 0.005 | 0.100 |
0.078 0.025 | 0.115 |
0.000 0.000 | 0.025 |
0.000 0.000 | 0.000 |
0.000 0.000 | 0.000 |
0.000 0.000 | 0.000 |
0.000 0.000 | 0.000 |
| 1 spectrum, LLDTHTAAALSK | 0.883 | 0.117 | 0.000 | 0.000 | 0.000 | 0.000 | 0.000 | 0.000 | ||
| 2 spectra, VTPPPHAWASDSEAR | 0.628 | 0.000 | 0.259 | 0.000 | 0.113 | 0.000 | 0.000 | 0.000 | ||
| 3 spectra, VSTQPTTGTQEASAELRPAAAPESGAR | 1.000 | 0.000 | 0.000 | 0.000 | 0.000 | 0.000 | 0.000 | 0.000 | ||
| 3 spectra, LPQPSSGR | 0.933 | 0.000 | 0.000 | 0.064 | 0.000 | 0.003 | 0.000 | 0.000 | ||
| 3 spectra, TASPLVR | 0.774 | 0.226 | 0.000 | 0.000 | 0.000 | 0.000 | 0.000 | 0.000 | ||
| 2 spectra, DVVGAEER | 0.825 | 0.175 | 0.000 | 0.000 | 0.000 | 0.000 | 0.000 | 0.000 |
| Plot | Mito | Lyso or Perox | ER | Golgi | PM | Cytosol | Nucleus | ||||||
| Expt B |
6 peptides |
9 spectra |
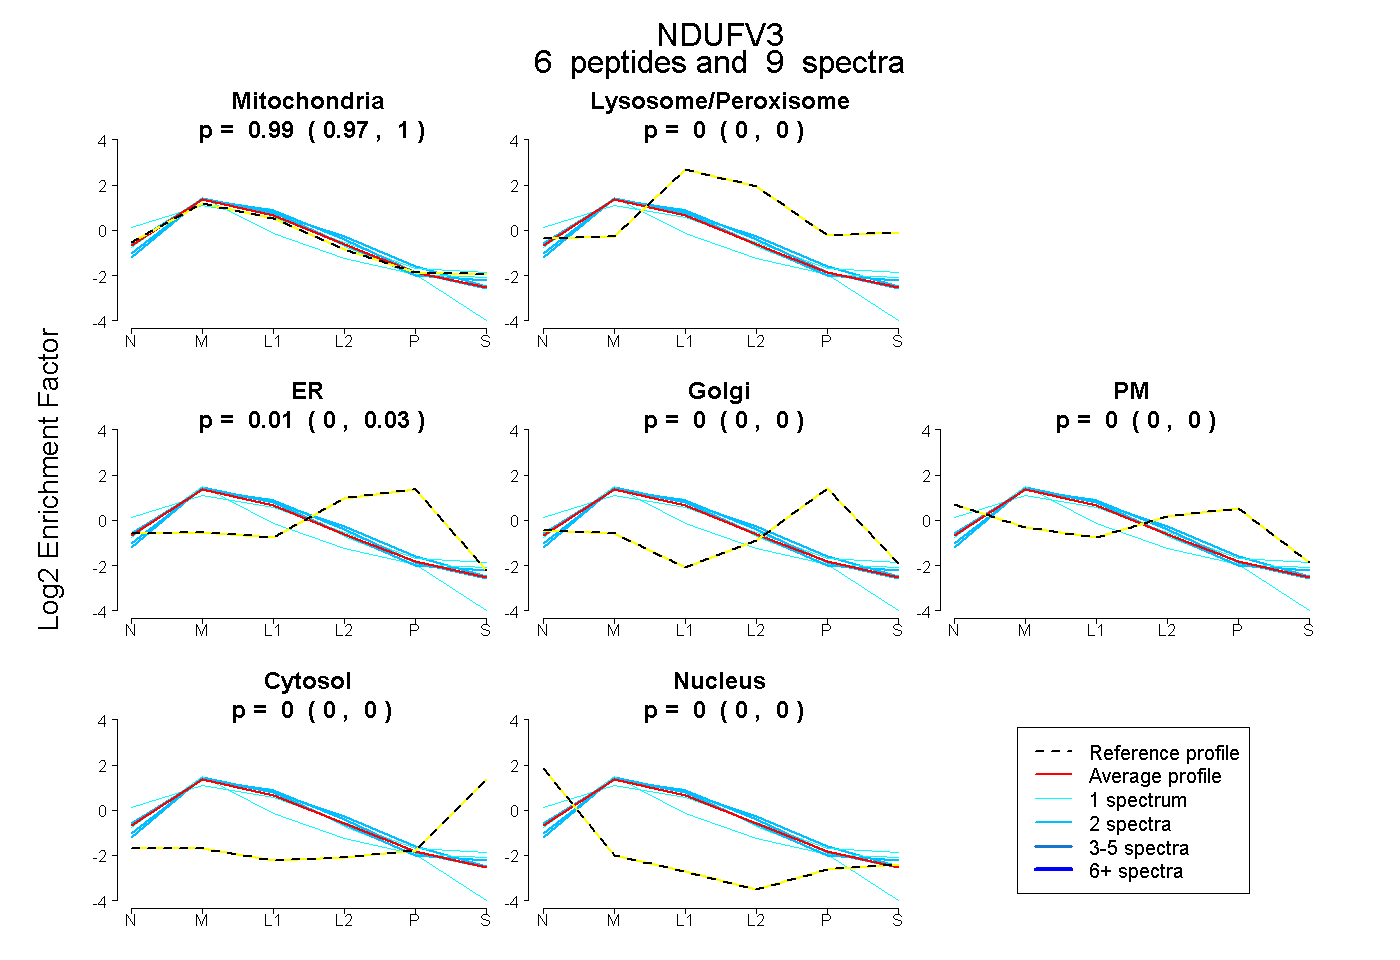 |
0.986 0.972 | 0.999 |
0.000 0.000 | 0.000 |
0.014 0.000 | 0.026 |
0.000 0.000 | 0.000 |
0.000 0.000 | 0.000 |
0.000 0.000 | 0.000 |
0.000 0.000 | 0.000 |
|||
| Plot | Lyso | Other | |||||||||||
| Expt C |
16 peptides |
165 spectra |
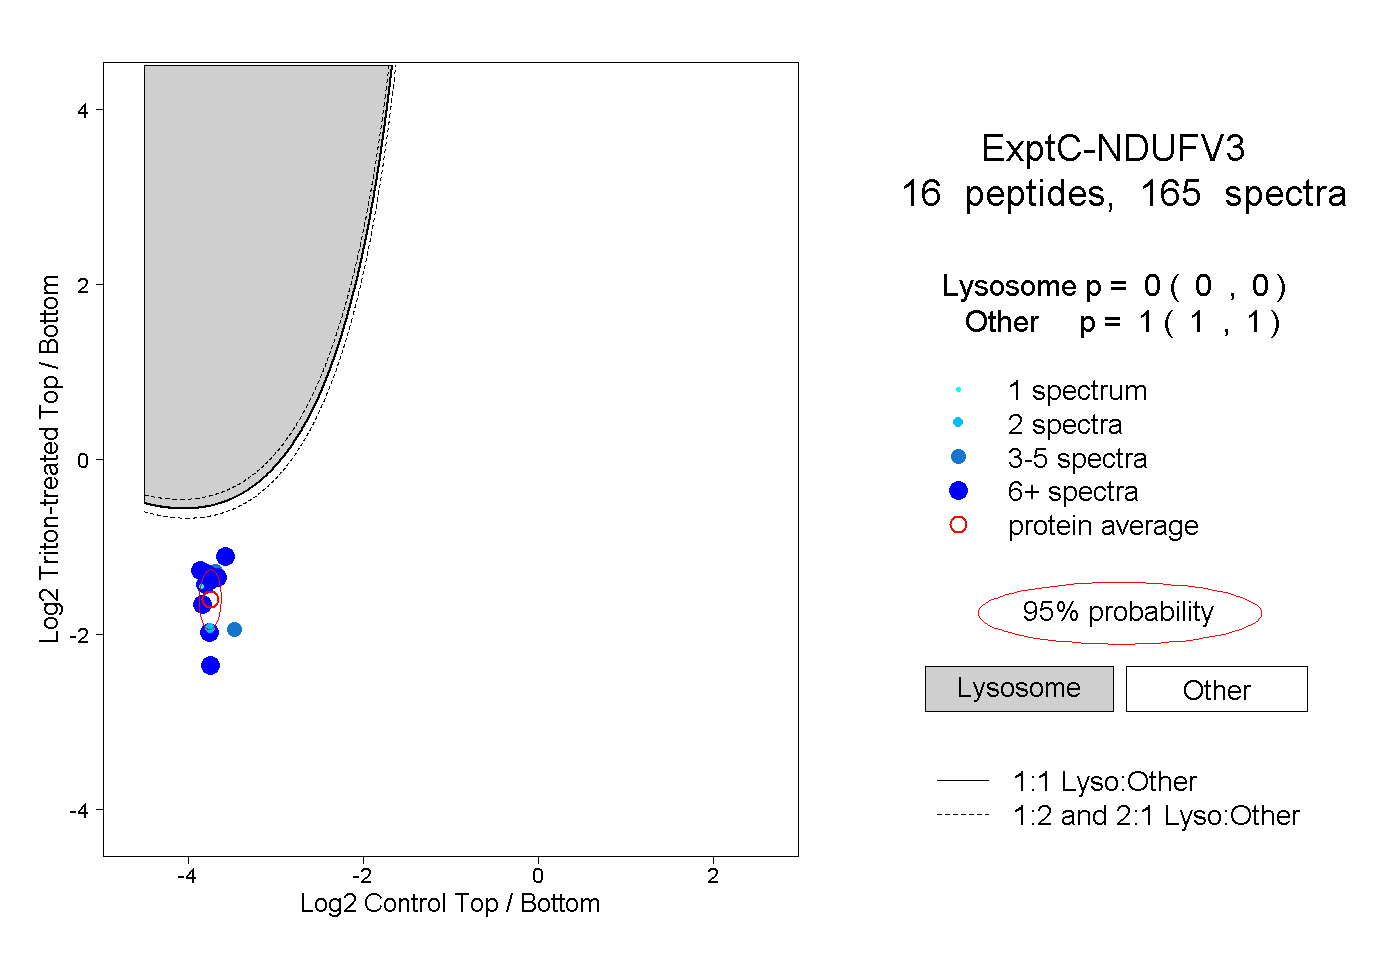 |
0.000 0.000 | 0.000 |
1.000 1.000 | 1.000 |
||||||||
| Plot | Lyso | Other | |||||||||||
| Expt D |
6 peptides |
12 spectra |
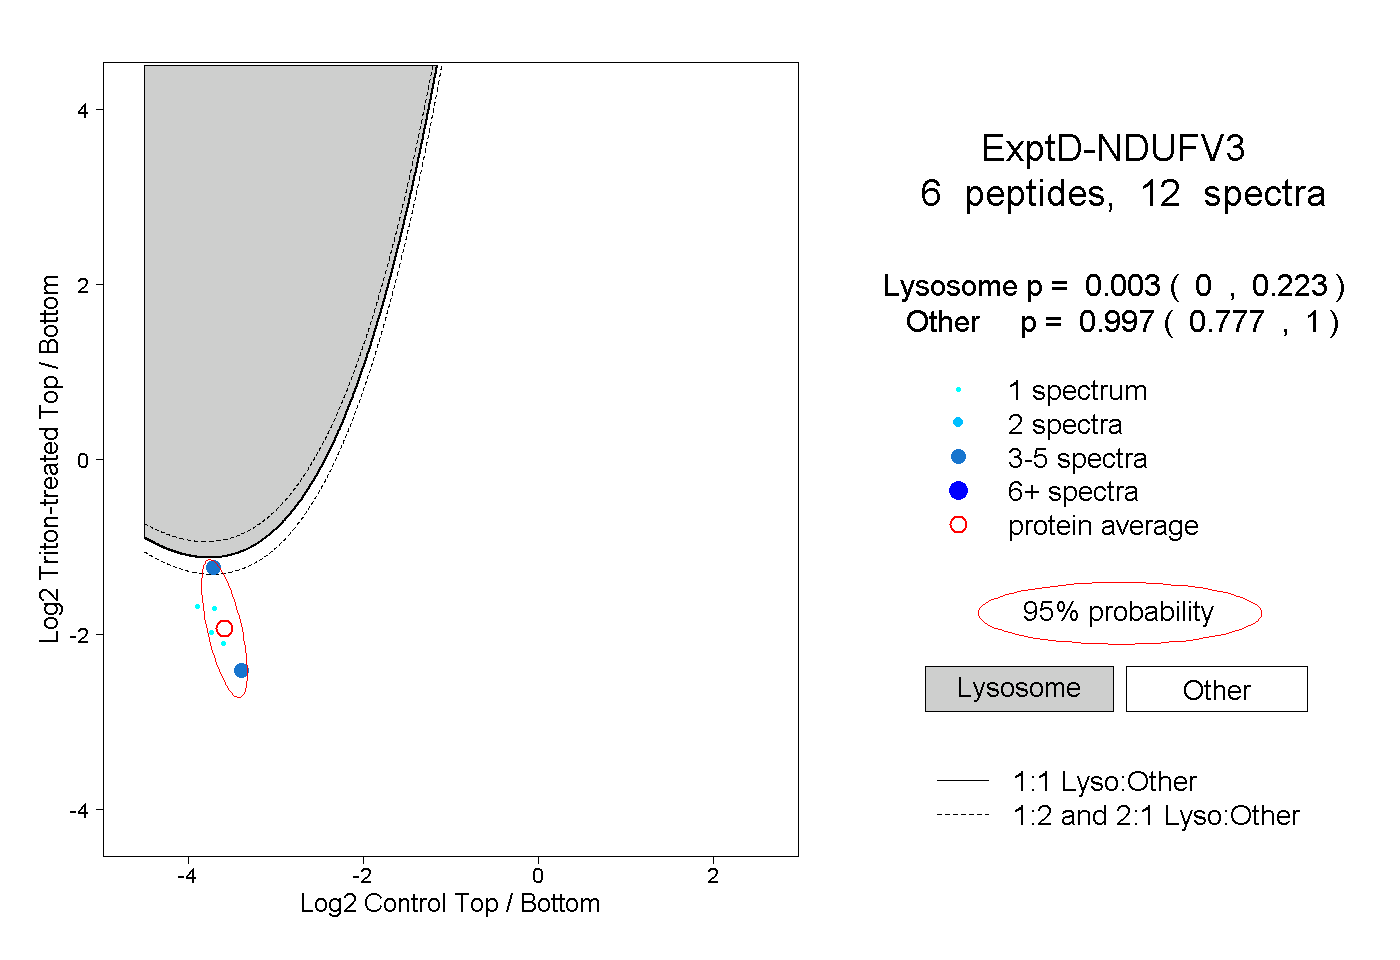 |
0.003 0.000 | 0.223 |
0.997 0.777 | 1.000 |