 11
11peptides
spectra
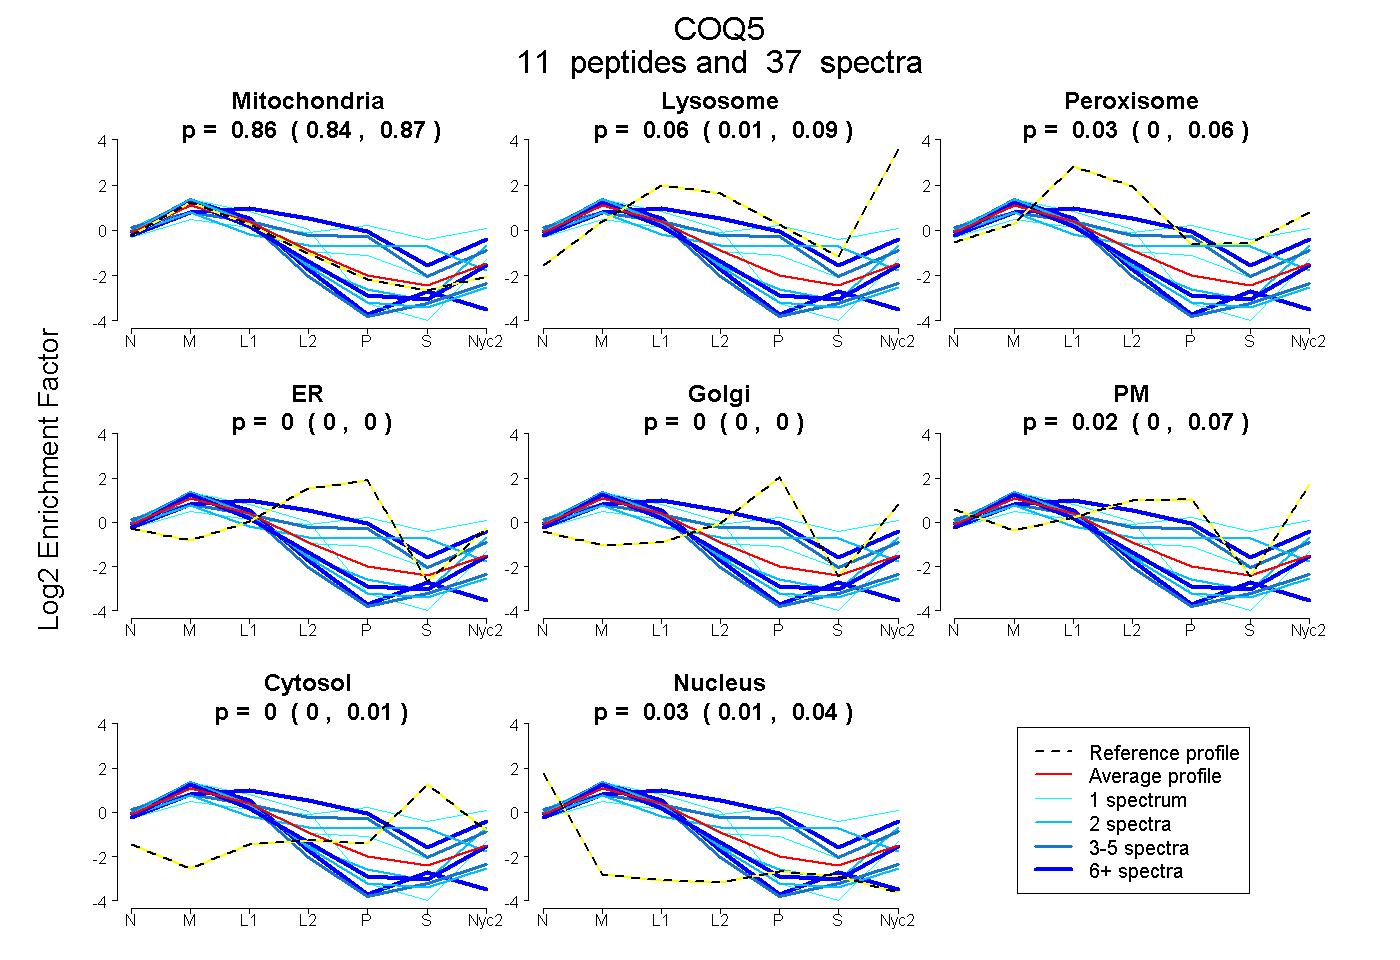
0.838 | 0.872
0.009 | 0.088
0.004 | 0.058
0.000 | 0.000
0.000 | 0.000
0.000 | 0.068
0.000 | 0.010
0.005 | 0.039
6peptides
spectra

0.966 | 0.990
0.000 | 0.000
0.000 | 0.000
0.000 | 0.000
0.000 | 0.000
0.000 | 0.000
0.006 | 0.031
12peptides
spectra
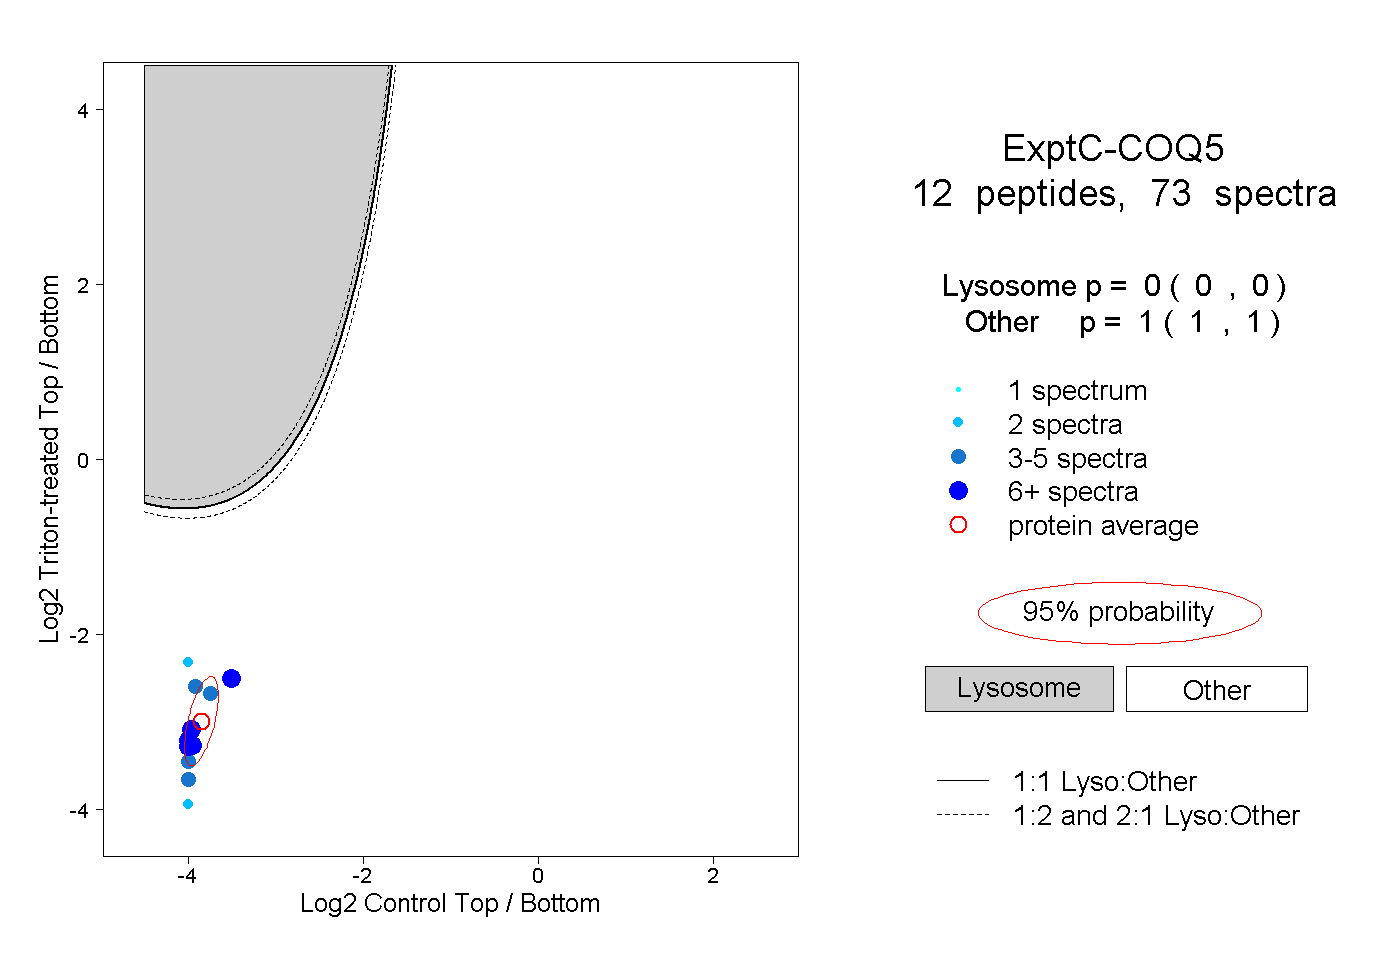
0.000 | 0.000
1.000 | 1.000
3peptides
spectra
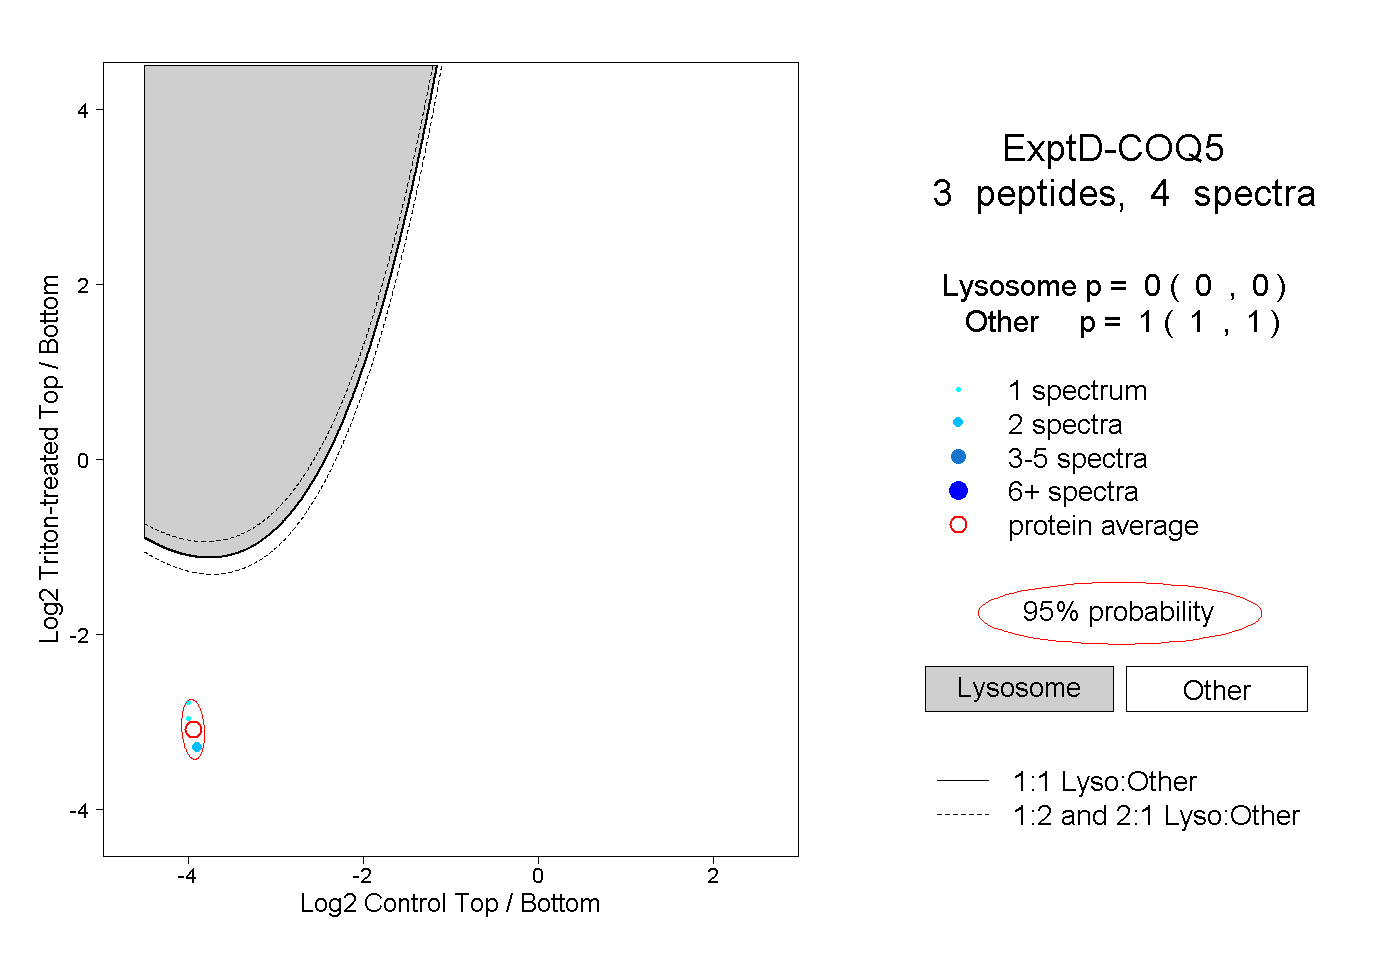
0.000 | 0.000
1.000 | 1.000